Feasibility Study - Howard County Public Schools
Feasibility Study - Howard County Public Schools
Feasibility Study - Howard County Public Schools

You also want an ePaper? Increase the reach of your titles
YUMPU automatically turns print PDFs into web optimized ePapers that Google loves.
June 20121
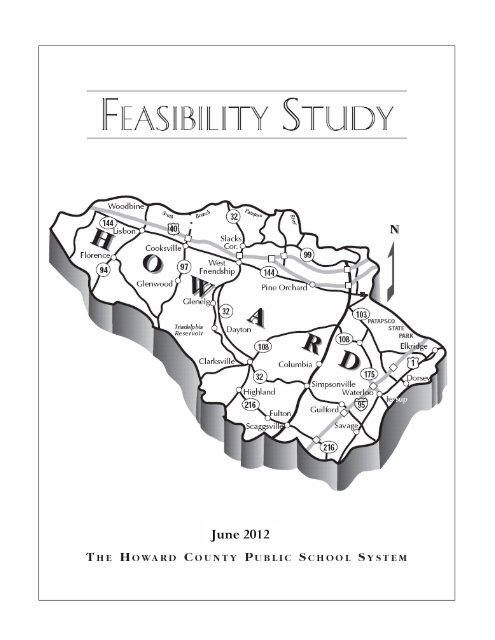
<strong>Feasibility</strong> <strong>Study</strong>An Annual Review of Long-Term CapitalPlanning and Redistricting OptionsJune 2012<strong>Howard</strong> <strong>County</strong> Board of EducationSandra H. French, ChairmanFrank J. Aquino, Esq., Vice ChairmanAllen Dyer, Esq.Ellen Flynn GilesBrian J. MeshkinJanet Siddiqui, M.DCynthia L. VaillancourtTomi Williams, Student Member 2011–2012ContributorsOffice of the SuperintendentOffice of the Chief Operating OfficerDepartment of Facilities Planning and ManagementDepartment of Technology – Systems DevelopmentDepartment of Pupil TransportationOffice of School PlanningFor information contact:Joel A. Gallihue, Manager of School Planning10910 Route 108Ellicott City, MD 21042410-313-71842012 <strong>Feasibility</strong> <strong>Study</strong> i
2012 <strong>Feasibility</strong> <strong>Study</strong> i
June 14, 2012To:Board of Education MembersFrom:Sydney L. Cousin, SuperintendentSubject:June 2012 <strong>Feasibility</strong> <strong>Study</strong> – An Annual Review of Long-term Capital Planningand Redistricting OptionsThis document evaluates Long-Range Capital Improvement Program/Redistricting Plans for theschool years 2013–2024. Site acquisition planning for needs beyond this period is also presentedin the document. Staff provides recommended changes to the Capital Improvement Program forFY 2014 and suggested redistricting to support the Capital Improvement Program.Elementary redistricting that would take effect at the start of the 2013–2014 school year isconsidered for this year. Other plans are included for future years. A goal of this study is toidentify the best scenario for sequencing redistricting to make best use of capacity in a time ofsignificant capital budget challenges. Some plans may be adjusted over the next year based uponobserved conditions and feedback in the redistricting process. I believe this report promotes opendiscussion about goals for redistricting which allows for transparency in the long-range planningprocess.I look forward to working with the Board of Education on the review of this document.2012 <strong>Feasibility</strong> <strong>Study</strong>ii
Table of ContentsI. Introduction ............................................................................................................................ 1II. Executive Summary ............................................................................................................... 3A. Capacities ........................................................................................................................ 4B. Redistricting Approach ................................................................................................... 5C. Recommendations ........................................................................................................... 6III. Planning Considerations ........................................................................................................ 7A. Projections....................................................................................................................... 7B. Capacities ...................................................................................................................... 11C. Regions ......................................................................................................................... 11D. Capital Planning and Sewer Service Area .................................................................... 12E. Land Bank ..................................................................................................................... 12IV. Needs and Strategies ............................................................................................................ 13A. Elementary School Section ........................................................................................... 13B. Middle School Section .................................................................................................. 20C. High School Section ..................................................................................................... 24V. Specific Recommendations for Phased Redistricting .......................................................... 28A. 2013 – New Elementary School Capacity – Comprehensive Elementary SchoolRedistricting ......................................................................................................................... 28B. 2014 – New Middle School Capacity – Middle School Redistricting .......................... 29C. 2016 – Elementary School Redistricting ...................................................................... 31D. 2016 – High School Redistricting ................................................................................. 31VI. Evaluation ............................................................................................................................ 32A. Scoring Methodology.................................................................................................... 32B. 2013 – Elementary School Redistricting ...................................................................... 32VII. Maps ..................................................................................................................................... 35VIII. Pre- and Post-Measures........................................................................................................ 47List of TablesTable 1. Facilities with On Site Wastewater Treatment .............................................................. 12Table 2. 2013 Elementary School Redistricting .......................................................................... 29Table 3. 2014 Middle School Redistricting ................................................................................. 30Table 4. 2016 Elementary School Redistricting .......................................................................... 31Table 5. 2016 High School Redistricting ..................................................................................... 31List of FiguresFigure 1. Capital Budget and Redistricting Process ...................................................................... 3Figure 2. Planned School Capacity ................................................................................................ 4Figure 3. Comparison of Projections ............................................................................................. 9Figure 4. Columbia Town Center ES <strong>Schools</strong> ............................................................................. 15Figure 5. Northeastern Region Elementary Utilization ............................................................... 17Figure 6. Southeastern Region Elementary Utilization ............................................................... 19Figure 7. Northeastern & Southeastern Regions Combined Utilization (MS) ............................ 222012 <strong>Feasibility</strong> <strong>Study</strong>iii
I. IntroductionEach year, the Board of Education reviews capital planning options and redistricting scenariosthrough a feasibility study. The annual student enrollment projection is introduced in thisreport along with scenarios that are intended to provide a comprehensive look at suggestedcapital additions, renovations, and any attendance area adjustments that are anticipated withinthe ten-year Capital Improvement Program period. Plans examined in this document may onlybe implemented through the Board of Education’s approval of both the capital budget and anychange to current school attendance areas. This report is the starting point for the annualprocess of developing the capital budget.This document presents a single staff recommendation. Other scenarios may be developed infuture attendance area review processes. Plan assessments are included in an attempt to showhow plans compare to the eleven policy considerations in Policy 6010 School AttendanceAreas.This is a planning document and the recommendations presented for review are notfinal. The conditions which have influenced past enrollment projections may change. Newplans may be needed to react to population shifts or new residential development plans.Experience has shown that by presenting this report annually, assumptions and trends can begiven consideration on a regular basis and appropriate adjustments can be made to the capitalbudget or redistricting plans. Redistricting proposals are not certain until approved by theBoard of Education.The recommendation in this document is presented for each organizational level (elementary,middle, and high) using a pre- and post-measures format. The pre-measures format shows theeffect of projected enrollment without any redistricting. The pre-measures format also showsFY13 Capital Budget projects as approved. The post-measures format shows the impact ofprojected enrollment within a redistricting plan. The post-measures format includes capitalprojects recommended in this document for the FY14 Capital Budget. If these projects are notapproved, other plans must be developed. These same reports and other tables are included inthe electronic document A Supplement to the 2012 <strong>Feasibility</strong> <strong>Study</strong> 1 .The redistricting process includes the following:<strong>Feasibility</strong> <strong>Study</strong>. Projects in the Capital Improvement Program that increase studentcapacity will be tested in the feasibility study with a redistricting plan consistent withstated redistricting policy goals. Plans will be linked within and across organizationallevels to form a short- and long-range redistricting plan. The Board of Education willreview the plan and set direction as appropriate during the capital budget presentationseach year. In years where redistricting is anticipated, the Attendance Area Committee willcritique the plan, providing review and comment to the Superintendent.Recommending Redistricting Plans. In years where redistricting is planned, staff willrefine the goal directed short- and long-range plan based on the most current set ofprojections that conform to System-Level-Process Requirements. The Attendance AreaCommittee will apply the direction set by the Board of Education, the System-Level-1 http://www.hcpss.org/boundarylines/2012 <strong>Feasibility</strong> <strong>Study</strong> 1
Process Requirements, and the standards and factors in Policy 6010. Staff will makemodifications as appropriate. The plan will be presented at regional meetings, critiqued bythe public, and adjusted as appropriate.Approving Attendance Area Adjustments. In years where redistricting is occurring, theBoard of Education will schedule public hearing(s) in accordance with Policy 2040 <strong>Public</strong>Participation in Meetings of the Board of Education on the proposed attendance areaadjustments. Their deliberations will also include a public work session(s) with staff andthe members of the Attendance Area Committee.Assessing the Process. In years where redistricting is occurring, the Board of Educationwill assess the process at the end of the redistricting cycle. Modifications will be made asappropriate prior to the beginning of the next cycle.After the feasibility study has introduced the new projection, tested redistricting scenarios,and recommended capacity adjustments, the capital budget is prepared. In years whereredistricting is occurring, the capital budget and redistricting processes run in parallel, asillustrated in the following chart.2012 <strong>Feasibility</strong> <strong>Study</strong>2
Figure 1. Capital Budget and Redistricting ProcessII.Executive SummaryThis feasibility study forms the basis for the development of the Capital ImprovementProgram (CIP). In September 2012 the FY 2014 Superintendent’s Proposed Capital Budgetwill be presented, which includes the five-year CIP. The following sections highlight staffconsiderations included in this study which may be included in the CIP.2012 <strong>Feasibility</strong> <strong>Study</strong>3
A. CapacitiesProjections continue to support construction of the new Elementary School #41 to open inAugust 2013 at Ducketts Lane and the new Middle School #20 to open in August 2014within the Oxford Square development. Even with the construction of ES #41, a secondnew elementary school in the eastern part of the county is needed as early as 2019. Theadditions and new schools approved as part of the FY 2013-2022 Long-Range MasterPlan are included in the assumptions for this document. These include ES #41, GormanCrossing ES, Phelps Luck ES, and Stevens Forest ES (construction starting this summer),MS #20 and Running Brook ES (design underway).Longer term projects are included in the assumptions. For instance, the 100-seat additionat Waverly ES is to be funded in FY 2016 to help manage growth in Ellicott City fromTurf Valley. An addition to Wilde Lake MS will be critical to help manage growth instudent enrollment stemming from the Columbia Town Center development. ES #42 issupported by this projection to address future needs in both the Northeastern theSoutheastern Regions. This study validates the need for all of the projects recentlyapproved for the long range plan. Looking ahead to the next capital budget, the followingnew projects will be recommended for the FY 2014-2023 Long-Range Master Plan:1. Deep Run ES Addition – Initial planning has been funded for the first majorrenovation to the school since it opened in 1991. Due to the continued growth inthis area, a 100-seat addition should be planned as part of this project.2. Laurel Woods ES Addition – Enrollment projections indicate additional capacity isneeded at this school. The 100-seat addition should be planned for 2015.Figure 2. Planned School Capacity (New recommendations in bold)2012 <strong>Feasibility</strong> <strong>Study</strong>4
B. Redistricting ApproachIdeally, redistricting should be done as infrequently as possible moving as few students asnecessary within the constraints listed in Policy 6010 School Attendance Areas.Redistricting is recommended for the Board of Education to consider in the fall of 2012,for implementation in August 2013. This would be the second year of movement in acomprehensive plan designed to coincide with the completion of new constructionprojects, including ES #41 and MS #20. The primary goal of the proposed 2013redistricting plan is to relieve the Northeastern Region with the new capacity at ES #41.Other goals are to relieve Talbott Springs ES and Phelps Luck ES in the Columbia EastRegion using existing capacity, and to relieve Veterans ES by using existing capacity.The staff recommendation is a result of an evaluation of multiple scenarios in a processcompleted over the last several months. Other proposals may be developed and evaluatedby future Attendance Area Committees or in future feasibility studies. In many cases, staffrecommendations are modified as a result of the Attendance Area Committee process andthe Board of Education has ultimately adopted a different plan than was originallyproposed in the feasibility study.Board of Education policy standards recommend consideration of redistricting undercertain conditions. While these conditions include opening a school or adjusting to someother change, the most likely trigger is when school capacity utilization projections falloutside the minimum or maximum target range of 90–110 percent school capacity over aperiod of time.When redistricting is considered, Policy 6010 School Attendance Areas identifies elevenfactors to be considered in the development of plans:1. Educational welfare of the impacted students in both the sending and receivingschools.2. Frequency with which students are redistricted.3. Impact on the number of students bused and the distance bused students travel.4. Cost.5. The demographic makeup and academic performance of students in both thesending and receiving schools.6. Number of students to be redistricted.7. Maintenance of feeder patterns.8. Changes in a school’s program capacity.9. Impact on specialized or regional programs.10. Functional and operational capacity of school infrastructures.11. Building utilization. (90–110 percent where possible)Capacity utilization over time and the number of students redistricted are often given themost attention. The other factors are emphasized to different degrees. The distribution ofenrollment growth and capacity is never perfect, so it can be difficult to make plans thatsatisfy all factors and move few students.2012 <strong>Feasibility</strong> <strong>Study</strong>5
C. Recommendations1. Plan must strike a balance between policy considerations.Scenario testing over the years has shown how difficult it is to satisfy all eleven policyconsiderations equally for redistricting without creating a plan that moves atremendous number of students. The recommendations presented in this report areanalyzed in relation to these eleven considerations. This discussion will help to initiatethe 2012 attendance area review process.2. Comprehensive multi-year redistricting should continue.The following schools are currently above 110 percent capacity utilization (basedupon the official September 30, 2011, enrollment report), are also projected to seesignificant student population growth over the next several years, and have noapproved capital plans for classroom additions which can entirely handle this growth.Consequently, these schools should be under consideration for potential redistricting:a) Bellows Spring ESb) Deep Run ESc) Elkridge ESd) Talbott Springs ESe) Veterans ESf) Waterloo ESg) Bonnie Branch MSh) Ellicott Mills MSi) Murray Hill MSj) <strong>Howard</strong> HSIn order to develop a viable redistricting plan, other school attending areas which arenot part of the schools listed above may be included as part of the ultimateredistricting plan. Considerations and redistricting alternatives are discussed in SectionIV and specific redistricting recommendations are listed in Section V of the document.3. Long-term planning is needed for additional capacity.Staff continues to work closely with Department of Planning and Zoning and <strong>Public</strong>Works staff to actively pursue land acquisition opportunities for school sites in theeastern part of the county. This study reaffirms the need for a second new elementaryschool in the east for 2019. Although this year’s projection is slightly lower at theelementary level in 2019 than last year, experience has shown that obtaining sites isdifficult so a site should be obtained soon for ES #42. Last year, this reportrecommended careful consideration of options for additional classroom seats atexisting locations like Laurel Woods ES and Guilford ES in the FY13 Capital Budget.While redistricting approved to take effect in August 2012 addressed overcrowdingissues at Guilford ES, an addition is still recommended for Laurel Woods ES. 2 Futuregrowth will also occur in Columbia and Turf Valley. The plans for the Running BrookES and Wilde Lake MS classroom additions will provide interim capacity forColumbia, though it is likely that an additional elementary facility 3 will be required tosupport growth from the Columbia Town Center development in the next decade.Projections continue to support the need for elementary redistricting in 2016 to relieve2An addition at Laurel Woods ES was discussed by the Board last November when the redistrictingdecision was made and a feasibility study for that addition is under way.3This could be Faulkner Ridge ES reopened. This could also be a new facility either at the FaulknerRidge site or somewhere else in the Town Center vicinity.2012 <strong>Feasibility</strong> <strong>Study</strong>6
overcrowding at Manor Woods ES associated with continuing Turf Valley growth.The addition at Waverly ES can maintain target capacity utilization until 2020.Considering the limited potential for expanding schools outside of the sewer servicearea, a Turf Valley school site should be obtained.III.Planning ConsiderationsThis section identifies planning assumptions and considerations. The annual projection isdeveloped with assumptions about enrollment growth that have evolved over the years. Otherplanning considerations involve implications for capital facilities. Some of the previousplanning assumptions have been adjusted, while others have been added for this study. Thissection presents a discussion of the major components and adjustments included in this year’splanning assumptions.A. ProjectionsProjections used for this study were generated in the spring of 2012. The projection modeland methodology used by the <strong>Howard</strong> <strong>County</strong> <strong>Public</strong> School System (HCPSS) is based onhistoric cohort survival ratios—the number of students that “survive” from one grade level(cohort) to the next. Then the effects of new housing yields and the net effects of resale ofexisting housing stock and apartment turnover are added to the projection. Using thebirths and actual enrollment data history 4 , these variables are combined to project the totalstudent enrollment at each school for September 30 of each future year. The projection ispresented out to 2026 in this document, although it extends further into the future. Itshould be noted that the trends shown after the first five or six years are less reliable;however, certain decisions like site acquisition are appropriately informed by the later partof the projection.Planning issues can become apparent by examining the consistency of the currentprojection to those made in previous years. When several years of enrollment projectionsare graphed, the basic trends are consistent in each of the projections. By using a ten-yearseries, these three consecutive annual projections share some years of data. This bringssome stability to the projection but still allows the projections to indicate differences, sothat changing trends can be apparent.As shown in Figure 3, the 2012 elementary projection tracks fairly closely with the 2011projection. Both the 2012 and 2011 projections are significantly higher than the 2010projection. While the trend is very similar, the 2012 elementary projection is slightlyhigher than the 2011 elementary projection until 2017. In later years the 2012 projection isless intense than 2011. The ten-year trend in the 2012 projection is for elementaryenrollment to increase by 2,761 students by 2021. As a result of this enrollment growth,the capacity utilization of all elementary schools combined will begin to exceed 110percent by 2023. Projects approved as part of the FY13 CIP can absorb this growth with4A five-year series, in this case September 30, 2007 through 2011 enrollments, is used in theprojection.2012 <strong>Feasibility</strong> <strong>Study</strong>7
some proposed additions noted in this document. Based on the long-term growth trends, asite for a future elementary school in the east should be banked.The 2012 projection for the middle level tracks fairly closely with the 2011 projection.The 2010 projection followed the same trend but was more abrupt in its changes. Thetrend in the 2012 projection is for middle enrollment to increase by 1,944 students by2021. This is 872 students over the existing systemwide capacity of 12,617 and thecapacity utilization of all middle schools combined will be over 112 percent. Over 80percent of this projected growth is in the east, for which the 662 seat MS #20 is ourprimary response. For the remaining needs, redistricting should utilize western capacityas was done at the elementary level. Other capacity through additions during renovationshould be studied.The three projections for the high school level track fairly closely. After 2016 the 2012projection trends lower than the 2011 projection. The trend in the 2012 projection is forhigh school enrollment to increase by 1,909 students by 2021. As a result of thisenrollment growth, the capacity utilization of all high schools combined will begin toexceed 110 percent by 2023. Of this growth, 85 percent is in the Northeastern Region.Current system wide facilities can accommodate growth with some redistricting throughthis decade. Based on the long-term growth trends, land should be banked for future needsin the vicinity of the Northeastern Region.2012 <strong>Feasibility</strong> <strong>Study</strong>8
Figure 3. Comparison of ProjectionsProjected ES EnrollmentProjected ES Enrollment270002600025000240002300022000210002011 2012 2013 2014 2015 2016 2017 2018 2019 2020 2021School Yearproj2012proj2011proj2010The graphs onthe leftconsider theelementary,middle, andhigh schoolprojectionsfor this yearin comparisonto theprojectionsmade for 2010and 2011.Projected MS EnrollmentProjected MS Enrollment1400013500130001250012000115001100019000185001800017500170001650016000Projected MS Enrollment2011 2012 2013 2014 2015 2016 2017 2018 2019 2020 2021School YearProjected HS Enrollment2011 2012 2013 2014 2015 2016 2017 2018 2019 2020 2021proj2012proj2011proj2010proj2012proj2011proj2010These overalldepictions ofthe projectionby level helpto showgeneralrelationshipsin trends.The 2012projectiontracks closelywith the 2011projection atall levels.Both 2011and 2012 aresignificantlyhigher at theelementarylevel than2010.School Year2012 <strong>Feasibility</strong> <strong>Study</strong> 9
When developing the annual projection, School Planning staff reviews the differencesbetween previous projections to determine if data inputs were correct or if anyassumptions should be reconsidered. Projections are simply an organized way of makingassumptions based upon available data. The explanation for differences betweenprojections is a different set of data. Specific contributing factors to differences betweenprojections include:1. Changes in Development Horizon. Each year Department of Planning and Zoningprovides a housing projection for each school. New approvals or changes to phasing ofexisting projects can alter the timing and intensity of growth at specific schools.2. Difficulty Projecting Kindergarten. Kindergarten is typically the most difficultgrade to project because the time between the data point (birth) and enrollment is fiveyears as opposed to one for all other survival ratios. Another source of variation in thedata set is changed eligibility time for kindergarten. The state requirement to providefull-day kindergarten also has impacted our data set as parents who used to pay forprivate full-day kindergarten switched to public school. These changes are mostlybehind us and we now have a number of similar years to compare for developingprojections. In theory these changes will have some impact on projections until thecohort which started kindergarten in 2004 graduates in 2017.3. Changing Housing Yields. For the past few years, staff has observed lowerelementary pupil generation, particularly in the west, for single family detachedhousing units. Conversely, higher housing yields are being observed for multi-familyunits. This impacts the northeast and southeast where many such units are anticipated.Individual projections for each school help to capture local effects.4. Changes in Cohort Survival Ratios. With each new data set, the newest survivalratio is added to the five-year historical base. If it is different, as has been the casewith enrollment that is not associated with move-ins, a new historical average results.The new average is then amplified throughout the model, meaning the projection, overtime, can be sensitive to a relatively small change in the survival ratio. The moreimmediate impact to projected enrollment is the initial size of the cohort.5. Changes at Feeder <strong>Schools</strong>. If enrollment in an elementary school feeding a middleschool increases or decreases, the effect can be magnified at the middle school,particularly if several feeder schools change in the same direction. The effect of theoutgoing cohort may also have an impact.6. Geographically Matched Data. In the past, the Department of Planning and Zoning(DPZ) kept land use data manually using different basic geographic units from theplanning polygons used by the Office of School Planning. This required someinterpretation to transfer the data. Now DPZ provides their land use data using HCPSSplanning polygons. With the implementation of the new student informationmanagement system, improvements to address data verification procedures haveenhanced the quality of the data. In both circumstances, the increased precision hasinfluenced the projection.2012 <strong>Feasibility</strong> <strong>Study</strong>10
B. CapacitiesCapital planning and Adequate <strong>Public</strong> Facilities Ordinance (APFO) regulatory review 5 ofdevelopment depend upon accurate capacity assessments and sound projections to derivecapacity utilization projections. Capacities of schools dictate the calculation of capacityutilization percentage. This measure allows for a level comparison of the effect ofprojected enrollment. By Board of Education policy, a school with capacity utilizationover 110 percent is referred to as over-utilized while a school below 90 percent capacityutilization is referred to as under-utilized.Capacities have been actively studied since 2005. The systemwide facility assessmentsurvey by Gilbert Architects has provided additional information relating to each level.Capacities for high schools were revised by the Board of Education in 2009. It is expectedthat minor adjustments will be made to existing elementary and middle school capacitieson a case by case basis as classroom counts are validated using the facility assessmentresults and other internal validation methods. Redistricting planning at any level is moreequitable with more accurate capacities assigned.C. RegionsThis study presents school information in six regions. The regions were originallydesigned to correspond to planning regions used by the county. As new facilities havebeen built, the school planning regions were not adjusted. The service areas of the sixregions do not match up by level—elementary, middle and high. This disconnect,however, has not been a problem for developing projections and redistricting scenariosbecause modeling is done at the school and planning polygon level, with the results thensummed for regions.<strong>Howard</strong> <strong>County</strong> Department of Planning and Zoning has not needed HCPSS regions toalign with their planning areas. The Adequate <strong>Public</strong> Facilities Ordinance Housing UnitAllocation charts allocate units based upon fixed planning areas. When new developmentsare proposed, the Adequate <strong>Public</strong> Facilities Ordinance School Test (elementary andmiddle) is based upon whether the assigned schools are open or closed. A region test ismade at the elementary level only. The law closes a region to development if capacityutilization for the region exceeds 115 percent, even if the assigned elementary school doesnot exceed 115 percent. This condition is projected; however, by the time this conditionoccurs it is likely HCPSS will have taken steps to address the enrollment growth bybuilding new capacity or redistricting.The school regions remain important in making comparisons and discussion of the impactof real estate trends on student enrollment in different areas of the county. The regionsserve a general purpose for identifying trends but staff can re-aggregate data in severallogical grouping of schools to study specific matters. A recent example is evaluation ofproposed development of Downtown Columbia.5 Capacity is only relevant to APFO at the elementary and middle level. There is no high school capacity test.2012 <strong>Feasibility</strong> <strong>Study</strong>11
D. Capital Planning and Sewer Service AreaSome of our facilities are outside of the sewer service area and require on-site treatmentsystems. For example, the Bushy Park Replacement Project required construction of anew shared septic system with Glenwood MS. This was due to the need to meet morestringent groundwater discharge permit requirements mandated by the MarylandDepartment of the Environment. HCPSS currently has different types of on-site wastewater treatment systems in operation which include conventional septic systems andsystems which manage or treat effluent prior to discharging into the fields. The mosttechnically advanced and costly systems are membrane batch reactors (MBR) andsequencing batch reactors (SBR) which are essentially modular automated sewagetreatment plants. Existing conventional septic facilities will eventually fail due to age ornew standards will require costly improvements. The following facilities are operatingwith on-site wastewater treatment:Table 1. Facilities with On-Site Wastewater TreatmentSchool (s) System Type NoteGlenelg HSSBRMarriotts Ridge HS/Mount View MS SBRGlenwood MS/Bushy Park ESSBRFolly Quarter MS/Triadelphia Ridge ES Septic with sand filtration MBR underconstructionManor Woods ESSeptic with sand filtrationWest Friendship ESSepticDayton Oaks ESSBRWhile the systems currently in place are well designed and maintained, there is noguarantee that future requirements for discharge will not be more stringent. For thisreason, staff now considers new sites that would require on-site waste treatment to be asignificant cost consideration. Future capital planning will seek projects that have accessto public sewer, consistent with the Maryland Smart Growth Act, and local planningimplementation which direct new residential growth into Priority Funding Areas withinthe sewer service area.E. Land BankThe HCPSS maintains a bank of sites 6 for future school construction. For many years,most of the land bank consisted of school site reservations that came out of Columbiaplanning and development. Approximately 67 acres of land remain in reservation. <strong>Howard</strong><strong>County</strong> has aided the school system in the past through exchanges of county land whereneeded. Earlier this year, site acquisitions occurred which allow ES #41 and MS #20 to bebuilt to serve growth in the Route 1 Corridor. These acquisitions increased the landHCPSS owns by approximately 30 acres. HCPSS will continue to reach out to local and6 The land bank is listed in the Capital Budget , in Appendix E on page 72.2012 <strong>Feasibility</strong> <strong>Study</strong>12
state agencies as it searches for additional sites along the Route 1 Corridor and other areasof identified growth. To this end, the efforts of <strong>Howard</strong> <strong>County</strong> Government staff havebeen greatly appreciated. A full inventory of school sites is presented annually in thecapital budget.IV.Needs and StrategiesPrior to examining the redistricting plan it is necessary to review the implications of the newprojection and identify needs and potential strategies.A. Elementary School SectionWhen school capacity utilization is outside of the acceptable range (90–110 percent), staffpresents plans in this document. At the countywide level, elementary capacity utilizationis projected to remain between 90 percent and 110 percent for the next decade. While it ispossible to balance all schools countywide, the surplus capacity and growingneighborhoods do not share the same geography. A surplus of capacity will remain in theWestern Region due to lower than anticipated pupil generation rates and larger facilities.Some of this capacity was used to provide relief to the Southeastern Region in aredistricting approved in November 2011. The Northeastern, Northern, and ColumbiaEast Regions have schools exceeding policy targets for capacity utilization. The ColumbiaWest and Northeastern Regions are beginning to exceed 110 percent. Most of theseneeds will be addressed by redistricting proposed in this document to take effect in 2013including the opening of ES #41. The growth in enrollment in these areas can beattributed first to new development and secondly to neighborhood turnover. Redistrictingis recommended in the context of upcoming capacity projects with phases in 2013 and2016. Future redistricting to open a second eastern elementary school will occur in 2019or later.Columbia East RegionNeed:Capacity utilization isprojected to be above 110%for Phelps Luck ES andTalbott Springs ES.Strategy:Classroom additions atPhelps Luck ES, StevensForest ES and Thunder HillES will be completed in2013 and will be used toprovide relief to bothschools.Phelps Luck ES and Talbott Springs ES are both significantly overcrowded. TalbottSprings ES currently hosts eight relocatable classrooms, with two more to be added in2012 <strong>Feasibility</strong> <strong>Study</strong>13
August 2012. Phelps Luck ES is currently undergoing a major renovation which includesthe addition of four classrooms; however, projections indicate that this additional spacewill be insufficient to accommodate the student population when completed in August2013. When the additions at Stevens Forest ES and Thunder Hill ES are completed, bothschools will have available space to relieve other schools in and around this region.Redistricting is recommended to take advantage of this capacity.Columbia West RegionNeed:The Columbia Town Centerdevelopment will impact thisregion, especially RunningBrook ES. The region exceeds110% by 2021 in thisprojection, ultimatelyrequiring the need for anadditional elementary schoolif pupil generation ratesremain as forecast today.Strategy:Provide interim capacity withan addition at Running BrookES.The 2012 projection accounts for planned build-out of the Columbia Town Center project.A key capital project for managing interim growth is the Running Brook ES additionwhich is planned to open in August 2014. Even with this addition, Running Brook ES isexpected to exceed 110 percent utilization by 2019. Previous feasibility studies consideredthe possibility of a plan to redistrict from Clemens Crossing ES to use capacity at PointersRun ES. The resulting space at Clemens Crossing ES could then accept the southernportion of the Running Brook ES attending area where the Columbia Town Center growthis expected. Such a plan remains a possibility in the future.During the review of redistricting plans last year, the Board of Education heard from agroup that had studied the Swansfield ES projection in 2011 and devised a redistrictingplan which used Longfellow ES and Clarksville ES to relieve Swansfield ES. This planalso included changes from Wilde Lake MS to Clarksville MS and from Wilde Lake HSto River Hill HS. Since then, the September 30, 2011, official enrollment 7 for SwansfieldES was lower than projected, and the 2012 projection for Swansfield ES incorporates thistrend. Because of the lower projection, Swansfield ES is not recommended forredistricting this year.While the Running Brook ES addition buys time in the Columbia West Region, somecombination of new capacity and redistricting will be required to accommodate growth inthe area. If pupil generation ratios appear lower than anticipated, plans can be adjusted.7 9/30/2011 enrollment at Swansfield ES was 537 with 101.7%, capacity utilization.2012 <strong>Feasibility</strong> <strong>Study</strong>14
Figure 4 shows the combined utilization of the elementary schools surrounding ColumbiaTown Center. Utilization declines through 2014 showing the impact of new capacity atStevens Forest ES and Running Brook ES. Redistricting proposed in 2013 as presented inthis report balances capacity utilization of East Columbia schools. Redistricting in WestColumbia is deferred. The effects of the Columbia Town Center Proposal can be absorbedwith other anticipated development through the year 2021 when capacity utilization of thisgroup of schools will exceed 110 percent. Capacity utilization for the group continues togrow until it appears to surpass 120 percent in 2027, which equates to 573 seats above 100percent utilization. A redistricting strategy alone, which uses schools that are reasonablynearby, will not provide an adequate solution to accommodate the projected growth.Figure 4. Columbia Town Center Elementary <strong>Schools</strong>Combined Capacity Utilization: Columbia Town Center Elementary <strong>Schools</strong>115Percent Utilization1101051009590852012 2013 2014 2015 2016 2017 2018 2019 2020 2021 2022YearFaulkner Ridge Center, previously used as a staff development and training facility, wasclosed on July 1, 2011. Evaluation of using this site as swing school space duringrenovations of nearby schools is underway. Use of the site for a new school remains anoption.2012 <strong>Feasibility</strong> <strong>Study</strong>15
Northeastern RegionNeed:Significant enrollment growth isprojected. Available capacity in thisregion as well as adjacent regions isnot sufficient to absorb long-termprojected enrollment growth.Strategy:Redistrict to ES #41, which is underconstruction and will be ready toopen in August 2013. This willprimarily accommodate enrollmentgrowth at Bellows Spring ES,Elkridge ES and Deep Run ES.Consider a second new school for2019.Bellows Spring ES exceeds 110 percent utilization at this time and will exceed 125percent capacity utilization in 2013 with enrollment projected at nearly double its existingcapacity in a decade. Deep Run ES and Elkridge ES and other schools adjacent to this areawill also be severely impacted by new development in the Corridor Activity Center zoningalong Route 1.The redistricting plan summarized in Table 2 of this document is designed to open thenew school in August 2013. The school attending area would be comprised of portions ofBellows Spring ES, Elkridge ES, and Rockburn ES attending areas. While Rockburn ESis not overcrowded, the ES #41 site is in the current Rockburn ES attending area.Redistricting to balance the removal of that neighborhood and to make the new capacityserve the entire region must include Rockburn ES. Other schools including but not limitedto Deep Run ES and Waterloo ES will experience relief through comprehensiveredistricting associated with the opening of this school.Capacity utilization at Veterans ES is above 110 percent and clearly needs relief. For thisreason redistricting in the northern part of the Veterans ES attending area is recommendedto access capacity at Waverly ES through St. John’s Lane ES. The original plan to openVeterans ES with the current attending area was based on projections made over fiveyears ago. Subsequent projections have consistently indicated stronger growth trends atVeterans ES. For example, the net yield of students from apartment turnover in theVeterans ES attending area is now double what it was in 2007. It is now appropriate toreconsider boundaries given current and projected enrollment.Figure 5 shows that capacity utilization in the region (includes ES #41) will exceed 110percent in 2015 and growth continues through much of the projection confirming the needfor a second school in this region as early as 2019.2012 <strong>Feasibility</strong> <strong>Study</strong>16
Figure 5. Northeastern Region Elementary UtilizationNortheastern Region Utilization (ES)130125Percent Utization12011511010510095% Util w/ New ES110%2012 2013 2014 2015 2016 2017 2018 2019 2020 2021YearNorthern RegionNeed:Manor Woods ES requiresrelief after 2015.Strategy:Consideration ofredistricting or capitaloptions in later years.In the years beyond 2015, Manor Woods ES is projected to be above the 110 percentcapacity utilization standard and trending above 200 percent. This condition has varieddepending upon the timing of the Turf Valley development. A key feature of capitalplanning for this development is the Phase II addition at Waverly ES. Constructing thisaddition in 2015 and redistricting can help relieve overcrowding at Manor Woods ES.Growth at Veterans ES presents an additional challenge because a redistricting solutionfor Veterans ES is likely to increase Waverly ES enrollment. Even without this challenge,Waverly ES alone could not completely help Manor Woods ES in absorbing growth atTurf Valley. The proposed 2013 elementary redistricting scenario summarized in Table 2on page 28 accesses capacity in the Western Region at West Friendship ES to help relieve2012 <strong>Feasibility</strong> <strong>Study</strong>17
overcrowding at Veterans ES. Additional capacity at Bushy Park ES and TriadelphiaRidge ES is being reserved to help relieve Manor Woods ES in future redistricting plans,possibly as early as 2015. A new elementary school in Turf Valley that is sized to thecurrent educational specifications is needed by 2020. This school could be a replacementfor West Friendship ES. Much of the territory for existing schools will be bused no matterwhich school they are assigned, but a Turf Valley school could have an assigned walkarea (HCPSS does not currently own a site within the Turf Valley development).Southeastern RegionNeed:Future enrollment growth isprojected. The approved 2012redistricting plans acknowledgedthe need for additional capacityat Laurel Woods ES within thenear term.Strategy:Redistricting approved inNovember 2011 will take effectthis August and utilize availablecapacity in the Western Region.A large addition at GormanCrossing ES is planned forAugust 2013. Seek sites anddevelopment opportunities forthe long-term.Elementary redistricting was approved in this region last November that will take effect inAugust 2012. The new projection indicates that this redistricting will serve the goal ofbalancing capacity in this region. Figure 6 (on the next page) indicates the effectiveness ofthe approved August 2012 redistricting plan. The 2012 projection reflects the postmeasures of the redistricting approved in November 2011. The 2011 projection was madebefore this redistricting was approved and reflects the higher enrollments of the currentgeography. All schools in the region are projected to open well below 110 percentutilization at the start of this coming school year. The region will not exceed 110 percentutilization until 2017. In evaluating the redistricting for Laurel Woods ES the Boarddetermined that part of the growth should be addressed with an addition to the school.Growth continues in the region. Bollman Bridge ES will be at the leading edge of thisregional growth and will dictate the need for the next elementary school currently plannedfor 2019.2012 <strong>Feasibility</strong> <strong>Study</strong>18
Figure 6. Southeastern Region Elementary Utilization (Pre and post redistricting)Southeastern Region Utilization (ES)140135130Percent Utization1251201151101051009590Proj 2012110%Proj 20112012 2013 2014 2015 2016 2017 2018 2019 2020 2021YearWestern RegionNeed:More fully utilize capacityin the Western Region.Strategy:Redistricting from theNorthern and SoutheastRegions.Elementary capacity in the Western Region exceeds need. Ten years ago, overcrowding inwestern elementary schools was significant. The September 30, 2000, enrollment reportindicated that the region was at 120 percent capacity utilization. The construction ofDayton Oaks ES, the replacement of Bushy Park ES and lower enrollment trends for theregion have lowered the overall capacity utilization, which is now approaching 70 percentfor the region. The projections which preceded the construction of the new Bushy ParkES and Dayton Oaks ES anticipated larger pupil generation rates than the existing housingstock has produced. Redistricting plans outlined in the sections of this document whichaddress the Northern Region anticipates using some of this capacity in other parts of thesystem as was done to balance the Southeastern Region. The plans presented in thisdocument will be further evaluated as part of the Attendance Area Committee process toensure proper balance and to avoid any return to the overcrowding of a decade ago.2012 <strong>Feasibility</strong> <strong>Study</strong>19
West Friendship ES has consistently shown declining enrollment in recent projections.West Friendship ES operates with a septic system outside the sewer service area and couldeventually be subject to more stringent requirements which may require expensiveupgrades. In previous studies, an alternative approach to SBR or MBR upgradesexamined the possibility of closing West Friendship ES and using existing capacity in theshort term. Eventually a new school is likely in proximity to the Turf Valley developmentand within the sewer service area.B. Middle School SectionAt the countywide level, middle school capacity utilization reaches 110 percent in 2018.While it is possible to balance all schools countywide, the challenge has been that thecapacity and enrollment growth do not share the same geography. The Columbia WestRegion exceeds 110 percent capacity utilization by 2014 and the Northern Region exceeds110 percent by 2019. Columbia Town Center approval is taken into account in thisprojection. The Northeastern and Southeastern Regions combined exceed 110 percentcapacity utilization in 2013. For this reason, MS #20 has been moved to 2014, a site hasbeen selected at Oxford Square, and the project is in planning. The Western Region iswithin acceptable levels but there are specific schools exceeding policy targets. TheColumbia East Region has surplus capacity.Columbia East RegionNeed:Some capacity exists in thisregion.Strategy:Monitor long-term needs.Both Lake Elkhorn MS and Oakland Mills MS have available capacity for the foreseeablefuture. These schools are geographically positioned to provide some relief to schools inthe Northeastern Region, but the enrollment of Northeastern Region schools includingBonnie Branch MS, Elkridge Landing MS, and Mayfield Woods MS continues to increasethroughout the projection well above any available capacity in Columbia East.2012 <strong>Feasibility</strong> <strong>Study</strong>20
Columbia West RegionNeed:Enrollment does not exceed110% of regional capacityuntil 2014.Strategy:Utilize redistricting tomanage capacity needs untila new Western MS isrequired late in theprojection.The Columbia West Region begins to show capacity utilization above 110 percent in 2014and the condition continues for the rest of the projection. Wilde Lake MS begins to needrelief starting in 2013, and an addition is planned as part of the renovation of that school,which is scheduled to begin in 2015. It is possible that some relief can also be provided byredistricting to Clarksville MS, for which the projection indicates a declining enrollmenttrend.Northeastern RegionNeed:Significant enrollment growthis projected. Availablecapacity in this region as wellas adjacent regions is notsufficient to absorb long-termprojected enrollment growth.Strategy:Long-term growth trends inthis region can only beaccommodated by theopening of a MS #20, whichis currently scheduled to beconstructed and ready to openin August 2014.Figure 7 shows the need for a new middle school to serve the Northeastern andSoutheastern Regions, which continue to climb above 110 percent utilization after the year2016 (includes MS #20). The two regions are combined in this graphic because most ofthe need is focused in the Route 1 Corridor. It is likely that the school to be built at212012 <strong>Feasibility</strong> <strong>Study</strong>
Oxford Square can relieve both regions. The later years of the projection seem to indicatethe need for more capacity within the long-range plan and should be monitored in futureplanning analysis. For now the projection certainly supports acquisition or development ofadditional school site options in the Route 1 Corridor through agreements with otheragencies or developers.Figure 7. Northeastern & Southeastern Regions Combined Utilization (MS)155Northeastern & Southeastern Regions Combined Utilization (MS)145Percent Utization13512511510595MS #20662 Seats2012 2013 2014 2015 2016 2017 2018 2019 2020 2021YearWhile a site for MS #20 has been selected at Oxford Square, additional sites should be secured in the east forthe land bank.Ellicott Mills MS will exceed 110 percent capacity utilization in 2012. All of the otherschools in the region exceed 110 percent utilization by 2013. While there is availablecapacity in the Columbia East Region, using it does not appear to be a viable permanentsolution. Relocatable classrooms will be used as required until MS #20 opens.Northern RegionNeed:Enrollment does notexceed 110% ofregional capacity until2019.Strategy:Monitor long-termneeds.% Util% Util w/ New MS110%2012 <strong>Feasibility</strong> <strong>Study</strong>22
In the years beyond 2019, the Northern Region is projected to be above the 110 percentcapacity utilization guideline, with between 200–300 seats needed in the region through2020. When continued growth in the adjacent Northeast Region is factored in with theneed in this region, the land bank site on Marriottsville Road will probably be needed toserve as a middle school in the future.Southeastern RegionNeed:Significant enrollmentgrowth is projected.Available capacity in thisregion, as well as adjacentregions, is not sufficient toabsorb long- termprojected enrollmentgrowth.Strategy:Long-term growth trendsin this region can only beaccommodated by theopening of MS #20, whichis currently scheduled tobe constructed and readyto open in August 2014.Murray Hill MS will exceed 110 percent utilization in 2012 and Patuxent Valley MSexceeds 110 percent capacity utilization in 2015. The region exceeds 110 percentutilization in 2018 and continues to rise for the foreseeable future. As in the NortheasternRegion, new development on Route 1 is affecting these projections. As was discussed inthe section for the Northeastern Region, the opening of MS #20 will serve both theNortheastern and Southeastern Regions, and will address most of the need expected in theregion through the end of this decade. Projected needs beyond this time period will bemonitored.2012 <strong>Feasibility</strong> <strong>Study</strong>23
Western RegionNeed:Mount View MS exceeds110% capacity utilizationin 2016.Strategy:Monitor long-term needs.Capacity utilization in the region remains within targets throughout the projection. MountView MS is projected to exceed 110 percent capacity utilization in 2016 and will requirerelief. This was discussed at length with the 2009 Attendance Area Committee and anumber of redistricting plans involving Folly Quarter MS were considered. Some arguedthat the growth at Mount View MS was not a strong enough trend to warrant action.Others argued that if change wasn’t made soon it will be more difficult later. The plannedmiddle school redistricting for 2014 does not include redistricting in this area. Thisdocument has evaluated a 2016 elementary redistricting that would provide relief toManor Woods ES. A similar plan could be evaluated at the middle school level in a futurestudy. The use of the Marriottsville Road site for a new Western MS will ultimately serveto relieve Mount View MS as well as the Northern and Columbia West Regions.C. High School Section<strong>County</strong>wide high school capacity utilization meets policy targets until 2023. While thecapacity exists to balance all schools countywide, the challenge has been that the capacityand enrollment growth do not share the same geography. The Northeastern Region,comprised of <strong>Howard</strong> HS and Long Reach HS, exceeds 110 percent capacity utilizationby 2015. This is followed by Centennial HS and Wilde Lake HS, schools with adjoiningattending areas, in 2016 and 2019, respectively. The Western Region includes ReservoirHS which exceeds 110 percent capacity utilization by 2018. Capacity does exist withinthe Western Region to relieve Reservoir HS. Mt Hebron HS in the Northern Region willnot exceed 110 percent capacity utilization of its expanded capacity until 2024.2012 <strong>Feasibility</strong> <strong>Study</strong>24
Columbia East RegionNeed:Some capacity exists inthis region.Strategy:Consider using capacity tohelp absorb Route 1Corridor growth.The Columbia East Region high school is Oakland Mills HS. Capacity exists at thisschool for the foreseeable future. Capacity may be utilized to relieve the NortheasternRegion, which includes Long Reach HS and <strong>Howard</strong> HS. Redistricting plans shown inthis document for 2016 extend the Oakland Mills HS attendance area east to take on partof the Route 1 Corridor. The resulting attendance area would be more elongated but highschools are regional facilities, by nature. It should be noted that three more enrollmentprojections and feasibility studies come before a decision is likely on this redistricting.Long-term planning discussions are likely to be framed by future additions to the landbank.Columbia West RegionNeed:Capacity utilization isbelow 110% for WildeLake HS until 2019, theone school in this region.Strategy:Monitor Columbia TownCenter Proposal. Onlyredistrict into this region ifabsolutely necessary.2012 <strong>Feasibility</strong> <strong>Study</strong>25
The Columbia West Region high school is Wilde Lake HS. The projection for this schoolremains between 90–110 percent utilization until 2019. With only a few classrooms ofremaining capacity, plans to redistrict students into Wilde Lake HS should be avoidedunless absolutely necessary. This projection models the effect of the Columbia TownCenter proposal and adequate capacity exists to accommodate growth at Wilde Lake HSuntil 2019.Northeastern RegionNeed:Significant enrollmentgrowth is projected.Available capacity in thisregion is not sufficient toabsorb long-term projectedenrollment growth.Strategy:Consider movement ofJROTC program from<strong>Howard</strong> HS in August2013. Plan redistrictingwith Long Reach HS andOakland Mills HS for2016. Evaluate capitalplanning options ofadditions and banking afuture school site.<strong>Howard</strong> HS and Long Reach HS serve the Northeastern Region. <strong>Howard</strong> HS already isexceeding 110 percent utilization. In 2015 the region will exceed 110 percent capacityutilization and the trend is to steadily worsen through the projection, exceeding 120percent by 2017.Removing a regional program may be a reasonable interim strategy. <strong>Howard</strong> HScurrently hosts a regional Junior Reserve Officer Training Corps (JROTC) program.Another JROTC program is nearby at Oakland Mills HS. Marriotts Ridge HS wasdesigned to host a JROTC but does not have a program. If the program were moved from<strong>Howard</strong> HS to Marriotts Ridge HS, the three regional programs would be accessible to awider geography and enrollment levels could be maintained at current levels through2014. When the <strong>Howard</strong> JROTC program was last examined, more than half of theattendees were from the <strong>Howard</strong> attending area, this suggests that a program elsewheremight draw students out of <strong>Howard</strong> and provide some capacity relief.Redistricting between <strong>Howard</strong> HS, Long Reach HS, and Oakland Mills HS can providesome improved capacity utilization. Oakland Mills HS represents the best interim optionfor capacity relief; however, it can only provide about 150 seats. Additional redistrictingto balance the remaining needs requires difficult choices to use the available capacity at2012 <strong>Feasibility</strong> <strong>Study</strong>26
Marriotts Ridge HS. It should be noted that three more enrollment projections andfeasibility studies come before a decision is likely on this redistricting. Long-termplanning discussions are likely to be framed by future additions to the land bank.In the long-term (after 2020), this projection indicates that approximately 800 seats areneeded in the Northeastern Region. For this reason it is recommended that the land bankinclude a site large enough for a high school.Northern RegionNeed:Capacity needs in theregion have beenaddressed with theexpansion of Mt. HebronHS.Strategy:Monitor long-term needs.The Northern Region has balanced capacity utilization for most of the projection.Centennial HS will need to be monitored given the projected utilization above 110 percentafter 2017. A recommendation to move the JROTC program from <strong>Howard</strong> HS toMarriotts Ridge HS has been suggested in this document.Southeastern RegionNeed:Capacity is adequatethrough 2021.Strategy:Monitor long-term needs.2012 <strong>Feasibility</strong> <strong>Study</strong>27
The Southeastern Region exceeds 110 percent capacity utilization in 2021 and steadilyincreases later in the projection. For now the existing facility is matched to projectedgrowth within most of the long-range planning period but future projections should bemonitored.Western RegionNeed:Relief is needed atReservoir HS after 2018.Strategy:Monitor long-term needs.The Western Region does not exceed 110 percent capacity utilization, and no redistrictingor major capital planning appears to be necessary for the next decade. Reservoir HSshould be monitored because this projection indicates it will exceed 110 percentutilization by 2018.V. Specific Recommendations for Phased RedistrictingThis report breaks redistricting into phases for 2013, 2014, and 2016. This approach isdesigned to take advantage of timing for new capacity already underway and allow time tospace out new capacity needs.A. 2013 – New Elementary School Capacity – Comprehensive Elementary SchoolRedistrictingThe 2013 elementary redistricting plan is designed to create a new attending area for ES#41, which is being built in accordance with the recently approved elementary educationalspecification of 600 seats plus a pre-kindergarten program capacity of 80. Thisredistricting plan is also designed to relieve Talbott Springs ES by taking advantage ofexisting capacity in the Columbia East and Northeastern Regions, as well as relievingovercrowding at Veterans ES. The plan is modular in nature, allowing any of the threemajor components of the plan to be executed independently. The staff recommendation isthat the complete plan outlined in Table 2 be implemented.2012 <strong>Feasibility</strong> <strong>Study</strong>28
Table 2. 2013 Elementary School RedistrictingSending Receiving Polygons # StudentsBellows Spring ES New ES #41 33, 35, 1033, 1035, 2035, 4035 132Bellows Spring ES Rockburn ES 83, 84, 1083 123Bellows Spring ES Waterloo ES 76, 1076 166Deep Run ES Bellows Spring ES 80 95Deep Run ES Waterloo ES 78, 79, 1079, 1080 138Elkridge ES New ES #41 36,1036, 2043 171Ilchester ES Rockburn ES 95, 1085, 1095, 2085, 2095, 3085 186Phelps Luck ES Jeffers Hill ES 264 26Phelps Luck ES Thunder Hill ES 311 76Rockburn ES Elkridge ES 44, 92 27Rockburn ES Ilchester ES 91 42Rockburn ES New ES #41 37, 1037, 2037 156St John’s Lane ES Waverly ES 160, 161, 162, 1160, 1161, 1162, 2392161Talbott Springs ES Stevens Forest ES 96 160Thunder Hill ES Northfield ES 148, 276, 1148, 2148 132Veterans ES Hollifield Station ES 105, 1105, 1308 110Veterans ES St John’s Lane ES 106, 191, 1106 230Waterloo ES Bellows Spring ES 1266 101Waterloo ES Ilchester ES 74, 2074 59Waterloo ES New ES #41 266 86Waterloo ES Thunder Hill ES 100, 1100 110Waterloo ES Worthington ES 98, 1098 103Waverly ES West Friendship ES 166, 4169, 6169, 7169 86Worthington ES Ilchester ES 1094, 2093, 3093, 4093 112B. 2014 – New Middle School Capacity – Middle School Redistricting2012 <strong>Feasibility</strong> <strong>Study</strong>Total 2,866This redistricting is designed to make a new attending area for MS #20. The school wouldprovide relief to Mayfield Woods MS and Patuxent Valley MS. In turn these schools canprovide relief to Elkridge Landing MS and Murray Hill MS. The enrollment data will bereviewed again in next year’s projections before a final recommendation is made in 2013.The comprehensive redistricting plan balances capacity throughout the system andaddresses changes made in 2012 and 2013 at the elementary level to remove many smallfeeds (a net reduction of ten small feeds with three others improved). In 2020, five yearsafter this plan would take effect, eight schools would be over 110 percent, where elevenwould have been over 110 percent with no changes.29
Table 3. 2014 Middle School RedistrictingSending Receiving Polygons # StudentsBonnie Branch MS Elkridge Landing MS 83, 1083, 1091, 2091, 3091 84Bonnie Branch MS Lake Elkhorn MS 261, 264, 1261 27Bonnie Branch MS Mayfield Woods MS 76, 1076 75Dunloggin MS Ellicott Mills MS 111, 1111, 2111 22Dunloggin MS Patapsco MS 104, 105, 308, 1104, 1105, 1308,2308161Elkridge Landing MS New MS #20 36, 37, 1036, 1037, 2037, 2043 188Ellicott Mills MS Bonnie Branch MS 67, 1067, 1074 48Ellicott Mills MS Dunloggin MS 103, 217, 1102, 1103 100Ellicott Mills MS Oakland Mills MS 65, 1065, 2065 45Glenwood MS Folly Quarter MS 212, 213 48Hammond MS Lime Kiln MS 8, 221, 1008, 1221, 1227, 2221 126Mayfield Woods MS Lake Elkhorn MS 71, 1071, 2071, 3071 53Mayfield Woods MS New MS #20 33, 35, 82, 266, 1033, 1035, 1082,1266, 2035, 2082, 3035, 4035200Mayfield Woods MS Bonnie Branch MS 70, 1070, 2070 45Mount View MS Folly Quarter MS 170, 178, 179, 1170, 1178, 1179,2170Mount View MS Glenwood MS 224, 229, 231, 232, 1229, 1231,2229Murray Hill MS Patuxent Valley MS 1, 12, 46, 116, 260, 267, 272, 1001,1046, 1116, 1260, 1272, 2046, 30469960255Oakland Mills MS Hammond MS 56, 1056, 2056, 3056 54Patapsco MS Mount View MS 160, 161, 162, 1160, 1161, 1162,1282161Patuxent Valley MS Lake Elkhorn MS 1048, 2048 10Patuxent Valley MS Hammond MS 17, 18, 1017, 1018 84Patuxent Valley MS New MS #20 26, 27, 30, 32, 48, 1026, 1027, 1030,1032, 2030, 30481772012 <strong>Feasibility</strong> <strong>Study</strong>Wilde Lake MS Clarksville MS 61, 130, 1130 28Total 2,11730
C. 2016 – Elementary School RedistrictingThis redistricting is designed to relieve Manor Woods ES and position West FriendshipES to serve as a Turf Valley holding school. This redistricting is planned for 2016because the addition to Waverly ES will not open until 2016 and an early opening is not alikely CIP change. The plan utilizes available Western Region capacity at Bushy Park ESand Triadelphia Ridge ES. Ultimately a new school built in accordance with theelementary educational specification of 600 seats is needed and is likely to be built in TurfValley.Table 4. 2016 Elementary School RedistrictingSending Receiving Polygons # StudentsManor Woods ES Triadelphia Ridge 178, 179, 1178, 1179 74ESManor Woods ES Waverly ES 164, 167, 1164 141Manor Woods ESWest FriendshipESD. 2016 – High School RedistrictingWest FriendshipES304, 305, 1304, 1305 117Bushy Park ES 224, 229, 231, 232, 1229,741231, 2229Total 406Redistricting between <strong>Howard</strong> HS, Long Reach HS, and Oakland Mills HS isrecommended as an interim measure for capacity relief. Other more comprehensiveredistricting plans may be considered. It should be noted that three more enrollmentprojections and feasibility studies come before a decision is likely on this redistricting.Long-term planning discussions are likely to be framed by future additions to the landbank.Table 5. 2016 High School RedistrictingSending Receiving Polygons # StudentsHammond HS Atholton HS 273 1<strong>Howard</strong> HS Long Reach HS 38, 39, 42, 124, 277, 300,1038, 1124, 1300, 2038<strong>Howard</strong> HS Oakland Mills HS 261, 1261 23Long Reach HS Oakland Mills HS 33, 35, 266, 1033, 1035, 1266,2035, 3035, 4035270175Total 4692012 <strong>Feasibility</strong> <strong>Study</strong>31
VI.EvaluationA. Scoring MethodologyThis section evaluates the recommendation for 2013 redistricting. The supplement for thisdocument includes an evaluation from the perspectives of the individual changes after themiddle school redistricting is completed in 2014, and after the elementary and high schoolredistricting is completed in 2016. The evaluation of the plan is based upon theconsiderations listed in Policy 6010 School Attendance Areas. This policy is published onthe HCPSS website. 8 Scorecards comparing the plan at each level (elementary, middle,and high) help show how the plan fares in light of the criteria for consideration set byPolicy 6010 and are included in the Supplement to the 2012 <strong>Feasibility</strong> <strong>Study</strong>. Theseinclude explanations and other tabulations of the effects of the 2012 proposal and theaggregate plan. Should additional plans be proposed, they can be evaluated in the samemanner.Plans are also evaluated under two capacity utilization measures. The first is the 115percent capacity utilization standard for the Adequate <strong>Public</strong> Facilities Ordinance (APFO)school test. The second is the 90 percent to 110 percent capacity utilization target inPolicy 6010 School Attendance Areas. Impacts of the suggested strategy in this feasibilitystudy are illustrated in a pre- and post-measures approach which is attached to thisdocument.B. 2013 – Elementary School RedistrictingThe proposed plan results in the students receiving Free and Reduced-Price MealsServices (FARMS) and the Maryland School Assessments (MSA) score distributionstaying about the same among all schools at the elementary level. A strength of the planis that the number of schools projected to have improved utilization in 2013 is increased.The plan indicates target utilization would be a weakness in 2023 however this plan isproposed anticipating a number of future capital projects, of which ES #42 in the east ismost important. In the 2012–2023 time period, the average number of years that schoolsare below 90 percent utilization is reduced. Also for this period, the average number ofyears that schools are over 110 percent is reduced. These are indicators of bettersystemwide capacity use.Given the scope of redistricting that is proposed by this plan, the average proximity toschools is slightly lower. This plan would most likely have similar costs to the presenttransportation cost based upon a preliminary evaluation by Pupil Transportation staff. Anumber of factors including bell times, multi-level bus assignments, and fuel costs willfactor into the actual cost and are difficult to determine at this time.The plan results in movement of approximately 12.4 percent of elementary enrollment.This plan proposes to move 2,866 students. By way of comparison, the comprehensiveelementary redistricting last year moved a projected 1,157 students. A recent localbenchmark to consider for redistricting a single level can also be found in the Harford<strong>County</strong> <strong>Public</strong> School System. Harford <strong>County</strong> <strong>Public</strong> School System approved8http://www.hcpss.org/board/policies/6010.pdf2012 <strong>Feasibility</strong> <strong>Study</strong>32
elementary redistricting for the 2011–2012 school year. Approximately 1,900 elementarystudents, representing 11 percent of the Harford <strong>County</strong> <strong>Public</strong> School System elementarypopulation, transferred to new schools.The plan eliminates one of five existing islands (non-contiguous attending areas) at theelementary level. The reason to avoid islands is that contiguous attendance areas improvethe sense of community and may expand walking areas. Some islands have not beeneliminated because it appeared to be a less disruptive scenario that still balanced capacity.Plans should avoid moving students more than once within five years at the elementarylevel. The summary of all plans discussed in this document is included in the supplementand also indicates no movement twice at the same level. This plan does not propose tomove any students more than once at the elementary level in a five-year period. The lastredistricting in this area occurred in 2007 to open Veterans ES and involved themovement of approximately 1,185 students. The youngest students that were impacted bythis plan are already in middle school. Even the incoming kindergarteners in 2007, whowere not technically impacted by the redistricting, will have risen to sixth grade when theproposed plan takes effect.In past years when redistricting was discussed, concerns were articulated to the Board thatstudents who were impacted by the elementary redistricting would also be impacted by themiddle school redistricting. For this reason and capacity concerns, the Board directed staffto shift the MS #20 schedule from opening in 2015 to 2014. Now, because the openings ofthe schools are in consecutive years, a rising fifth grader directly impacted by elementaryredistricting will simply rise into the new middle school assignment and complete threeyears at the same middle school.The plan increases small feeds from elementary to middle school which is a weakness.However, the net result of this plan and the proposed 2014 middle school redistrictingplan would be a reduction in the total number of small feeds. One “double small feed”(geography where the feed is below 15 percent at both levels) is eliminated by this plan.The use of available capacity at existing schools reduces the average number of yearsschools have a capacity utilization below 90 percent, and the opening of ES #41 helps toreduce the average number of years schools have over 110 percent capacity utilizationfrom 2013–2024.The most significant strengths of this plan are the opening of ES #41 as a walk-ableneighborhood school, an improved balance of elementary capacity utilization over thenext decade, and an eventual reduction in small feeds.2012 <strong>Feasibility</strong> <strong>Study</strong>33
Table 6. 2013 Plan AssessmentElementary School Summary Current Aggregate Plan Assessment Criteria(ES Average = 19%) 19.4% 20.0% Standard Deviation reduced by 25% orBalance FARMS %StdDev 16.24 16.67NEGLIGIBLEmore = Strength; increased by 25% ormore = Weakness; otherwise NegligibleBalance MSA Reading PassRateBalance MSA Math PassRateConsecutive Years Under110%Target UtilizationChanged <strong>Schools</strong> 2013Target UtilizationChanged <strong>Schools</strong> 2023Proximity to SchoolNon-Contiguous AttendanceAreasTransportation CostsStudents MovedStudents moved too soonafter last moveSmall ES-to-MS Feeds(under 15%)Double Small FeedsLow Utilization(Under 90%) 2012-2023High Utilization(Over 110%) 2012-2023(ES Average = 93%) 93.0% 92.9%StdDev 4.83 4.82NEGLIGIBLE(ES Average = 94%) 94.0% 93.9%StdDev 4.56 4.63NEGLIGIBLE# of <strong>Schools</strong> Strengthened NA 8# of <strong>Schools</strong> Weakened NA 4Mean 7.4 8.1NEGLIGIBLE# of <strong>Schools</strong> Strengthened NA 18# of <strong>Schools</strong> Weakened NA 1STRENGTH# of <strong>Schools</strong> Strengthened NA 8# of <strong>Schools</strong> Weakened NA 11WEAKNESS# of <strong>Schools</strong> Strengthened NA 10# of <strong>Schools</strong> Weakened NA 9Mean 5722 5646(smaller # = closer set of polygons) NEGLIGIBLENumber of "Islands" 4 3STRENGTH(ES Avg Rating = 0.00) NA 0.02(pos=savings; neg=cost)STRENGTHNumber NA 2866% of Enrollment NA 12.4%HIGHM OVEM ENTNumber NA 0% of Enrollment NA 0.0%NOM OVEM ENT# of Small Feeds 18 21WEAKNESS# of Double Small Feeds 3 2STRENGTHPer-school Average Years 3.9 2.6STRENGTHPer-school Average Years 4.5 3.9STRENGTHStandard Deviation reduced by 25% ormore = Strength; increased by 25% ormore = Weakness; otherwise NegligibleStandard Deviation reduced by 25% ormore = Strength; increased by 25% ormore = Weakness; otherwise NegligibleMean increased by 1.0 or more =Strength; reduced by 1.0 or more =Weakness; otherwise NegligibleChanges result in schools 90-110% =Strength; Changes result in schoolsoutside of 90-110% = Weakness;otherwise NegligibleChanges result in schools 90-110% =Strength; Changes result in schoolsoutside of 90-110% = Weakness;otherwise NegligibleMean reduced by 100 or more = Strength;increased by 100 or more = Weakness;otherwise Negligible"After" count lower than "Before" =Strength; "After" higher = Weakness;otherwise NegligibleMean increased = Strength; meanreduced = Weakness; otherwiseNegligible% of enrollment greater than 10% = HighMovement, 5% to 10% = ModerateMovement, less than 5% = LowMovement% of enrollment greater than 3% = HighMovement, greater than 0% to 3% =Moderate Movement, 0% = No Movement"After" count lower than "Before" =Strength; "After" higher = Weakness;otherwise Negligible"After" count lower than "Before" =Strength; "After" higher = Weakness;otherwise NegligibleMean reduced by 0.1 or more = Strength;increased by 0.1 or more = Weakness;otherwise NegligibleMean reduced by 0.1 or more = Strength;increased by 0.1 or more = Weakness;otherwise NegligibleStrength Moderate Weakness2012 <strong>Feasibility</strong> <strong>Study</strong>34
VII. MapsOn the following pages the staff-proposed plans are mapped. It should be noted that none ofthese maps represent approved plans. Should any redistricting be approved by the Board ofEducation in November 2012, it would take effect in August 2013 with any applicablephasing. Plans for future years, such as those recommended in this document, would alsorequire Board of Education approval in the fall of the year before they are to take effect. Bythat time conditions may change and a different plan may be the better option. Long-termplans are presented in an effort to have a transparent planning process and to provide contextfor the capital budgeting process.2012 <strong>Feasibility</strong> <strong>Study</strong>35
2012 <strong>Feasibility</strong> <strong>Study</strong> 36Map 1 – 2013 Elementary School Redistricting – ES #41 Vicinity View A
Map 2 – 2013 Elementary School Redistricting – ES #41 Vicinity View B2012 <strong>Feasibility</strong> <strong>Study</strong>37
Map 3 – 2013 Elementary School Redistricting – East Columbia Vicinity View2012 <strong>Feasibility</strong> <strong>Study</strong>38
Map 4 – 2013 Elementary School Redistricting – Ellicott City Vicinity View2012 <strong>Feasibility</strong> <strong>Study</strong>39
Map 5 – 2014 Middle School Redistricting MS #20 View2012 <strong>Feasibility</strong> <strong>Study</strong>40
Map 6 – 2014 Middle School Redistricting Southeastern Region View2012 <strong>Feasibility</strong> <strong>Study</strong>41
Map 7 – 2014 Middle School Redistricting East Columbia View2012 <strong>Feasibility</strong> <strong>Study</strong>42
Map 8 – 2014 Middle School Redistricting Ellicott City View2012 <strong>Feasibility</strong> <strong>Study</strong>43
Map 9 – 2014 Middle School Redistricting Western View2012 <strong>Feasibility</strong> <strong>Study</strong>44
Map 10 – 2016 Elementary School Redistricting2012 <strong>Feasibility</strong> <strong>Study</strong>45
2012 <strong>Feasibility</strong> <strong>Study</strong> 46Map 11 – 2016 High School Redistricting
VIII. Pre- and Post-MeasuresOn the following pages the effect of the staff proposed plans on capacity utilization aredepicted in tabular form. The recommendation in this document is presented for eachorganizational level (elementary, middle, and high) using a pre-/post-measures format. Thepre-measures format shows the effect of projected enrollment without any redistricting. Thepre-measures format also shows FY13 capital projects as approved. The post-measures formatshows the impact of projected enrollment within a redistricting plan. The post-measuresformat includes capital projects recommended in this document for the FY14 Capital Budget(as shown in Figure 2). If these projects are not approved, other plans must be developed.These same reports and other tables are included in the electronic document A Supplement tothe 2012 <strong>Feasibility</strong> <strong>Study</strong>.2012 <strong>Feasibility</strong> <strong>Study</strong>47
Pre-MeasuresChart reflects May 2012 Projections, Board of Education's FY 2013 approved capacities, and no redistricting.Capacity 2013-14 2014-15 2015-16ELEMENTARY SCHOOLS - Data for Demonstrative Purposes OnlyCapacity Utilization Rates with Board of Education's Approved FY 2013 Capital Budget Projects - Not Test for APFO2016-17 2017-18 2018-19 2019-202020-21 2021-22 2022-23 2023-24Columbia - East 2013 2014 2015 2016 Proj % Util. Proj % Util. Proj % Util. Proj % Util. Proj % Util. Proj % Util. Proj % Util. Proj % Util. Proj % Util. Proj % Util. Proj % Util.Cradlerock ES 487 487 487 487 445 91.4 456 93.6 478 98.2 485 99.6 502 103.1 503 103.3 496 101.8 511 104.9 524 107.6 538 110.5 554 113.8Jeffers Hill ES 421 421 421 421 369 87.6 367 87.2 363 86.2 357 84.8 343 81.5 341 81.0 341 81.0 348 82.7 355 84.3 358 85.0 364 86.5Phelps Luck ES 640 640 640 640 733 114.5 748 116.9 C 780 121.9 C 770 120.3 C 748 116.9 C 730 114.1 727 113.6 734 114.7 740 115.6 C 754 117.8 C 767 119.8 CStevens Forest ES 433 433 433 433 297 68.6 284 65.6 283 65.4 291 67.2 288 66.5 285 65.8 280 64.7 289 66.7 290 67.0 294 67.9 298 68.8Talbott Springs ES 443 443 443 443 645 145.6 C 660 149.0 C 678 153.0 C 671 151.5 C 662 149.4 C 642 144.9 C 645 145.6 C 649 146.5 C 654 147.6 C 661 149.2 C 670 151.2 CThunder Hill ES A 468 468 468 468 408 87.2 414 88.5 422 90.2 420 89.7 411 87.8 400 85.5 394 84.2 403 86.1 408 87.2 421 90.0 429 91.7Region Totals 2892 2892 2892 2892 2897 100.2 2929 101.3 3004 103.9 2994 103.5 2954 102.1 2901 100.3 2883 99.7 2934 101.5 2971 102.7 3026 104.6 3082 106.6Columbia - WestBryant Woods ES 355 355 355 355 361 101.7 372 104.8 376 105.9 391 110.1 391 110.1 402 113.2 407 114.6 410 115.5 C 422 118.9 C 429 120.8 C 435 122.5 CClemens Crossing ES 522 522 522 522 512 98.1 498 95.4 497 95.2 492 94.3 481 92.1 476 91.2 469 89.8 487 93.3 495 94.8 507 97.1 520 99.6Longfellow ES 418 418 418 418 420 100.5 426 101.9 429 102.6 421 100.7 410 98.1 413 98.8 424 101.4 427 102.2 424 101.4 429 102.6 435 104.1Running Brook ES 405 505 505 505 386 95.3 397 78.6 420 83.2 456 90.3 484 95.8 529 104.8 572 113.3 619 122.6 C 655 129.7 C 689 136.4 C 713 141.2 CSwansfield ES 528 528 528 528 605 114.6 598 113.3 602 114.0 603 114.2 608 115.2 C 613 116.1 C 607 115.0 613 116.1 C 623 118.0 C 631 119.5 C 638 120.8 CRegion Totals 2228 2328 2328 2328 2284 102.5 2291 98.4 2324 99.8 2363 101.5 2374 102.0 2433 104.5 2479 106.5 2556 109.8 2619 112.5 2685 115.3 C 2741 117.7 CNortheasternBellows Spring ES A 762 762 762 762 957 125.6 C 1012 132.8 C 1074 140.9 C 1146 150.4 C 1233 161.8 C 1327 174.1 C 1407 184.6 C 1480 194.2 C 1524 200.0 C 1561 204.9 C 1581 207.5 CDeep Run ES 601 601 601 601 817 135.9 C 888 147.8 C 942 156.7 C 969 161.2 C 1005 167.2 C 992 165.1 C 958 159.4 C 940 156.4 C 923 153.6 C 937 155.9 C 967 160.9 CElkridge ES 779 779 779 779 898 115.3 C 919 118.0 C 939 120.5 C 981 125.9 C 999 128.2 C 1048 134.5 C 1099 141.1 C 1116 143.3 C 1128 144.8 C 1146 147.1 C 1160 148.9 CIlchester ES 617 617 617 617 616 99.8 599 97.1 587 95.1 588 95.3 582 94.3 591 95.8 593 96.1 637 103.2 663 107.5 713 115.6 C 747 121.1 CNew ES #41 NS 600 600 600 600Rockburn ES 667 667 667 667 640 96.0 629 94.3 624 93.6 609 91.3 606 90.9 621 93.1 628 94.2 639 95.8 663 99.4 672 100.7 685 102.7Veterans ES 788 788 788 788 1051 133.4 C 1122 142.4 C 1185 150.4 C 1214 154.1 C 1238 157.1 C 1251 158.8 C 1242 157.6 C 1218 154.6 C 1179 149.6 C 1160 147.2 C 1156 146.7 CWaterloo ES 594 594 594 594 697 117.3 C 713 120.0 C 717 120.7 C 738 124.2 C 727 122.4 C 739 124.4 C 738 124.2 C 740 124.6 C 755 127.1 C 769 129.5 C 785 132.2 CWorthington ES 516 516 516 516 523 101.4 545 105.6 537 104.1 526 101.9 516 100.0 503 97.5 494 95.7 478 92.6 472 91.5 474 91.9 493 95.5Region Totals 5924 5924 5924 5924 6199 104.6 6427 108.5 6605 111.5 6771 114.3 6906 116.6 C 7072 119.4 C 7159 109.7 7248 111.1 7307 112.0 7432 113.9 7574 116.1 CNorthernCentennial Lane ES 628 628 628 628 695 110.7 690 109.9 697 111.0 704 112.1 699 111.3 686 109.2 699 111.3 704 112.1 693 110.4 707 112.6 720 114.6Hollifield Station ES 688 688 688 688 643 93.5 641 93.2 639 92.9 648 94.2 658 95.6 677 98.4 698 101.5 717 104.2 733 106.5 750 109.0 758 110.2Manor Woods ES 647 647 647 647 679 104.9 690 106.6 731 113.0 806 124.6 C 887 137.1 C 960 148.4 C 1033 159.7 C 1124 173.7 C 1211 187.2 C 1275 197.1 C 1314 203.1 CNorthfield ES A 672 672 672 672 610 90.8 588 87.5 569 84.7 564 83.9 556 82.7 566 84.2 555 82.6 568 84.5 577 85.9 590 87.8 617 91.8St Johns Lane ES 597 597 597 597 558 93.5 538 90.1 528 88.4 517 86.6 507 84.9 503 84.3 494 82.7 517 86.6 533 89.3 556 93.1 573 96.0Waverly ES A 675 675 675 775 552 81.8 532 78.8 524 77.6 509 65.7 480 61.9 460 59.4 455 58.7 458 59.1 459 59.2 469 60.5 488 63.0Region Totals 3907 3907 3907 4007 3737 95.6 3679 94.2 3688 94.4 3748 93.5 3787 94.5 3852 96.1 3934 98.2 4088 102.0 4206 105.0 4347 108.5 4470 111.6SoutheasternAtholton ES 387 387 387 387 346 89.4 341 88.1 343 88.6 344 88.9 353 91.2 351 90.7 362 93.5 358 92.5 357 92.2 363 93.8 368 95.1Bollman Bridge ES A 663 663 663 663 732 110.4 770 116.1 C 814 122.8 C 849 128.1 C 885 133.5 C 923 139.2 C 941 141.9 C 961 144.9 C 951 143.4 C 940 141.8 C 930 140.3 CForest Ridge ES 626 626 626 626 665 106.2 670 107.0 706 112.8 714 114.1 739 118.1 C 768 122.7 C 792 126.5 C 804 128.4 C 804 128.4 C 799 127.6 C 798 127.5 CGorman Crossing ES A 713 713 713 713 646 90.6 697 97.8 721 101.1 765 107.3 776 108.8 783 109.8 786 110.2 782 109.7 789 110.7 793 111.2 813 114.0Guilford ES 462 462 462 462 439 95.0 441 95.5 439 95.0 445 96.3 435 94.2 438 94.8 420 90.9 415 89.8 411 89.0 410 88.7 420 90.9Hammond ES A 597 597 597 597 610 102.2 619 103.7 611 102.3 617 103.4 631 105.7 659 110.4 688 115.2 C 733 122.8 C 787 131.8 C 837 140.2 C 889 148.9 CLaurel Woods ES 540 540 540 540 556 103.0 582 107.8 581 107.6 570 105.6 601 111.3 601 111.3 599 110.9 602 111.5 635 117.6 C 650 120.4 C 670 124.1 CNew ES #42 NS 0 0 0 0Region Totals 3988 3988 3988 3988 3994 100.2 4120 103.3 4215 105.7 4304 107.9 4420 110.8 4523 113.4 4588 115.0 C 4655 116.7 C 4734 118.7 C 4792 120.2 C 4888 122.6 CWesternBushy Park ES 788 788 788 788 538 68.3 497 63.1 476 60.4 461 58.5 447 56.7 461 58.5 457 58.0 478 60.7 480 60.9 488 61.9 499 63.3Clarksville ES 634 634 634 634 468 73.8 406 64.0 368 58.0 344 54.3 295 46.5 270 42.6 274 43.2 282 44.5 277 43.7 279 44.0 282 44.5Dayton Oaks ES 788 788 788 788 528 67.0 508 64.5 470 59.6 453 57.5 437 55.5 426 54.1 415 52.7 427 54.2 440 55.8 444 56.3 457 58.0Fulton ES 772 772 772 772 648 83.9 673 87.2 712 92.2 747 96.8 767 99.4 798 103.4 798 103.4 784 101.6 777 100.6 769 99.6 750 97.2Lisbon ES 553 553 553 553 411 74.3 404 73.1 384 69.4 393 71.1 416 75.2 424 76.7 442 79.9 457 82.6 473 85.5 487 88.1 504 91.1Pointers Run ES 776 776 776 776 678 87.4 616 79.4 542 69.8 516 66.5 485 62.5 470 60.6 464 59.8 470 60.6 491 63.3 501 64.6 511 65.9Triadelphia Ridge ES 544 544 544 544 394 72.4 409 75.2 409 75.2 421 77.4 414 76.1 419 77.0 418 76.8 409 75.2 402 73.9 392 72.1 378 69.5West Friendship ES 396 396 396 396 273 68.9 264 66.7 245 61.9 239 60.4 225 56.8 213 53.8 218 55.1 222 56.1 239 60.4 247 62.4 254 64.1Region Totals 5251 5251 5251 5251 3938 75.0 3777 71.9 3606 68.7 3574 68.1 3486 66.4 3481 66.3 3486 66.4 3529 67.2 3579 68.2 3607 68.7 3635 69.2<strong>County</strong>wide Totals 24190 24290 24290 24390 23049 95.3 23223 95.6 23442 96.5 23754 97.4 23927 98.1 24262 99.5 24529 98.2 25010 100.1 25416 101.7 25889 103.6 26390 105.6'A' includes additions as reflected in FY 2013 CIP for grades K-5'NS' New School proposed in FY 2013 Capital Budget2012 <strong>Feasibility</strong> <strong>Study</strong> 48
Pre-MeasuresMIDDLE SCHOOLS - Data for Demonstrative Purposes OnlyCapacity Utilization Rates with Board of Education's Approved FY 2013 Capital Budget Projects - Not Test for APFOChart reflects May 2012 Projections, Board of Education's FY 2013 approved capacities, and no redistricting.Capacity2013-14 2014-15 2015-16 2016-17 2017-18 2018-192019-20 2020-21 2021-22 2022-23 2023-24Columbia - East 2013 2014 2015 2016 Proj % Util. Proj % Util. Proj % Util. Proj % Util. Proj % Util. Proj % Util. Proj % Util. Proj % Util. Proj % Util. Proj % Util. Proj % Util.Lake Elkhorn MS 526 526 526 526 459 87.3 444 84.4 450 85.6 462 87.8 482 91.6 513 97.5 532 101.1 529 100.6 521 99.0 509 96.8 515 97.9Oakland Mills MS 506 506 506 506 440 87.0 462 91.3 477 94.3 494 97.6 512 101.2 546 107.9 556 109.9 535 105.7 518 102.4 512 101.2 520 102.8Region MS Totals 1032 1032 1032 1032 899 87.1 906 87.8 927 89.8 956 92.6 994 96.3 1059 102.6 1088 105.4 1064 103.1 1039 100.7 1021 98.9 1035 100.3Columbia - WestHarpers Choice MS 584 584 584 584 539 92.3 577 98.8 617 105.7 655 112.2 663 113.5 659 112.8 650 111.3 639 109.4 649 111.1 649 111.1 653 111.8Wilde Lake MS 506 506 506 662 559 110.5 573 113.2 567 112.1 549 82.9 576 87.0 579 87.5 598 90.3 578 87.3 598 90.3 614 92.7 649 98.0Region MS Totals 1090 1090 1090 1246 1098 100.7 1150 105.5 1184 108.6 1204 96.6 1239 99.4 1238 99.4 1248 100.2 1217 97.7 1247 100.1 1263 101.4 1302 104.5NortheasternBonnie Branch MS 662 662 662 662 783 118.3 C 779 117.7 C 802 121.1 C 823 124.3 C 862 130.2 C 867 131.0 C 888 134.1 C 854 129.0 C 874 132.0 C 872 131.7 C 914 138.1 CElkridge Landing MS 662 662 662 662 747 112.8 796 120.2 C 822 124.2 C 812 122.7 C 826 124.8 C 799 120.7 C 793 119.8 C 791 119.5 C 828 125.1 C 862 130.2 C 873 131.9 CEllicott Mills MS 662 662 662 662 807 121.9 C 800 120.8 C 820 123.9 C 849 128.2 C 900 136.0 C 919 138.8 C 933 140.9 C 941 142.1 C 950 143.5 C 946 142.9 C 932 140.8 CMayfield Woods MS 682 682 682 682 796 116.7 C 833 122.1 C 912 133.7 C 953 139.7 C 1009 147.9 C 1061 155.6 C 1121 164.4 C 1167 171.1 C 1206 176.8 C 1199 175.8 C 1195 175.2 CNew MS #20 NS 0 662 662 662Region MS Totals 2668 3330 3330 3330 3133 117.4 C 3208 96.3 3356 100.8 3437 103.2 3597 108.0 3646 109.5 3735 112.2 3753 112.7 3858 115.9 C 3879 116.5 C 3914 117.5 CNorthernBurleigh Manor MS 662 662 662 662 675 102.0 725 109.5 725 109.5 739 111.6 728 110.0 735 111.0 747 112.8 750 113.3 770 116.3 C 786 118.7 C 803 121.3 CDunloggin MS 662 662 662 662 544 82.2 560 84.6 590 89.1 616 93.1 640 96.7 647 97.7 665 100.5 666 100.6 692 104.5 688 103.9 695 105.0Patapsco MS 662 662 662 662 609 92.0 622 94.0 667 100.8 642 97.0 642 97.0 621 93.8 624 94.3 603 91.1 618 93.4 626 94.6 656 99.1Region MS Totals 1986 1986 1986 1986 1828 92.0 1907 96.0 1982 99.8 1997 100.6 2010 101.2 2003 100.9 2036 102.5 2019 101.7 2080 104.7 2100 105.7 2154 108.5SoutheasternHammond MS 506 506 506 506 521 103.0 581 114.8 611 120.8 C 643 127.1 C 638 126.1 C 646 127.7 C 664 131.2 C 698 137.9 C 716 141.5 C 731 144.5 C 733 144.9 CMurray Hill MS 662 662 662 662 822 124.2 C 923 139.4 C 950 143.5 C 1031 155.7 C 1064 160.7 C 1115 168.4 C 1167 176.3 C 1239 187.2 C 1238 187.0 C 1230 185.8 C 1231 186.0 CPatuxent Valley MS 662 662 662 662 660 99.7 659 99.5 666 100.6 702 106.0 727 109.8 746 112.7 771 116.5 C 789 119.2 C 838 126.6 C 852 128.7 C 881 133.1 CRegion MS Totals 1830 1830 1830 1830 2003 109.5 2163 118.2 C 2227 121.7 C 2376 129.8 C 2429 132.7 C 2507 137.0 C 2602 142.2 C 2726 149.0 C 2792 152.6 C 2813 153.7 C 2845 155.5 CWesternClarksville MS 662 662 662 662 605 91.4 604 91.2 586 88.5 544 82.2 517 78.1 475 71.8 440 66.5 367 55.4 331 50.0 330 49.8 340 51.4Folly Quarter MS 584 584 584 584 522 89.4 512 87.7 542 92.8 529 90.6 543 93.0 506 86.6 504 86.3 473 81.0 474 81.2 468 80.1 468 80.1Glenwood MS 584 584 584 584 554 94.9 565 96.7 573 98.1 553 94.7 520 89.0 484 82.9 475 81.3 467 80.0 471 80.7 482 82.5 509 87.2Lime Kiln MS 701 701 701 701 581 82.9 560 79.9 553 78.9 538 76.7 520 74.2 494 70.5 497 70.9 480 68.5 467 66.6 460 65.6 463 66.0Mount View MS 662 662 662 662 706 106.6 740 111.8 732 110.6 765 115.6 C 767 115.9 C 775 117.1 C 764 115.4 C 747 112.8 730 110.3 734 110.9 750 113.3Region MS Totals 3193 3193 3193 3193 2968 93.0 2981 93.4 2986 93.5 2929 91.7 2867 89.8 2734 85.6 2680 83.9 2534 79.4 2473 77.5 2474 77.5 2530 79.2<strong>County</strong>wide Totals 11799 12461 12461 12617 11929 101.1 12315 98.8 12662 101.6 12899 102.2 13136 104.1 13187 104.5 13389 106.1 13313 105.5 13489 106.9 13550 107.4 13780 109.2'NS' New School proposed in FY 2013 Capital Budget2012 <strong>Feasibility</strong> <strong>Study</strong>49
Pre-MeasuresChart reflects May 2012 Projections, Board of Education's FY 2013 approved capacities, and no redistricting.HIGH SCHOOLS - Data for Demonstrative Purposes OnlyCapacity Utilization Rates with Board of Education's Approved FY 2013 Capital Budget Projects - Not Test for APFOCapacity 2013-14 2014-15 2015-16 2016-17 2017-18 2018-19 2019-20 2020-21 2021-22 2022-23 2023-24Columbia - East 2013 2014 2015 2016 Proj % Util. Proj % Util. Proj % Util. Proj % Util. Proj % Util. Proj % Util. Proj % Util. Proj % Util. Proj % Util. Proj % Util. Proj % Util.Oakland Mills HS 1400 1400 1400 1400 1099 78.5 1094 78.1 1100 78.6 1109 79.2 1167 83.4 1165 83.2 1215 86.8 1264 90.3 1316 94.0 1367 97.6 1354 96.7Columbia - WestWilde Lake HS 1424 1424 1424 1424 1322 92.8 1354 95.1 1394 97.9 1445 101.5 1517 106.5 1566 110.0 1631 114.5 1686 118.4 1677 117.8 1702 119.5 1695 119.0Northeastern<strong>Howard</strong> HS 1420 1420 1420 1420 1692 119.2 1742 122.7 1801 126.8 1867 131.5 1944 136.9 1995 140.5 2041 143.7 2096 147.6 2116 149.0 2136 150.4 2147 151.2Long Reach HS 1488 1488 1488 1488 1388 93.3 1435 96.4 1465 98.5 1561 104.9 1647 110.7 1738 116.8 1824 122.6 1869 125.6 1920 129.0 1978 132.9 2022 135.9Region HS Totals 2908 2908 2908 2908 3080 105.9 3177 109.3 3266 112.3 3428 117.9 3591 123.5 3733 128.4 3865 132.9 3965 136.3 4036 138.8 4114 141.5 4169 143.4NorthernCentennial HS 1360 1360 1360 1360 1413 103.9 1430 105.1 1499 110.2 1538 113.1 1597 117.4 1651 121.4 1672 122.9 1723 126.7 1750 128.7 1778 130.7 1807 132.9Marriotts Ridge HS 1615 1615 1615 1615 1225 75.9 1194 73.9 1231 76.2 1260 78.0 1317 81.5 1349 83.5 1351 83.7 1387 85.9 1374 85.1 1366 84.6 1347 83.4Mt Hebron HS 1280 1400 1400 1400 1439 112.4 1431 102.2 1378 98.4 1400 100.0 1430 102.1 1468 104.9 1521 108.6 1522 108.7 1536 109.7 1545 110.4 1539 109.9Region HS Totals 4255 4375 4375 4375 4077 95.8 4055 92.7 4108 93.9 4198 96.0 4344 99.3 4468 102.1 4544 103.9 4632 105.9 4660 106.5 4689 107.2 4693 107.3SoutheasternHammond HS 1220 1220 1220 1220 1273 104.3 1217 99.8 1202 98.5 1184 97.0 1205 98.8 1243 101.9 1289 105.7 1324 108.5 1358 111.3 1417 116.1 1444 118.4WesternAtholton HS 1360 1360 1360 1360 1430 105.1 1408 103.5 1403 103.2 1391 102.3 1425 104.8 1443 106.1 1427 104.9 1447 106.4 1414 104.0 1395 102.6 1389 102.1Glenelg HS 1420 1420 1420 1420 1250 88.0 1263 88.9 1246 87.7 1182 83.2 1169 82.3 1193 84.0 1171 82.5 1144 80.6 1109 78.1 1051 74.0 1028 72.4Reservoir HS 1551 1551 1551 1551 1459 94.1 1471 94.8 1560 100.6 1591 102.6 1691 109.0 1811 116.8 1870 120.6 1933 124.6 1992 128.4 2076 133.8 2135 137.7River Hill HS 1488 1488 1488 1488 1363 91.6 1303 87.6 1269 85.3 1230 82.7 1207 81.1 1190 80.0 1145 76.9 1133 76.1 1079 72.5 1014 68.1 978 65.7Region HS Totals 5819 5819 5819 5819 5502 94.6 5445 93.6 5478 94.1 5394 92.7 5492 94.4 5637 96.9 5613 96.5 5657 97.2 5594 96.1 5536 95.1 5530 95.0<strong>County</strong>wide Totals 17026 17146 17146 17146 16353 96.0 16342 95.3 16548 96.5 16758 97.7 17316 101.0 17812 103.9 18157 105.9 18528 108.1 18641 108.7 18825 109.8 18885 110.12012 <strong>Feasibility</strong> <strong>Study</strong>50
Post-MeasuresAggregate PlanELEMENTARY SCHOOLS - Data for Demonstrative Purposes OnlyCapacity Utilization Rates with Proposed FY 2014 Capital Budget Projects - Not Test for APFOChart reflects May 2012 Projections, Board of Education's FY 2014 Requested capacities, and redistricting as listed in June 2012 <strong>Feasibility</strong> <strong>Study</strong>.Capacity 2013-14 2014-15 2015-16 2016-17 2017-18 2018-19 2019-202020-21 2021-22 2022-23 2023-24Columbia - East 2013 2014 2015 2016 Proj % Util. Proj % Util. Proj % Util. Proj % Util. Proj % Util. Proj % Util. Proj % Util. Proj % Util. Proj % Util. Proj % Util. Proj % Util.Cradlerock ES 487 487 487 487 442 90.8 473 97.1 478 98.2 485 99.6 504 103.5 505 103.7 496 101.8 511 104.9 524 107.6 538 110.5 554 113.8Jeffers Hill ES 421 421 421 421 395 93.8 392 93.1 390 92.6 383 91.0 369 87.6 367 87.2 366 86.9 374 88.8 381 90.5 384 91.2 390 92.6Phelps Luck ES A 640 640 640 640 631 98.6 644 100.6 671 104.8 664 103.8 644 100.6 628 98.1 626 97.8 632 98.8 637 99.5 650 101.6 662 103.4Stevens Forest ES A 433 433 433 433 457 105.5 451 104.2 452 104.4 457 105.5 454 104.8 445 102.8 443 102.3 451 104.2 453 104.6 459 106.0 467 107.9Talbott Springs ES 443 443 443 443 485 109.5 493 111.3 509 114.9 505 114.0 496 112.0 482 108.8 482 108.8 487 109.9 491 110.8 496 112.0 501 113.1Thunder Hill ES A 468 468 468 468 462 98.7 474 101.3 482 103.0 482 103.0 473 101.1 462 98.7 460 98.3 465 99.4 472 100.9 483 103.2 492 105.1Region Totals 2892 2892 2892 2892 2872 99.3 2927 101.2 2982 103.1 2976 102.9 2940 101.7 2889 99.9 2873 99.3 2920 101.0 2958 102.3 3010 104.1 3066 106.0Columbia - WestBryant Woods ES 355 355 355 355 361 101.7 372 104.8 376 105.9 391 110.1 391 110.1 402 113.2 407 114.6 410 115.5 C 422 118.9 C 429 120.8 C 435 122.5 CClemens Crossing ES 522 522 522 522 512 98.1 498 95.4 497 95.2 492 94.3 481 92.1 476 91.2 469 89.8 487 93.3 495 94.8 507 97.1 520 99.6Longfellow ES 418 418 418 418 420 100.5 426 101.9 429 102.6 421 100.7 410 98.1 413 98.8 424 101.4 427 102.2 424 101.4 429 102.6 435 104.1Running Brook ES A 405 505 505 505 386 95.3 397 78.6 420 83.2 456 90.3 484 95.8 529 104.8 572 113.3 619 122.6 C 655 129.7 C 689 136.4 C 713 141.2 CSwansfield ES 528 528 528 528 605 114.6 598 113.3 602 114.0 603 114.2 608 115.2 C 613 116.1 C 607 115.0 613 116.1 C 623 118.0 C 631 119.5 C 638 120.8 CRegion Totals 2228 2328 2328 2328 2284 102.5 2291 98.4 2324 99.8 2363 101.5 2374 102.0 2433 104.5 2479 106.5 2556 109.8 2619 112.5 2685 115.3 C 2741 117.7 CNortheasternBellows Spring ES 762 762 762 762 732 96.1 770 101.0 810 106.3 849 111.4 893 117.2 C 941 123.5 C 970 127.3 C 1006 132.0 C 1024 134.4 C 1039 136.4 C 1054 138.3 CDeep Run ES A 601 601 601 701 584 97.2 634 105.5 676 112.5 695 99.1 719 102.6 709 101.1 687 98.0 675 96.3 667 95.1 688 98.1 718 102.4Elkridge ES 779 779 779 779 754 96.8 763 97.9 773 99.2 791 101.5 791 101.5 812 104.2 849 109.0 868 111.4 884 113.5 896 115.0 C 909 116.7 CIlchester ES 617 617 617 617 643 104.2 635 102.9 625 101.3 625 101.3 623 101.0 634 102.8 637 103.2 672 108.9 696 112.8 740 119.9 C 776 125.8 CNew ES #41 NS 600 600 600 600 545 90.8 568 94.7 600 100.0 643 107.2 679 113.2 739 123.2 C 778 129.7 C 800 133.3 C 825 137.5 C 849 141.5 C 859 143.2 CRockburn ES 667 667 667 667 724 108.5 714 107.0 706 105.8 705 105.7 704 105.5 719 107.8 735 110.2 753 112.9 775 116.2 C 793 118.9 C 807 121.0 CVeterans ES 788 788 788 788 711 90.2 755 95.8 793 100.6 808 102.5 819 103.9 822 104.3 815 103.4 801 101.6 776 98.5 766 97.2 764 97.0Waterloo ES 594 594 594 594 542 91.2 569 95.8 583 98.1 604 101.7 626 105.4 641 107.9 642 108.1 644 108.4 643 108.2 645 108.6 650 109.4Worthington ES 516 516 516 516 514 99.6 538 104.3 534 103.5 529 102.5 518 100.4 510 98.8 503 97.5 496 96.1 496 96.1 502 97.3 522 101.2Region Totals 5924 5924 5924 6024 5749 97.0 5946 100.4 6100 103.0 6249 103.7 6372 105.8 6527 108.3 6616 99.9 6715 101.4 6786 102.4 6918 104.4 7059 106.6NorthernCentennial Lane ES 628 628 628 628 695 110.7 690 109.9 697 111.0 704 112.1 699 111.3 686 109.2 699 111.3 704 112.1 693 110.4 707 112.6 720 114.6Hollifield Station ES 688 688 688 688 753 109.4 759 110.3 762 110.8 773 112.4 785 114.1 805 117.0 C 828 120.3 C 845 122.8 C 856 124.4 C 871 126.6 C 878 127.6 CManor Woods ES 647 647 647 647 679 104.9 690 106.6 731 113.0 474 73.3 505 78.1 532 82.2 559 86.4 604 93.4 647 100.0 669 103.4 682 105.4Northfield ES 672 672 672 672 742 110.4 721 107.3 704 104.8 698 103.9 687 102.2 696 103.6 681 101.3 698 103.9 708 105.4 726 108.0 756 112.5St Johns Lane ES 597 597 597 597 549 92.0 552 92.5 566 94.8 571 95.6 570 95.5 572 95.8 563 94.3 567 95.0 562 94.1 565 94.6 575 96.3Waverly ES A 675 675 675 775 705 104.4 684 101.3 674 99.9 798 103.0 779 100.5 769 99.2 761 98.2 784 101.2 805 103.9 840 108.4 864 111.5Region Totals 3907 3907 3907 4007 4123 105.5 4096 104.8 4134 105.8 4018 100.3 4025 100.4 4060 101.3 4091 102.1 4202 104.9 4271 106.6 4378 109.3 4475 111.7SoutheasternAtholton ES 387 387 387 387 346 89.4 341 88.1 343 88.6 344 88.9 353 91.2 351 90.7 362 93.5 358 92.5 357 92.2 363 93.8 368 95.1Bollman Bridge ES A 663 663 663 663 732 110.4 770 116.1 C 814 122.8 C 849 128.1 C 885 133.5 C 923 139.2 C 941 141.9 C 961 144.9 C 951 143.4 C 940 141.8 C 930 140.3 CForest Ridge ES 626 626 626 626 665 106.2 670 107.0 706 112.8 714 114.1 739 118.1 C 768 122.7 C 792 126.5 C 804 128.4 C 804 128.4 C 799 127.6 C 798 127.5 CGorman Crossing ES A 713 713 713 713 646 90.6 697 97.8 721 101.1 765 107.3 776 108.8 783 109.8 786 110.2 782 109.7 789 110.7 793 111.2 813 114.0Guilford ES 462 462 462 462 439 95.0 441 95.5 439 95.0 445 96.3 435 94.2 438 94.8 420 90.9 415 89.8 411 89.0 410 88.7 420 90.9Hammond ES 597 597 597 597 610 102.2 619 103.7 611 102.3 617 103.4 631 105.7 659 110.4 688 115.2 C 733 122.8 C 787 131.8 C 837 140.2 C 889 148.9 CLaurel Woods ES A 540 540 640 640 556 103.0 582 107.8 581 90.8 570 89.1 601 93.9 601 93.9 599 93.6 602 94.1 635 99.2 650 101.6 670 104.7New ES #42 NS 0 0 0 0Region Totals 3988 3988 4088 4088 3994 100.2 4120 103.3 4215 103.1 4304 105.3 4420 108.1 4523 110.6 4588 112.2 4655 113.9 4734 115.8 C 4792 117.2 C 4888 119.6 CWesternBushy Park ES 788 788 788 788 538 68.3 497 63.1 476 60.4 535 67.9 519 65.9 533 67.6 529 67.1 553 70.2 559 70.9 574 72.8 587 74.5Clarksville ES 634 634 634 634 468 73.8 406 64.0 368 58.0 344 54.3 295 46.5 270 42.6 274 43.2 282 44.5 277 43.7 279 44.0 282 44.5Dayton Oaks ES 788 788 788 788 530 67.3 540 68.5 479 60.8 455 57.7 447 56.7 434 55.1 424 53.8 436 55.3 448 56.9 452 57.4 465 59.0Fulton ES 772 772 772 772 648 83.9 673 87.2 712 92.2 747 96.8 767 99.4 798 103.4 798 103.4 784 101.6 777 100.6 769 99.6 750 97.2Lisbon ES 553 553 553 553 411 74.3 404 73.1 384 69.4 393 71.1 416 75.2 424 76.7 442 79.9 457 82.6 473 85.5 487 88.1 504 91.1Pointers Run ES 776 776 776 776 678 87.4 616 79.4 542 69.8 516 66.5 485 62.5 470 60.6 464 59.8 470 60.6 491 63.3 501 64.6 511 65.9Triadelphia Ridge ES 544 544 544 544 394 72.4 409 75.2 409 75.2 495 91.0 489 89.9 494 90.8 494 90.8 487 89.5 485 89.2 478 87.9 466 85.7West Friendship ES 396 396 396 396 359 90.7 347 87.6 326 82.3 361 91.2 390 98.5 417 105.3 466 117.7 C 502 126.8 C 546 137.9 C 574 144.9 C 604 152.5 CRegion Totals 5251 5251 5251 5251 4026 76.7 3892 74.1 3696 70.4 3846 73.2 3808 72.5 3840 73.1 3891 74.1 3971 75.6 4056 77.2 4114 78.3 4169 79.4<strong>County</strong>wide Totals 24190 24290 24390 24590 23048 95.3 23272 95.8 23451 96.2 23756 96.6 23939 97.4 24272 98.7 24538 97.4 25019 99.3 25424 100.9 25897 102.8 26398 104.8'A' includes additions as reflected in FY 2014 CIP for grades K-5'NS' New School proposed in FY 2014 Capital Budget2012 <strong>Feasibility</strong> <strong>Study</strong>51
Post-MeasuresAggregate PlanMIDDLE SCHOOLS - Data for Demonstrative Purposes OnlyCapacity Utilization Rates with Proposed FY 2014 Capital Budget Projects - Not Test for APFOChart reflects May 2012 Projections, Board of Education's FY 2014 Requested capacities, and redistricting as listed in June 2012 <strong>Feasibility</strong> <strong>Study</strong>.Capacity 2013-14 2014-15 2015-16 2016-17 2017-18 2018-19 2019-20 2020-21 2021-22 2022-23 2023-24Columbia - East 2013 2014 2015 2016 Proj % Util. Proj % Util. Proj % Util. Proj % Util. Proj % Util. Proj % Util. Proj % Util. Proj % Util. Proj % Util. Proj % Util. Proj % Util.Lake Elkhorn MS 526 526 526 526 544 103.4 477 90.7 500 95.1 519 98.7 543 103.2 550 104.6 562 106.8 563 107.0 583 110.8 579 110.1 582 110.6Oakland Mills MS 506 506 506 506 440 87.0 453 89.5 469 92.7 488 96.4 508 100.4 539 106.5 550 108.7 531 104.9 516 102.0 510 100.8 516 102.0Region MS Totals 1032 1032 1032 1032 984 95.3 930 90.1 969 93.9 1007 97.6 1051 101.8 1089 105.5 1112 107.8 1094 106.0 1099 106.5 1089 105.5 1098 106.4Columbia - WestLake Elkhorn MS 584 584 584 584 459 78.6 534 91.4 545 93.3 558 95.5 579 99.1 611 104.6 631 108.0 628 107.5 620 106.2 607 103.9 612 104.8Wilde Lake MS A 506 506 506 662 559 110.5 545 107.7 539 106.5 522 78.9 548 82.8 550 83.1 568 85.8 550 83.1 569 86.0 584 88.2 616 93.1Region MS Totals 1090 1090 1090 1246 1018 93.4 1079 99.0 1084 99.4 1080 86.7 1127 90.4 1161 93.2 1199 96.2 1178 94.5 1189 95.4 1191 95.6 1228 98.6NortheasternBonnie Branch MS 662 662 662 662 783 118.3 C 686 103.6 708 106.9 726 109.7 762 115.1 C 763 115.3 C 779 117.7 C 750 113.3 763 115.3 C 759 114.7 788 119.0 CEllicott Mills MS 662 662 662 662 807 121.9 C 629 95.0 644 97.3 665 100.5 702 106.0 715 108.0 726 109.7 732 110.6 739 111.6 735 111.0 724 109.4Folly Quarter MS 662 662 662 662 522 78.9 659 99.5 689 104.1 679 102.6 690 104.2 650 98.2 645 97.4 612 92.4 611 92.3 606 91.5 610 92.1Mayfield Woods MS 682 682 682 682 796 116.7 C 610 89.4 665 97.5 694 101.8 736 107.9 774 113.5 816 119.6 C 841 123.3 C 867 127.1 C 858 125.8 C 856 125.5 CNew MS #20 NS 0 662 662 662 565 85.3 595 89.9 617 93.2 651 98.3 666 100.6 702 106.0 720 108.8 759 114.7 777 117.4 C 793 119.8 CRegion MS Totals 2668 2668 3330 3330 2908 109.0 2584 96.9 3301 99.1 3381 101.5 3541 106.3 3568 107.1 3668 110.2 3655 109.8 3739 112.3 3735 112.2 3771 113.2NorthernBurleigh Manor MS 662 662 662 662 675 102.0 725 109.5 725 109.5 739 111.6 728 110.0 735 111.0 747 112.8 750 113.3 770 116.3 C 786 118.7 C 803 121.3 CElkridge Landing MS 662 662 662 662 229 34.6 155 23.4 177 26.7 174 26.3 175 26.4 173 26.1 191 28.9 154 23.3 155 23.4 172 26.0 178 26.9Patapsco MS 662 662 662 662 609 92.0 655 98.9 702 106.0 692 104.5 702 106.0 691 104.4 700 105.7 687 103.8 706 106.6 714 107.9 740 111.8Region MS Totals 1986 1986 1986 1986 1513 76.2 1535 77.3 1604 80.8 1605 80.8 1605 80.8 1599 80.5 1638 82.5 1591 80.1 1631 82.1 1672 84.2 1721 86.7SoutheasternHarpers Choice MS 506 506 506 506 539 106.5 577 114.0 617 121.9 C 655 129.4 C 663 131.0 C 659 130.2 C 650 128.5 C 639 126.3 C 649 128.3 C 649 128.3 C 653 129.1 CMurray Hill MS 662 662 662 662 822 124.2 C 668 100.9 689 104.1 750 113.3 776 117.2 C 813 122.8 C 850 128.4 C 902 136.3 C 899 135.8 C 895 135.2 C 896 135.3 CPatuxent Valley MS 662 662 662 662 660 99.7 643 97.1 652 98.5 692 104.5 714 107.9 740 111.8 767 115.9 C 803 121.3 C 836 126.3 C 844 127.5 C 861 130.1 CRegion MS Totals 1830 1830 1830 1830 2021 110.4 1888 103.2 1958 107.0 2097 114.6 2153 117.7 C 2212 120.9 C 2267 123.9 C 2344 128.1 C 2384 130.3 C 2388 130.5 C 2410 131.7 CWesternClarksville MS 662 662 662 662 605 91.4 632 95.5 614 92.7 571 86.3 545 82.3 504 76.1 470 71.0 395 59.7 360 54.4 360 54.4 373 56.3Glenwood MS 584 584 584 584 554 94.9 577 98.8 582 99.7 567 97.1 535 91.6 502 86.0 493 84.4 484 82.9 484 82.9 494 84.6 523 89.6Hammond MS 584 584 584 584 521 89.2 593 101.5 617 105.7 647 110.8 642 109.9 652 111.6 668 114.4 692 118.5 C 713 122.1 C 725 124.1 C 731 125.2 CLime Kiln MS 701 701 701 701 581 82.9 686 97.9 686 97.9 678 96.7 660 94.2 638 91.0 644 91.9 636 90.7 625 89.2 620 88.4 623 88.9Mount View MS 662 662 662 662 706 106.6 709 107.1 712 107.6 733 110.7 736 111.2 738 111.5 731 110.4 711 107.4 704 106.3 708 106.9 725 109.5Region MS Totals 3193 3193 3193 3193 2967 92.9 3197 100.1 3211 100.6 3196 100.1 3118 97.7 3034 95.0 3006 94.1 2918 91.4 2886 90.4 2907 91.0 2975 93.2<strong>County</strong>wide Totals 11799 11799 12461 12617 11411 96.7 11213 95.0 12127 97.3 12366 98.0 12595 99.8 12663 100.4 12890 102.2 12780 101.3 12928 102.5 12982 102.9 13203 104.6'A' includes additions as reflected in FY 2014 CIP for grades 6-8'NS' New School proposed in FY 2014 Capital Budget2012 <strong>Feasibility</strong> <strong>Study</strong>52
Post-MeasuresAggregate PlanHIGH SCHOOLS - Data for Demonstrative Purposes OnlyCapacity Utilization Rates with Proposed FY 2014 Capital Budget Projects - Not Test for APFOChart reflects May 2012 Projections, Board of Education's FY 2014 Requested capacities, and redistricting as listed in June 2012 <strong>Feasibility</strong> <strong>Study</strong>.Capacity 2013-14 2014-15 2015-16 2016-17 2017-18 2018-192019-20 2020-21 2021-22 2022-23Columbia - East 2013 2014 2015 2016 Proj % Util. Proj % Util. Proj % Util. Proj % Util. Proj % Util. Proj % Util. Proj % Util. Proj % Util. Proj % Util. Proj % Util. Proj % Util.Oakland Mills HS 1400 1400 1400 1400 1099 78.5 1094 78.1 1100 78.6 1307 93.4 1379 98.5 1392 99.4 1455 103.9 1515 108.2 1576 112.6 1638 117.0 1636 116.92023-24Columbia - WestWilde Lake HS 1424 1424 1424 1424 1322 92.8 1354 95.1 1394 97.9 1445 101.5 1517 106.5 1566 110.0 1631 114.5 1686 118.4 1677 117.8 1702 119.5 1695 119.0Northeastern<strong>Howard</strong> HS 1420 1420 1420 1420 1692 119.2 1742 122.7 1801 126.8 1574 110.8 1641 115.6 1687 118.8 1728 121.7 1776 125.1 1794 126.3 1813 127.7 1823 128.4Long Reach HS 1488 1488 1488 1488 1388 93.3 1435 96.4 1465 98.5 1656 111.3 1738 116.8 1819 122.2 1897 127.5 1938 130.2 1982 133.2 2030 136.4 2064 138.7Region HS Totals 2908 2908 2908 2908 3080 105.9 3177 109.3 3266 112.3 3230 111.1 3379 116.2 3506 120.6 3625 124.7 3714 127.7 3776 129.8 3843 132.2 3887 133.7NorthernCentennial HS 1360 1360 1360 1360 1413 103.9 1430 105.1 1499 110.2 1538 113.1 1597 117.4 1651 121.4 1672 122.9 1723 126.7 1750 128.7 1778 130.7 1807 132.9Marriotts Ridge HS 1615 1615 1615 1615 1225 75.9 1194 73.9 1231 76.2 1260 78.0 1317 81.5 1349 83.5 1351 83.7 1387 85.9 1374 85.1 1366 84.6 1347 83.4Mt Hebron HS 1280 1280 1400 1400 1439 112.4 1431 111.8 1378 98.4 1400 100.0 1430 102.1 1468 104.9 1521 108.6 1522 108.7 1536 109.7 1545 110.4 1539 109.9Region HS Totals 4255 4255 4375 4375 4077 95.8 4055 95.3 4108 93.9 4198 96.0 4344 99.3 4468 102.1 4544 103.9 4632 105.9 4660 106.5 4689 107.2 4693 107.3SoutheasternHammond HS 1220 1220 1220 1220 1273 104.3 1217 99.8 1202 98.5 1183 97.0 1203 98.6 1241 101.7 1286 105.4 1319 108.1 1352 110.8 1410 115.6 1435 117.6WesternAtholton HS 1360 1360 1360 1360 1430 105.1 1408 103.5 1403 103.2 1392 102.4 1427 104.9 1445 106.3 1430 105.1 1452 106.8 1420 104.4 1402 103.1 1398 102.8Glenelg HS 1420 1420 1420 1420 1250 88.0 1263 88.9 1246 87.7 1182 83.2 1169 82.3 1193 84.0 1171 82.5 1144 80.6 1109 78.1 1051 74.0 1028 72.4Reservoir HS 1551 1551 1551 1551 1459 94.1 1471 94.8 1560 100.6 1591 102.6 1691 109.0 1811 116.8 1870 120.6 1933 124.6 1992 128.4 2076 133.8 2135 137.7River Hill HS 1488 1488 1488 1488 1363 91.6 1303 87.6 1269 85.3 1230 82.7 1207 81.1 1190 80.0 1145 76.9 1133 76.1 1079 72.5 1014 68.1 978 65.7Region HS Totals 5819 5819 5819 5819 5502 94.6 5445 93.6 5478 94.1 5395 92.7 5494 94.4 5639 96.9 5616 96.5 5662 97.3 5600 96.2 5543 95.3 5539 95.2<strong>County</strong>wide Totals 17026 17026 17146 17146 16353 96.0 16342 96.0 16548 96.5 16758 97.7 17316 101.0 17812 103.9 18157 105.9 18528 108.1 18641 108.7 18825 109.8 18885 110.12012 <strong>Feasibility</strong> <strong>Study</strong>53