CAMEROON COFFEE SUPPLY CHAIN RISK ... - aaacp
CAMEROON COFFEE SUPPLY CHAIN RISK ... - aaacp
CAMEROON COFFEE SUPPLY CHAIN RISK ... - aaacp

You also want an ePaper? Increase the reach of your titles
YUMPU automatically turns print PDFs into web optimized ePapers that Google loves.
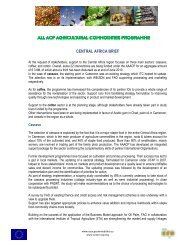
<strong>CAMEROON</strong> <strong>COFFEE</strong> <strong>SUPPLY</strong> <strong>CHAIN</strong> <strong>RISK</strong> ASSESSMENTDRAFT REPORTSeptember, 2010ALL ACP AGRICULTURAL COMMODITIES PROGRAMMEEUROPEAN COMMISSIONACP GROUP OF STATES
Table of Contents: Cameroon Coffee Supply Chain Risk AssessmentExecutive Summary ……………………………………………………………………… 31. Background ……………………………………………………………………….. 52. An overview of the Cameroon coffee industry …………………………………… 63. Supply Chain Structure ………………………………………………………….. 104. Supply Chain Constraints……………………………………… ………………. 145. Major risks and capacity to manage ………………………………. ……. …….. 165.1 Production Risks ………………………………………………………………… 17Pest and disease ………………………………………………………………… 17Delayed flowering ……………………………………………….. …………… 185.2 Market Risks ……………………………………………………………………… 19Coffee price risk ………………………………………………………………… 19Volatility of fertilizer prices …………………………………………………….. 21Default risk …………………………………………………………………… 22Crop substitution …………………………………………………………….. 235.3 Other Risks ……………………………………………………………………. 23Policy/regulation risk …………………………………………………………. 23Security of cash in transit..……………………………………………………… 246. Vulnerability to Risk ……………………………………………………………….. 257. Priority Measures for Risk Management ……………………………………………. 268. Final Remarks ……………………………………………………………………… 27Reference ……………………………………………………………………………. 28Annex 1. Coffee Supply Chain Risk Assessment Agenda ……………………………. 29Annex 2. List of Participants at the stakeholders‟ meeting (6 th May,2010)……………. 31Annex 3. Farmer‟s Risk Perception and Prioritization…………………………. …. 32Disclaimer:This volume is a product of the staff of the International Bank for Reconstruction and Development / TheWorld Bank. The findings, interpretations, and conclusions expressed in this paper do not necessarily reflectthe views of the Executive Directors of The World Bank or the governments they represent.The World Bank does not guarantee the accuracy of the data included in this work. The boundaries, colors,denominations, and other information shown on any map in this work do not imply any judgement on thepart of The World Bank concerning the legal status of any territory or the endorsement or acceptance of suchboundaries.1
GlossaryEnglishForwarding AgentsExport MarketsRoastersHullers or MillersBuyersSupplierCoffee cherryParchment coffeeDe-pulpingFermentationDe-mucilagingHullingDryingBeanGreen coffeeGradingSorting/cleaning (after grading)FrenchTransitairesMarchés d‟exportation /DestinationsTorréfacteursUsiniersAcheteursFournisseurCeriseCafé parche (process : déparcharge)DépulpageFermentationDémuculagination (Arabica only)DecorticageSéchageFèveCafé vert/Café marchandCalibrageTriage2
Executive SummaryCoffee is currently the fourth largest agricultural export commodity (by volume) for Cameroon. Nearly allcoffee (more than 98%) is exported and less than 2% is consumed domestically. In 2008-09, Cameroonexported 34,166 tons of coffee (3,611 tons of Arabica and 30,555 tons of Robusta) and earned foreignexchange worth CFAF23,147 million (approximately US$ 46.75 million). Coffee is the primary source of cashincome for thousands of households in the rural areas and provides livelihoods to many others across thesupply chain.The coffee sector‟s significance and importance has declined drastically from its 1980s heyday when it was thelargest agricultural export commodity (by volume); main source of cash income for 400,000 rural households;exported 110,000 tons of coffee annually; and was the world‟s twelfth largest coffee exporter. Currently, it isthe nineteenth largest exporter.The liberalization of the coffee sector, the steep and prolonged decline in international coffee prices, thecollapse of Cameroon‟s coffee cooperative system, and the rapid entry and exodus of private operators weresome of the major shocks experienced by the Cameroon coffee industry over the past 20 years. As a result,coffee production declined from a peak of 146,848 tons in 1987/88 to 31,524 tons in 2007/08.Currently average coffee yields are quite low (300-350 kg/ha of coffee cherries) due to ageing plantations,high cost of inputs (fertilizers), limited access to on-farm extension services, and limited management andinvestment in the coffee plantations. In addition, limited access to finance, ageing farmers and limitedengagement of young farmers, fragmented supply chain, poor road infrastructure, and poor buyers‟perception of Cameroonian coffee are some of the constraints that hamper the performance of the industry.Coffee production in Cameroon has limited exposure to weather/climatic risks. Most of the shocks that thesector has experienced have been man-made. The following major risks account for the decline in coffeeproduction and exports:· Coffee price risk: Approximately 98 % of Cameroonian coffee production is exported, exposing thesector to international coffee price volatility. The majority of exporters, being a part of internationaltrading enterprises, are hedging against price risk in commodity exchanges and are secured, to someextent, against seasonal price volatility. Most traders mitigate price risk by undertaking back to backtrading. Farmers, on the other hand, have no protection against seasonal or long term decline in theprices.· Volatility of fertilizer prices: Fertilizer application in coffee plantations is very limited, largely dueto the high cost of fertilizers, and farmers cite this as a main cause for low coffee yields. Further risesin fertilizer prices might have a negative impact on coffee production.· Crop substitution: In the past, crop substitution resulted in significant loss of coffee acreage.Improvements in communication, infrastructure, and access to markets are providing more lucrativeoptions to farmers. These, coupled with increased pressure on land, increase the risk of continuedlarge scale replacement of coffee plantations with other crops.· Policy/ Regulation: Despite liberalization, the coffee sector is still heavily regulated and politicized.Drastic changes in the policy regime and regulation are serious threats that could potentially have farreaching implications for the industry.3
· Default risk: The entire supply chain is exposed to this risk and different stakeholders haveexperienced financial losses due to counterparty (eg.farmer, agent, huller, or exporter) defaulting onthe money advanced as well as on the quantity and quality supplied.· Pest and disease: Coffee berry disease (CBD), coffee rust, and coffee borer are three significantpests and diseases which are causing significant quantity and quality losses. CBD is a major risk forArabica coffee plantations, with infestation rates between 40-60 % and resultant production lossesranging from 30 to 50 %.Revival of the coffee sector will require a large scale coordinated effort to boost coffee production through: improved access and affordability of farm inputs (planting material, fertilizers, chemicals, etc); training farmers, especially young farmers, in good coffee cultivation practices and pest and diseasemanagement; developing a system of on-farm extension services/advice; greater coordination between exporters and farmers and investment in improving trust andtransparency; v) building a conducive regulatory environment.Besides boosting coffee production, the industry needs to undertake proactive measures to manage the risksof long term decline in international coffee prices, steep rises in fertilizer/input prices, crop substitution, andchanges in regulation. To manage these risks, a Cameroon coffee revival strategy needs to be implemented toaddress the structural impediments in the supply chain, focus on developing win-win relationships among thevarious stakeholders, and develop mechanisms to improve the resilience of the supply chain to manage futureshocks.4
1. BackgroundThe World Bank, in collaboration with the National Coffee and Cocoa Board (ONCC) and the Cocoa andCoffee Inter-Professional Board (CICC), conducted a coffee supply chain risk assessment in Cameroon inMay, 2010. This report is the outcome of that assessment and is intended as an advisory note to the Ministryof Commerce, Ministry of Agriculture and Rural Development, ONCC and CICC to enable them to identifystrategies and potential public investments to improve current risk management practices in the coffee supplychain.This report identifies the major risks facing the coffee supply chain, ranks them in terms of their potentialimpact and frequency, and offers a framework for improving current risk management practices. Therecommendations and findings will provide a basis for follow-up planning work by the Government ofCameroon (GoC), the World Bank and other development partners.The findings and analysis of this initial assessment are based on a methodology designed by the AgriculturalRisk Management Team (ARMT) of the World Bank for assessing risks in agricultural supply chains. Theassessment team followed the following sequences of activities (Figure 1) while conducting the assessment.Figure 1: Overall Sequence of Analysis and Consultative StepsPre Field AssessmentPreparation- Baseline data preparation- Supply chain & spatialmapping- Consultation scheduling- Initial meetingsPreliminary FieldExercises &Consultations- Arrival of team / team planning- Completion of baseline datagaps- Identification of tentative risks- Initial stakeholder plenarymeeting-Field Visits &Stakeholder Interviews- Field trips, governmentconsultations- Stakeholder interviews- Risk identification,characterization(Interviews also cover riskmanagement and vulnerability)Communication ofResults- Completion of reportsDissemination of results- Operational follow upsAssessment Wrap Up &Recommendations- Diagnostics follow uprecommendations- Identification of gapsFinal StakeholderMeetings & Wrap Ups- Identification of capacities, gaps.- Prioritization of risks,vulnerabilities- Risk recommendations, follow upsIn-depth interviews were conducted with key coffee supply chain stakeholders in Douala, Bafoussam,Mbouda, Kekem, Melong, Nkongsamba, Yaoundé & Abong-Mbang districts (i.e. farmers, input suppliers,traders, banks and microfinance institutions, hullers, cooperatives, federations, exporters, research institutes,government departments, etc.). A full list of all the stakeholders interviewed is provided in Annex 1.This activity was financed by the European Union All ACP Agricultural Commodities Programme (AAACP)for the Central Africa region. AAACP has been financing interventions in the coffee sector throughinternational organizations (World Bank, ITC, UNCTAD & FAO) and this assessment will feed into theexisting and planned activities of these international organizations in the coffee sector. AAACP has financedthe development of a coffee strategy (led by ITC) and this assessment will complement that work and add therisk dimension to the Cameroon Coffee Sector Development Strategy. The World Bank team wishes toacknowledge the invaluable support provided by the Ministry of Agriculture and Rural Development, theMinistry of Commerce, ONCC, and CICC as a partner in this activity.5
2. An overview of the Cameroon coffee industryCameroon is primarily a Robusta producer (more than 90 % by volume). There are five main regions wherecoffee is grown, namely: 1) The Littoral region (Robusta); 2) The West (mainly Arabica, but some Robustaalso); 3) The North West (mainly Arabica); 4) The South West (Robusta); and 5) The East (Robusta) (see map1). In addition, some coffee is grown in the Central and Southern regions but at present cocoa is thepredominant crop in those areas.Map 1. Coffee Production Regions of CameroonCoffee is currently the fourth largest agricultural export commodity (by volume) for Cameroon 1 and thecountry is the world‟s nineteenth largest exporter. Nearly all coffee (more than 98%) is exported and less than2% is consumed domestically. In 2008-09, Cameroon exported 34,166 tons of coffee (3,611 tons of Arabicaand 30,555 tons of Robusta) and earned foreign exchange worth CFAF23,147 million ( approximately US$46.75 million 2 ). Coffee is the primary source of cash income for thousands of households in the rural areasand provides livelihoods to many others across the supply chain.Italy is the biggest market for Cameroonian coffee accounting for almost half of its Robusta coffee exports,followed by Belgium, Algeria, and Portugal. Germany is the largest buyer of Arabica purchasing more than56% of Cameroon‟s Arabica production, followed by France, Russia, and the USA. Figure 2 details theexport market shares of Arabica and Robusta coffee.1 ONCC-CICC Annual Report 2008-09. Coffee is the fifth largest (by value) and fourth largest (by volume) agricultural exportcommodity for Cameroon.2 ONCC-CICC Annual Report 2008-09. Calculated using CFAF 10,000 = $US 20.2 on 31/3/2009 from the following websitehttp://xaf.exchangerates24.com/usd/history/?q=365.6
1980/811981/821982/831983/841984/851985/861986/871987/881988/891989/901990/911991/921992/931993/941994/951995/961996/971997/981998/991999/002000/012001/022002/032003/042004/052005/062006/072007/082008/09Figure 2: Robusta Export (Market Share: Volume %) Arabica Exports (Market Share: Volume %)(Source: ONCC Annual report 2008/09)Although coffee is an important crop for the country, its significance and importance has declined drasticallyfrom its 1980s heyday when it was the main source of cash income for 400,000 rural households (184,402(Arabica) and 215,164 (Robusta) 3 ; exported 110,000 tons of coffee annually; and was the world‟s twelfthlargest coffee exporter. Over the past thirty years Cameroon has seen a rapid decline in coffee production.Cameroon exported around 1,500,000 bags (60 kg each) during the 1980s, around 1,000,000 bags during thelatter half of 1990s and around 700,000 bags for the past 5-6 years (figure 3). Arabica production inCameroon has declined from a peak of 31,663 tons (1973-74) to 3,474 tons (2007-08), while Robustaproduction has declined from a peak of 123,988 tons (1986-87) to 28,050 tons (2007-08) (figure 4).Figure 3. Coffee production and exports (000 Bags)25002000150010005000Production (000 Bags)Exports (000 Bags)(Source: ICO)3 This survey was done between 1985-1990. There has been no agricultural census since then. Coffee acreage has drastically reduced inthe past twenty years and number of household currently engaged in coffee cultivation is much smaller.7
Figure 4. Coffee production* (Tons)160,000140,000120,000100,00080,00060,00040,00020,0000Robusta Arabica Total(Source: ONCC)*These figures represent the amount of coffee exported and roasted locally and not the actual coffee production.During the 1980s, due to price stabilization policies and the support provided by the Government, coffeeproduction reached its all time high. The coffee sector was under the state control up to 1991 and theNational Board for marketing of Basic Commodities (ONCPB) was responsible for the commercialization ofcoffee. ONCPB played the role of stabilization fund, determined coffee prices, acted as the sole buyer andseller of coffee and provided directives and investments for the commercialization of coffee. A tripartitecooperative structure, consisting of primary cooperatives, secondary cooperatives, and seven big „parastatal‟Unions of Agricultural Cooperatives (UCO), was responsible for providing inputs (fertilizers and plantingmaterial), credit, and extension services to the farmers. The cooperative system was responsible for theprocurement of coffee, quality control, delivery of coffee to ONCPB, and disbursement of payments to thefarmers. While cooperatives were the main structure in Anglophone coffee growing areas, a mixed structureconsisting of private licensed buying agents (LBA) and cooperatives were prevalent in the Francophoneregion. This structure was dismantled by the Government between 1990-1994 and since then, the coffeesector has gone through three distinct phases:1) Liberalization (1990-1994): Development agencies, including the World Bank, USAID and other donors,supported the Government of Cameroon to liberalize the coffee sector. The Government withdrew from itsdirect roles within the coffee sector including price support, buying and selling of coffee, supply of inputs(including fertilizers etc), and providing subsidies to the coffee cooperatives. Lack of government support,coupled with direct exposure to international price volatility and the collapse of the national cooperativestructure resulted in a substantial drop in the volume of coffee produced.2) Proliferation of the private sector (1994-2003): Liberalization of the coffee sector led to the rapidproliferation of private sector actors at all stages of the coffee supply chain (exporters, hullers, agents etc.)between 1993 and 2003. The absence of entry barriers led to a surge of new, mostly inexperienced, operatorsand the majority of them lost money and subsequently went bankrupt. Commercial banks, which extendedfinance to private sector coffee enterprises following liberalization, experienced significant defaults on coffeesector lending and suffered substantial losses during this period. One exporter indicated that more than 1008
exporters entered and exited the sector during this period. The international coffee crisis (2000-2003)prompted a large number of farmers to exit from coffee production or abandon their coffee plantation.3) Consolidation (2003- present): The period from 2003 to present is marked by market consolidation by afew operators and a slight recovery from the lowest production levels of 2003. Currently, five exportersaccount for more than 84% of the Robusta coffee exported while two federations (UCCAO and NWCA)account for 60% of the Arabica exports. GoC has started many new initiatives to revive coffee production,and production, although still volatile, has attained a level of 40,000 tons.Table 1 illustrates the decline of coffee production for some regions, notably West and South West. While theWest region contributed 33 % of national Robusta production in 1985, coffee production declined severelyand the region today producers almost no Robusta. Corresponding figures for the Arabica production are notavailable.Table 1. Regional contribution (in %) of Robusta Coffee ProductionRegion 1985/86 2008/09(West) 33.73 0(South West) 11.31 5(Littoral) 50.85 70(North West) 0.28 0(East) 2.18 15(Centre) 1.44 10(South) 0.21 0(Source: ONCC).Information collected from key respondents indicates the Robusta production in a few collection centersnamelyManjo, Loum, Mbanga, Batouri, Ebolowa, lolodorf, Bafia , and Angosas- has almost disappeared.While they were big collection centers during mid-80s, these centers hardly supply any coffee today. Despitethe decline, coffee is still important for Cameroon and a large number of households, albeit a much smallernumber than in the 1980s, are still dependent on coffee as the main source of cash income for theirhouseholds. The next section describes the current structure of the coffee supply chain in Cameroon.9
3. Supply chain structureThe coffee supply chain (figure 5) constitutes of farmers, agents, cooperatives and farmers‟ union, hullers andgraders, exporters, forwarding agents, and roasters. The following section provides a brief description of itsmajor stakeholders:Figure 5: Cameroon Coffee Supply Chain Map(Source: Authors)Industry Apex Organizations: After the liberalization, ONCPB was dismantled and two new apexorganizations were created to support the coffee and cocoa sectors. The National Cocoa and Coffee Board(ONCC) is a public sector organization, under the Ministry of Commerce, responsible for supervising thecoffee and cocoa supply chain in Cameroon. The role of ONCC is to assist in coffee marketing, collatestatistics, ensure regulatory compliance, supervise exports‟ quality control, represent the interprofessionalgroups, and provide information and advice on international coffee prices to the domestic stakeholders.The other apex organization is the Interprofessional Council for Cocoa and Coffee (CICC) represents theprivate sector and it is organized through four groupings: producers, processors organizations, conditioningfactories, and exporters and agents. 4 It provides a range of services including studies, quality and originpromotion, information collection and dissemination, and representation of private sector interests, amongstothers.4 Inter-reseaux developpement rural (2008): An interprofessional Organisation for Coffee and Cocoa in Cameroon: for which services and for whom?10
Besides these two organizations, the Government has recently created a separate Cocoa and Coffee subsectorDevelopment Fund (FODECC) that supports projects for the development of coffee and cocoasectors. All three organizations are financed from an industry wide export levy of CFAF 29,000/ton (table 2)on coffee and cocoa exports.Table 2: Share of different organizations in export levyOrganizationONCC 8500CICC 4000FODECC 15000International coffee/cocoa organisations 1500Total 29,000(Source: ONCC)Share of export levy (in CFAF / MT)Farmers: According to the last census conducted by the Ministry of Agriculture in 1984, coffee was the mainsource of income for some 400,000 households. Currently, the number of households engaged in coffeeproduction is much smaller, as indicated by the significant decline in production and coffee acreage, althoughthere is no data/statistics to validate this 5 . There were a few large commercial estates prior to liberalization,however, nearly all the coffee production is currently being done by smallholder farmers.Farmers generally grow a diversified portfolio of crops, notably food crops (maize, plantains) for householdconsumption and sale, and cash crops including cocoa, coffee, fruits and vegetables, and palm oil forcommercial sale. The food crops are generally grown and marketed by women and cash crops by men. Whilecoffee was the most profitable cash crop during the 80s, its significance to the farm economy has declineddrastically. In areas where farmers can grow cocoa and palm oil, coffee production is now a less importantsource of cash. Coffee remains the primary cash crop in regions where production of alternative cash cropssuch as cocoa, fruits and vegetables, and palm oil is not talking place.Coffee Cooperatives and Unions: The cooperative structure for coffee and cocoa was formed during thecolonial times. After independence, cooperatives became the primary organizational structures for coffee andcocoa farmers and invested in all aspects of the industry (delivery, storage, hulling, grading, extension services,and financing). Cooperatives were grouped into Unions and they were responsible for liaison with the formernational marketing board. After the liberalization, many cooperatives collapsed because of withdrawal of thegovernment support, falling turnover, mismanagement, and increased competition from the private sector.There is still a large residual infrastructure, a high level of debt, and a lack of trust between farmers andcooperatives.Currently, the cooperatives‟ role in Robusta marketing is marginal, however they remain the main players(UCCAO and NWCA) in the Arabica market. During the 2008-09 season UCCAO (operating with aninternational partner) exported 41% of Cameroon‟s Arabica production while NWCA exported 22% .Currently, the functional cooperatives are engaged in procurement of coffee, largely from the members;however, deliveries are now also accepted from non-members.GICs : After the liberalization, the Government promoted GICs (Groupement d’Interets Communs) as amechanism to organize farmers into smaller, independent Producer Organizations (OP‟s). GICs consist5 Prior to liberalization, data on coffee production, farmgate prices and coffee acreage was regularly collected. However such data isno longer collected and self reporting by the exporters/roasters/cooperatives form the basis of coffee sector statistics.11
typically of 30-50 farmers and though they are informal structures, most are registered at the regional leveland can be further grouped into unions. Besides farmer‟s GIC, in some instances farm laborers and hullershave also created GICs. Information on the number of GICs engaged in coffee production is not available;however, they have a sizable presence in few coffee growing areas. GICs interact directly with hullers and areoften able to negotiate a better price for coffee.Agents: During the state control period, the Government used to provide licenses to the agents and only afew Licensed Buying Agents (LBA) could procure coffee directly from the farmers. Liberalization led to aproliferation of agents since the licensing requirement was abolished. Currently, the active agents could bebroadly divided in the following three categories: i) commission agents who work on behalf of hullers andreceive commission, based on the amount of coffee purchased; ii) farmers who perform the agent functionand aggregate coffee from their fellow farmers and sell it to hullers or exporters directly; and, iii) independentagents/speculators (“coxeurs”) who are individual entrepreneurs with some capital base and act as traders. Insome instances agents have long standing relationships with farmers and provide pre-harvest credit. Suchrelationships, however, are limited and on-the-spot cash transactions is the norm in the industry.Hullers and graders: After the coffee is sun-dried on-farm (and de-pulped in the case of Arabica) it needs tobe further dried and hulled (decorticated), to produce clean coffee. The output of the hulling process is, at itssimplest, ungraded, decorticated, green coffee (also known as café marchand). Some hullers also perform thegrading and sorting function. Currently, many independent hullers, some with new plants and many with oldplants, are located in the main towns of the coffee production areas. These hullers sign formal contracts withexporters which are normally re-negotiated at the beginning of the each season. There are some hullers whoonly procure exclusively for their exporters, while many hullers supply coffee to multiple exporters either onthe spot or through seasonal contracts.Exporters: The number of export licenses issued immediately post liberalization in 1994, approached 700,because of low entry barriers. A very small percent of those license holders were engaged in actual exportingand the majority of them withdrew from the sector. Banks extended credit to many new exporters and theirsubsequent failures led to bad debts for the banks. Today the export sector has consolidated and the top fiveexporters account for more than 90 % (table 3) of the total coffee exported form Cameroon. Only one firm(UTI) is an independent Cameroonian owned major exporter and rest of the major exporters are either underforeign ownership, or closely affiliated with coffee importing companies.Table 3. List of exporters and 2008/09 export volumes and percentage of volume.Exporter(Robusta)Volume ofRobusta% of totalRobustaExporter(Arabica)Volume ofArabica% of totalArabicaexportsexported (Kg) exportsexported (Kg)Olam 9,868,800 32.30 UCCAO 1.474,500 40.82Nealiko 6,715,000 21.98 NWCA 786,780 21.78ED &F Man Cacoa 3,667,200 12.00 Olam 733,760 21.42Crete 3,081,600 10.09 CCAF-CAM 273,600 7.57SARLUTI 2,934,000 9.60 ETS GRA- 78,660 2.17CACOA-CAFERemaining 15 4,289,342 14.03 Remaining 9 264,540 6.24exportersexportersTotal 30,555,942 100 Total 3,611,840 100(Source: ONCC-CICC Coffee Campaign 2008-09, December 2009)12
After their post-liberalization experience, the majority of banks became reluctant to lend to the coffee sector.To meet the credit requirement of the sector, exporters extend credit to hullers or intermediaries, typically fora period of between two and six weeks, to allow them to procure coffee from farmers. In addition, trustedhullers or intermediaries are provided with lines of credit (long term seasonal credit) which is extended tofarmers during the course of the growing season.Forwarding agents: There are two major forwarding agents (UTRAC and SDV) who undertake the task ofhandling all port functions on behalf of exporters. This involves customs documentation, warehousing,loading and filling of the containers, ensuring inspection and certification, and dockside functions leading toshipping. In the case of UTRAC, the forwarding agent is also operating an independent warehousing andgrading factory in Douala.Domestic Roasters: Currently there are approximately 24 domestic roasters who caters to the local andregional markets (table 4). The consumption of coffee in Cameroon is relatively low 6 and is estimated at lessthan 2 % of the total coffee production. Cameroonian roasters also export some coffee regionally, notably toGabon, Chad, Equatorial Guinea, and Nigeria. There is also a small export trade for roasted ground coffee toEurope and the USA. A few roasters also import coffee from neighboring countries, to manufacturespecialty blends.Table 4: Domestic roastersType of roaster Number of roasters Market shareHigh quality 6 30Medium quality 3 10Low quality 15 50(Source: Key informant interviews)6 Cameroon per capita coffee consumption is 0.2 kg per annum (2008) in comparison to 4.2 kg in USA. (Source :http://earthtrends.wri.org)13
4.0 Constraints in the coffee supply chainAlthough this assessment is geared to analyze risks in the coffee supply chain, it is important to also look atthe major constraints. Effective risk management often requires resolving the underlying constraints becausethe presence of constraints increases the likelihood of occurrence of risk and intensity of losses. A distinctionbetween risks and constraints helps in better categorization and development of strategies to manage them.Risks are unforeseeable events which cause losses (e.g. weather events, market events, pest and diseaseoutbreak, foreign exchange volatility etc), while constraints are conditions that leads to sub-optimalperformance of different stakeholders in the supply chain (e,g. lack of credit, limited access to extensionservices, poor infrastructure etc).Major constraints hampering the performance of the coffee supply chain are as follows:Access to finance: With the exception of the coffee exporters, who receive their financing from theirinternational parent companies, restricted access to finance was highlighted by all the other stakeholders astheir primary constraint. Interviews with small independent hullers showed that lines of credit from localbanks were either unavailable or insufficient and when provided were at prohibitively high rates of interest.Hullers either use their own funds to extend credit to suppliers, or have lines of credit extended fromexporters. Farmers rely on informal credit largely extended through retail input suppliers, but this lending islimited by the merchant‟s own availability of funds. Similarly, hullers extend informal credit to trustedfarmers. Credit is normally made to individual farmers and not collectively to GIC‟s. Cooperative sector waswell financed by banks prior to the liberalization; however, due to political interference, bureaucratic apathy,and years of bad management, majority of the cooperatives defaulted on their loans. The bad debt situationworsened after the liberalization when majority of the cooperatives could not sustain their commercialoperations and become defunct. Most of the cooperatives currently own huge debts to the bank, oftenrunning in few billion CFAF, and unless the bad debt situation can be resolved, banks are unwilling to lend tothe cooperative sector.Abandonment / limited management of coffee farms: As a result of the multiple shocks experienced by thecoffee sector since 1990, farmers have adopted several management strategies, which are detailed in Table 5.The main strategies adopted appears to have been option 1(crop substitution), 3 (partial abandonment) and 4(marginalization of coffee plantation) in the main coffee growing areas, where population density is high andland is scarce. In the eastern region, option 2, full abandonment, is also found, as land is more widelyavailable. Option 5, conhtinuing full management of the coffee plantation, has not been pursued widely. Sincethe majority of coffee plantations are intercropped, it is relatively easy for farmers to retain their coffee trees,but not to prune or tend them, whilst concentrating their cultivation efforts on other crops.Table 5. Farmer‟s management strategiesStrategyDetailsOption 1 . Crop substitution Cutting down of coffee tree/plantation and their replacement with other foodor commercial cropOption 2. Full abandonment Full abandonment of the coffee plantation not even picking up coffee cherryOption3. Partial abandonment Abandonment of the coffee tree but picking up coffee cherry at the time ofripeningOption4. Marginalization of Intercropping coffee plantation with other food/commercial crop and payingcoffee plantationlittle or no attention to coffee treesOption 5. Management of Effective management of coffee trees/plantation .coffee plantation(Source: Authors)14
Low Yields at farm level: Lack of extension services , scarcity and high costs of inputs, coupled with lowcoffee prices, have resulted in a vicious cycle of reduced yields, declining farmer income and further reductionin investments in husbandry (eg. reduced pruning, maintenance, pest and disease control). Typical yields havereduced from 800-1,000 kg/ha in the 1980‟s, to 300-350 kg/ha today. Majority of the existing plantations arenow 20-30 years old. Old age of tree further contributes to reduced yields and makes coffee plantations moresusceptible to pest and disease attack. Furthermore, low yields contribute to low profitability across theindustry since it leads to under utilization at mills and exports facilities.Ageing farmers and limited engagement of young farmers : The Cameroon Coffee Sector DevelopmentStrategy indicates this as a significant constraint for the industry. This was validated in the field. The majorityof the farmers, with whom the assessment team interacted were more than fifty years of age. However, insome areas (Mbafam and Ndjibe), majority of farmers were young (20-30 years) who had taken up coffeecultivation in the past 2-3 years due to the recent promotion activities undertaken by the Government.Despite the promotion, it is difficult to attract new farmers to coffee cultivation owing to the issues of landinheritance, urban emigration, and engagement in more productive rural enterprises.Poor road infrastructure: The road infrastructure is relatively less developed in Cameroon and almost allfeeder roads from farms and villages are dirt roads. These roads become impassable during the rainy season,which is also the time for coffee transportation from farms to hullers. At times, in some remote locations,farmers don‟t harvest their coffee cherries because of their inability to transport the harvest to markets.Current structure of the coffee supply chain: The cooperative structure in the pre-liberalisation periodprovided farmers with a highly supportive framework for growing and marketing coffee. The current coffeeproduction and marketing structure, however, is highly fragmented and there is a limited direct engagementof the private sector actors (exporters and hullers) with the coffee farmers. The support structure for farmerswith regard to access to information, input supply, finance, and markets, is not very robust. This does notcreative positive incentives for the farmers to continue coffee production.Access to inputs- Availability of inputs (chemicals, pesticides, planting material, and tools) has been cited as amajor problem by the farmers in the focus group discussions (annex 3). Most of these inputs were providedby the cooperatives, either free or at subsidized rates, before the liberalization, and the current availability ofthese inputs is limited. This serves as a constraint for the farmers who wish to engage in proper managementor renewal of their coffee plantations.15
5.0 Major risks and capacity to manageCoffee production and exports have declined rapidly over the past thirty years and a large number of risks areresponsible for this decline. The major risks are detailed below in Table 6 and grouped into three maincategories: production, market, and other.Table 6: Major Identified Risks in the Coffee Supply Chain in CameroonIdentified RisksProduction risksPest and diseaseDelayed onset of rains and floweringMarket risksCoffee price riskVolatility of fertilizer pricesDefault riskCrop substitutionOther risksPolicy/ Regulatory riskSecurity of cash in transitInterviews with key coffee industry stakeholders and a detailed review of coffee sector production andexports was undertaken to identify and analyze the risks. Subsequently, identified risks were assessedaccording to the potential to produce losses and the frequency of such events occurring. This assessment iscaptured in Table 7 below. The identified risks located in the darkest grey area (upper right corner) of Table 7represent the most significant risks due to their potential to cause the greatest losses (even at catastrophiclevels) and the frequency of their occurrence. The second level of importance is represented by the light greyboxes, whereas the clear boxes (on the left side of table) represent identified risks that either have lowpotential to cause damages and/or their frequency of occurrence is low.16
Probability of EventTable 7. Summary of risks: Severity vs. probabilityPotential Severity of ImpactNegligible Moderate Considerable Critical CatastrophicHighlyprobablePest anddiseaseProbableCoffee priceriskOccasional Security of cashin transitCrop substitutionVolatility offertilizer pricesDefault riskPolicy/regulation riskRemoteDelayedonset ofrains andfloweringImprobable5.1 Production risk: Pest and disease (coffee berry disease (CBD), coffee borer and coffee leaf rust) anddelayed onset of rains and flowering are the two major production risks to the Cameroon coffee supply chain.Pest and diseaseSeverity: ModerateProbability: Highly probableInability to manage pest and disease incidences has been one of the major reasons for the decline of Arabicaproduction from 30,000 MT in mid 1980s to 3,000 MT in 2009. Coffee berry disease, coffee rust, and coffeeborer are causing significant quantity and quality losses. Lack of plant protection material, advice andunderstanding of pests and diseases control, coupled with lack of incentives to manage plantations, are themajor limitations in confronting this risk. This risk is classed as moderate as it impacts mainly Arabica coffeeproduction, which is currently a relatively small part of Cameroonian coffee industry.Coffee Berry Disease (CBD): This is caused by the virulent strain of Colletotrichum coffeanum afungus that lives in the bark of the coffee tree and produces spores which attack the coffee cherries.It is one of the most severe diseases for Arabica coffee and, in many cases, causes losses of almost17
30-50 % of the production 7 . CBD has infected the Arabica production region for the past 15-20years and infestation rates vary from 40-60%. It has destroyed significant acreage of Arabicaplantations and, despite higher prices of Arabica coffee, many farmers have switched over to othercrops because of their inability to manage this risk. The Government is now promoting CBDresistant coffee varieties which will help reduce the losses from this disease.Coffee Borer: The insect bores into the coffee cherries damaging the coffee bean, affecting thequality of the coffee and consequently lowering the production and efficiency yields. It can causecoffee farmers to lose up to 20 % of a crop and reduce the price by 30-40 %. Professionalmanagement of the coffee plantations is essential for the prevention and eradication of the coffeeborer disease. This is a relatively minor disease and largely affects the Robusta plantations.Coffee Leaf Rust: There is a high prevalence of this disease and it largely affects the Arabicaplantations. Coffee leaf rust is spread by wind and rain from the lesions on the underside of theplant. It causes defoliation and can lead to 10-15 % yield reduction. This disease is closely linked tothe habits of the cultivation and management of the plantation.These pest and disease outbreaks and the resulting losses to the farmers are generally manageable through acoordinated effort focusing on integrated management approach. This approach requires a combination of 1)legislative control, 2) cultural control, 3) biological control, and 4) chemical control. If all these approachesare adopted consistently and implemented by coffee supply chain stakeholders, losses from pest and diseaseoutbreak can be greatly reduced.Delayed floweringSeverity: ModerateProbability: RemoteA few farmers indicated that flowering will be delayed during the current 2009/10 season due to the delayedonset of rains, and this will reduce coffee yields. This, however, is an anomaly. In general, weather conditionsare quite conducive for coffee production. The last known occurrence of delayed flowering was in the 1983-84 season when drought condition led to a 50-70 % 8 decline in production in the affected regions. Althoughthe uncertainty associated with climatic and weather patterns makes it difficult to predict future occurrencesof this event, however, based on historical patterns, the probability of its large scale occurrence is remote.7 Although Olam Cam estimates that 50 – 60% of the production is lost to Coffee Berry Disease (CBD) each year.(Source: World Bank 2010)8 Source : Annual report by National Produce Marketing Board 1983-84 Season18
5.2 Market Risk: Volatility in international coffee prices, steep rises in fertilizer prices, crop substitution, anddefault risks (credit, volume, and quality default) are the main market risks facing the industry.Coffee price riskPotential Severity of Impact: CriticalProbability of Event: ProbablePrior to liberalization, the Government managed a price stabilization program with the objective ofguaranteeing a stable price and shielding coffee farmers from the volatility in international coffee prices.While this offered some protection to the farmers against the fall in international prices, farmers did notbenefit from any price rise. In 1989-90 season, the international prices fell drastically and ONCPB was forcedto reduce the farm gate prices of Robusta by 60% from CFAF 440 to CFAF 175. Over the next 3 years, theprices continued to fall and Government could not afford to maintain its price stabilization program. Thisprice decline, coupled with advice from international donors, promoted the Government of Cameroon toliberalize the coffee sector. After liberalization, farmers‟ share of the FOB price increased (figure 6) from anaverage of 51% (1970-1993) to 60% (1994-2001), however, it also exposed them to frequent volatility ininternational coffee prices.Due to higher international prices for Arabica, farmers received on average between CFAF 600-800 /kg fortheir coffee (figure 7). This has been much higher than CFAF 450 they received during the liberalization era.Robusta coffee which accounts for more than 90% of current production, on the other hand, fared muchworse. While farmers received CFAF 440/kg for their Robusta coffee from 1985-1989, in the next twentyyears (1989-2009), they received more than CFAF 400 only in four years, and in 16 out of twenty years, theyreceived prices in the range of CFAF 250-350 (figure 8).Figure 6: Farm gate prices as % of FOB prices1009080706050403020100RobustaArabica(Source: ONCC)The period of low international coffee price (2000-2003) made coffee cultivation unattractive leading toabandonment of coffee plantations and crop substitution. Many hullers and exporters lost sizable moneyduring this period due to speculation. Furthermore, decline in coffee production made it unviable to sustaincoffee hulling and exports operations and many traders, hullers, and exporters quit their coffee operationsduring this phase.19
Figure 7: FOB, Farm-gate Prices and International prices for Arabica coffee (1970-2007)(Source : ONCC and authors‟ elaboration. Missing Data 2001-2005 and 2008-10)Figure 8: FOB, Farm-gate Prices and International prices for Robusta coffee (1970-2007)(Source: ONCC and authors‟ elaboration. Missing Data 2001-2005 and 2008-10 9 )9 ONCC was unable to provide data on domestic farm gate prices from 2001/02-2004/05 seasons) but it is reasonable to expect theprices to have been below CFAF200 during this period.20
Since 2004, international coffee prices have increased substantially and this has led to a resurgence of interestin the coffee sector. While the farm gate coffee prices have risen, however, general inflation and input priceshave risen much faster and coffee farmers‟ net income is far less than what it used to be during the mid 80s.At the same time, prices of cocoa, palm oil, fruits and vegetables and other alternative crops have been rising,serving as a big disincentive for the coffee farmers to continue coffee cultivation.Intra-seasonal price volatility, as well as possibility of long term decline in coffee prices, continues to be asignificant risk for the Cameroon coffee industry. Farmers are aware of the price movements, throughnewspapers and social networks, but they have limited mechanisms to manage the price risk. The option ofstoring and selling coffee later when prices are higher is not feasible for majority of the cash constrainedfarmers. In some cases, farmers pool their coffee, formally through GICs or through informal networks, tobargain with traders for higher prices. Cooperatives, because of their ability of manage greater volumes ofcoffee could engage in price hedging on behalf of their member farmers, however, most of the cooperativesare dysfunctional and not in a condition to hedge against price risk. Under such conditions, improvingproductivity and lowering cost of cultivation, might be more proactive strategies for the farmers to providesome protection against the fall in coffee prices.The practice of entering into short duration contracts (10-14 days), offers some protection to hullers, tradersand exporters against short term adverse price movements. The majority of exporters, being part ofinternational trading enterprises, are hedging against price risk in commodity exchanges and are secured, tosome extent, against seasonal price volatility. Domestic exporters with no international affiliation, on theother hand, have limited understanding of such tools and/or access to commodity exchanges and are notusing such mechanisms to protect themselves against adverse price movementsVolatility of fertilizer pricesPotential Severity of Impact: ConsiderableProbability of Event: OccasionalFertilizer prices and availability has been cited as the biggest problem in the farmers‟ focus group discussion(annexure 3), and a result, current usage of fertilizers in very limited. While Urea prices were in the range ofCFAF 10,000 /bag in 2003-04, it jumped up to CFAF 25,000 in 2009 due to international fertilizer price hike(figure 9). While the international price dropped significantly in June 2009 and reverted back to 2007 levels,prices of fertilizer in Cameroon continue to be high.21
Figure 9: Fertilizer prices in Cameroon and US3000060025000500CFAF per Bag(60 Kg bag)200001500010000400300200US$ per ton500010002003 2004 2005 2006 2007 2008 2009 20100International Urea Prices ($US per ton)Urea (High)20:10:10(High)Urea (Low)20:10:10 (Low)(Source: Agricultural Delegation office, Northwest Region, Cameroon (Missing data 2006-2007) and National Agricultural StatisticsService, USDA)Farmers at times respond to fertilizer price rise by reducing the fertilizer usage leading to lower yields andincomes. There is little scope for farmers to mitigate against this risk as they purchase their inputs at specifictimes as and when required and are unlikely to have the financing or facilities for pre-ordering or prepurchasingfertilizers to lock-in prices. There is likely to be continued volatility in input prices, however,promotion of efficient usage of fertilizers (better cropping practices) and promotion of manure/compostcould help in partial mitigation of risk.Default RiskPotential Severity of Impact: ConsiderableProbability of Event: OccasionalThe entire supply chain is exposed to this risk and different stakeholders have experienced financial lossesdue to counterparty (either farmer, agent, huller, or exporter) defaulting on the money advanced as well as onthe quantity and quality supplied. Exporters attempt to manage default risk by relying on a few committedsuppliers and advancing only part of the total finance required by the hullers/traders. Despite careful scrutinythere are incidences of default by hullers/traders, especially during the period of intense price volatility whereupward movement in prices encourages them to default on their contracts.Farmers, at times, also take advantage of competing traders and default on their commitments. This leads toconsiderable financial losses to various actors, mostly exporters; it also creates an environment of mistrust inthe supply chain which hampers long term competitiveness. Supply chain integration, greater transparency intransactions, and access to finance for different stakeholders, could lead to reduced occurrence of default risk.22
Crop substitutionPotential Severity of Impact: ConsiderableProbability of Event: OccasionalIn the past, lower coffee prices have prompted farmers to uproot their coffee trees and replace them withalternate crops. The coffee crisis of 2000-2003 led to large scale crop substitution as farmers migrated fromcoffee to cocoa, as evidenced by figure 10. Currently, cocoa, palm oil, peppers, fruits and vegetables areproviding higher income than coffee and are becoming more attractive options for the farmers. Returns fromcoffee cultivation as well as returns from other crops (over which the coffee industry has little control) aremajor factors that determine farmers‟ cropping decision and crop substitution. Better supply chain integrationand increasing farmers‟ incomes by improving yields could be some risk mitigation measures to manage thisrisk.Figure 10: Coffee and Cocoa Area Harvested HA 1975-2008(Source: FAOSTAT)5.3 Other risksRegulatory/ Policy riskPotential Severity of Impact: CriticalProbability of Event: OccasionalCoffee is a politicized commodity and despite liberalization, the Government still plays an influential role inthe coffee sector. Ministry of Commerce stipulates, through its reglementation 10 , the conditions under whichcoffee cherries can be harvested and sold. The post-liberalization period (1994-2005) did not see proactiveGovernment involvement in the coffee sector. In the past four years, however, the Government has started10 Ministry of commerce does this through its annual circulars called “Reglementant le conditionnement et la commercialization descafes verts” (Regulating the packacing and commercialization of Green coffee”23
to pay closer attention to the sector, and has developed programs aimed at increasing production through thedistribution of subsidized planting materials and fertilizers. While this has led to a resurgence in interestamong many farmers, it has also raised expectations of increased Government intervention in the sector.Many stakeholders in the supply chain have a somewhat nostalgic image of the pre-liberalization era and it isassociated with „good times‟ in the industry. There is a belief, among many stakeholders, that re-instatementof the former system would lead to prosperity. This legacy of the past might create political incentives forgreater state regulation and repeal of some of the earlier policies which could create significant risks for theindustry. The risk of sudden changes in the regulation of the sector is real and could have significantramifications for the industry. Proactive lobbying by the coffee industry stakeholders and greater engagementin policy formulation, and clarifying expectation, could help in managing this risk.Security of cash in TransitPotential Severity of Impact: NegligibleProbability of Event: OccasionalThe rural areas in Cameroon have limited banking facilities and exporters and their agents need to travel withcash to make payments for coffee procurement. The majority of exporters indicated that security of cash intransit is a big risk for them and all of them have suffered some losses in the past due to cash being stolen orrobbed from their agents. The volume of such losses, however, is negligible for the industry.24
6. Vulnerability to riskBased on the risk assessment and capacity to manage risks described in the previous sections, this sectionoffers an additional step to classify the risks according to different levels of vulnerability. For the purpose ofthis exercise we can define vulnerability as a function of the expected losses from an adverse event and thecapacity to respond to this risk. This last step in the analysis of risks not only allows a more comprehensiveassessment of the level of risk, but also helps to identify priorities to improve current risk managementapproaches. At this stage, the analysis seeks to pinpoint clear gaps in the prevailing approach(es) to riskmanagement and/or circumstances where prevailing practices are unlikely to be sufficient given the potentialseverity of loss.Even though at this stage the analysis is more qualitative than quantitative, the results shown here are usefulfor contrasting these findings with current risk management practices by stakeholders in the supply chain.Based on the information that was collected during the mission and background information, theeffectiveness and current capacity for managing pertinent risks has been reviewed and rated utilizing the 1-5scale outlined in Table 8 below.Table 8. Vulnerability to Risky Events Based on Expected loss + Capacity to Manage Risk(-) -------------------------------Capacity to Manage Risk -------------------------- ( +)Expectedlosses1 2T13T24 5High Coffee price risk Policy/regulation riskT3T4MediumVolatility offertilizer pricesDefault riskT5T1Crop substitutionLowPest and diseaseT2T3T4T5The resulting matrix classifies vulnerabilities to the identified risks into five groups, from the highestvulnerability containing the risks in the boxes with the darkest shade marked as T1 (tier 1) upper left corner,towards the risks ranked with lowest vulnerability shown in the boxes with the clear shades towards the rightbottom side of the table marked as T5 (tier 5). There are in between three additional intermediatevulnerability levels which are in lighter shade. The importance of this matrix is that, through a process ofprioritization, it is possible to identify those risks in Tier 1 and Tier 2 that are mainly responsible for causingvolatility of earnings for the various stakeholders. Managing those risks will, to a large extent, reducevulnerability of the coffee industry.25
7.0 Priority Measures for Risk ManagementThough it is beyond the scope of this Risk Assessment exercise to come up with a comprehensive frameworkwith detailed measures on how to manage the identified risks, an illustration on how this next step can beapproached is presented in Table 9. For illustration purpose, this table only deals with the major risksgrouped under Tier 1 & 2 in the previous section.For a comprehensive risk management framework it is useful to classify the measures or tools for riskmanagement in terms of three main groups:Risk Mitigation. Actions taken to eliminate or reduce events from occurring, or reduce the severity of losses(e.g. pest and disease management, crop diversification, extension, etc).Risk Transfer . Actions that will transfer the risk to a willing third party, at a cost. Financial transfermechanisms will trigger compensation or reduce the losses in the case of a risk generated loss (e.g., insurance,re-insurance, financial hedging tools, etc.).Risk Coping. Actions that will help cope with the losses caused by a risk event (e.g. government assistance tofarmers, debt re-structuring, etc.). It could also be managed by shifting a country‟s focus from a post-disasterresponse to a proactive (ex-ante) risk management (e.g. through financial provisioning).Table 9: Illustration of Measures for a Risk Management FrameworkIdentified Risks Proposed MitigationCoffee price risk Long term forward contracts Specialty/ Niche markets(decommoditization) Yield improvementsPolicy/regulation riskLobbyingActive engagement in theprocessProposed RiskTransfer ToolsHedging incommodityexchangeProposed RiskCopingSavingsAdjustmentof businesspracticeVolatility offertilizer pricesLong term forwardcontractsPromotion of efficientusage of fertilizer ( bettercropping practices)Promotion of manure/compostCrop substitution Supply chain integration Improvement of coffeeyield Improved farm levelincome26
Table 9 above is merely an illustrative, and not an exhaustive, set of activities that could be undertaken formanaging the risks in the coffee supply chain. Risk transfer solutions, owning to the nature of the risk andspecific structures in the Cameroon coffee supply chain, might have limited applicability. Risk mitigation andcoping solutions, on the other hand, might provide a better return on investments. In-depth evaluation of theindividual solutions was beyond the scope of this exercise, however, exhaustive listing and an assessment ofcost/benefit of different solutions needs to be undertaken by the coffee sector stakeholders.8.0 Final remarksThe coffee industry has experienced multiple shocks (liberalization, the international coffee price crisis, pestand disease) and the cumulative impact of all these shocks has been a rapid decline in national coffeeproduction. Despite the decline, coffee is still an important source of income for certain farming householdsand the fourth largest agricultural export commodity for Cameroon. Realizing its significance for the country,the Government and international donors have focused their attention on reviving the industry andCameroon‟s coffee strategy has been developed as a blueprint for that revival.Besides overcoming the large number of constraints, any successful reinvigoration of the sector requiresattention on the effective management of key risks facing the industry. Long term price decline and intraseasonal price volatility continue to be the biggest risk for the country and any sudden drop in prices mightlead to another round of acreage and production losses for the country. The „legacy‟ of the past andexpectations, by many stakeholders, of increased state intervention and changes in regulation in the coffeeindustry pose another serious risk for the industry.Input markets are poorly developed in Cameroon and fertilizer usage is very low. Steep rises in fertilizerprices will further reduce its application leading to adverse impact on coffee productivity and farmers‟income. Crops like cocoa, fruits and vegetables, and palm oil are providing greater incomes to farmers andthis poses the risk of crop substitution for the coffee industry. Effective management of these risks willrequire a strategy combining elements of risk mitigation, transfer, and coping.Cameroon‟s coffee revival strategy needs to address the structural impediments in the supply chain, focus ondeveloping win-win relationships among various stakeholders, and develop mechanisms to improve theresilience of the supply chain to manage future shocks. This document highlights and prioritizes risks in theCameroonian coffee supply chain and should be used to stimulate discussion and inform the implementationof the national coffee strategy.27
References:World Bank (2009) Production of Washed Coffee – Arabica and Robusta: Feasibility Study, December, 2009World Bank (2008) Cameroon Agricultural Value Chain Competitiveness Study, June 2008ITC (2009) Cameroon Coffee Sector Development Strategy 2010-2015CTA (2008) An Interprofessional Organization for Coffee and Cocoa in Cameroon, for which services andfor whom? September 2008African Economic Research Consortium (2002) Determinants of Agricultural exports: The case of Cameroonby Daniel Gbetnkom and Sunday A Khan. AERC Research Paper 120. African Economic researchConsortium, Nairobi August 200228
4 th May(Tuesday)Abong-Mbang4 TH May(Tuesday)Melong-Nkongsamba5 th May(Wed)DoualaIndependent Huller EFFOWAKEU FrançoisNKWEJA PatriceTETINOU RigobertMeeting with large Farmer TEMKENG(16 ha)Extension MINISTRY OF NZIE Emmanuel (Focal Point)AGRICULTUREHullerTOKAM FOTSO Jean ClaudeFocus group discussion in village NDJIBEFarmers meeting in ANKOAMBOMB village (village)MINISTRY OFNGONG Christopher Fertilizer sub-sector reformAGRICULTUREprogrammeLarge Farmer and Wife NDIKI Guy and NDIKI SidonieJACO Representative, KENGNI SylvestreAgence de PaysanRetailer, Maison des TCHAPTCHET PhilippePlanteursIndependent Huller TANETCHOP NorbertADER (Fertilizer company) NDENGUE MOLE (Logistic Manager)ONCCGIC PROBA(exporter)AFRILAND FIRST BANKUTRAC (Logistics)MALEDY Omer (Special Advisor)KONLACK Raymond (Administrator)NGUEGANG Cyrille (Credit Manager)LOVET LaurentNKWADA Justin6 th May(Thursday)DoualaEPO Serge RegnaultMETEOROLOGICAL SAAH Michel Legrand (National Director)DEPARTMENTStakeholder Workshop to share the assessment findings with selected coffee stakeholders30
Annexure 2.List of Participants at the stakeholders’ meeting: Hotel Ibis Douala6 th May, 2010Name Organization ContactAlicia Aleman Nealiko 8+77278414Kangkolo Nawi Nealiko +77590949 enkwi@nealiko.comTchakounte Ephreim UTI direction@uticameroun.comMbiangane Lamber SAICAM Sarl +99726852Dikoune Jean GEX +77753760Anore Armelle Torrecan 99680228cafepierreandre@yahoo.frNgankan MichelSAICAM Sarl – GraceDistributions99844702michel_ngankam@yahoo.frEko Paul LAFCOOP Ltd 96333269/75584299ekopaul@yahoo.comFogue Jean Pierre UCAL Jeanpierrefogue24@yahoo.fr77865847 / 3349250031
Annexure 3 Farmers’ Risk PrioritizationFarmer’s Risk Prioritization (n=66)2520151050Priority I Priority II Priority IIIFertilizer prices and availability, availability of inputs (chemicals, pesticides, planting material and tools), coffee prices and access to credit has been citedas the biggest problem by the farmers in the focus group discussions. There is, however, regional variation. While in Ndjibe village where farm size isrelatively large, plantation management is the biggest issue for the farmers. But in Mbafam village, access to farm inputs and higher prices of fertilizer isthe biggest issue. In Belo village, access to credit and access to farm inputs has been cited at the biggest problem by the farmers.32
Farmers' Risk Prioritization Mbafam Village (n= 18)121086420Finance Fertilizer Pest & Disease Prices Inputs (Tools,pesticide andplanting material)Priority I Priority II Priority IIIRisk Prioritization in Ndjibe Village (n= 14)86420PlantationMgmtFertilizer Disease Prices Input Cheating byLBAsPriority I Priority II Priority IIIFarmers' Risk Prioritization Belo Village (n= 16)121086420Finance Fertilizer Pest & Disease Prices Inputs (Tools,pesticide andplantingmaterial)Priority I Priority II Priority III33