Consumer Choice
Consumer Choice
Consumer Choice

Create successful ePaper yourself
Turn your PDF publications into a flip-book with our unique Google optimized e-Paper software.
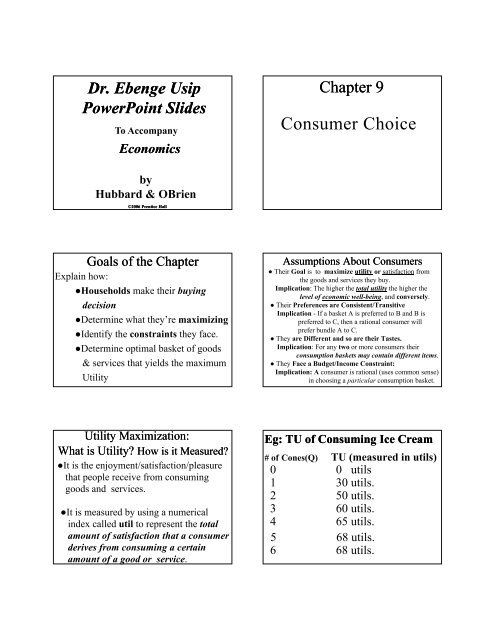
Dr. Ebenge UsipPowerPoint SlidesTo AccompanyEconomicsChapter 9<strong>Consumer</strong> <strong>Choice</strong>byHubbard & OBrien©2006 Prentice HallGoals of the ChapterExplain how:●Households make their buyingdecision●Determine what they’re maximizing●Identify the constraints they face.●Determine optimal basket of goods& services that yields the maximumUtilityAssumptions About <strong>Consumer</strong>s● Their Goal is to maximize utility or satisfaction fromthe goods and services they buy.Implication: The higher the total utility the higher thelevel of economic well-being, and conversely.● Their Preferences are Consistent/TransitiveImplication - If a basket A is preferred to B and B ispreferred to C, then a rational consumer willprefer bundle A to C.● They are Different and so are their Tastes.Implication: For any two or more consumers theirconsumption baskets may contain different items.● They Face a Budget/Income Constraint:Implication: A consumer is rational (uses common sense)in choosing a particular consumption basket.Utility Maximization:What is Utility? How is it Measured?●It is the enjoyment/satisfaction/pleasurethat people receive from consuminggoods and services.●It is measured by using a numericalindex called util to represent the totalamount of satisfaction that a consumerderives from consuming a certainamount of a good or service.Eg: TU of Consuming Ice Cream# of Cones(Q) TU (measured in utils)0 0 utils1 30 utils.2 50 utils.3 60 utils.4 65 utils.5 68 utils.6 68 utils.
What is Marginal Utility (MU) ?How Is It Calculated?●Thechange in the TU a personreceives from consuming additionalunit of a particular good or service.Note: A change can be an increase ora decrease●Computation Rule: MU = )TU÷)Q■The rule is used as follows:Eg: Ice Cream Consumption# of Cones(Q) TU MU = ΔTU÷)Q0 0 -1 30 30 (30-0)/(1-0)2 50 20 (50-30)/(2-1)3 60 10 (60-50)/(3-2)4 65 5 (65-60)/(4-3)5 68 4 (68-65)/(5-4)6 68 0 (68-68)/(6-5)Numberof ConesGraphs of TU & MULisa’s Total and Marginal Utility fromConsuming Ice Cream ConesTotalUtility0 0 utils1 3 0 utils2 5 0 utils3 60 utils4 65 utils5 68 utils6 68 utilsMarginalUtility3 0 utils2 0 utils1 0 utils5 utils3 utils0 utilsUtilsUtils70605040302010302010(a)Total Utility1 2 3 4 5 6Ice Cream Conesper Week(b)1 2 3 4 5 6Marginal UtilityNotes● TU rises with Q but at a decreasing rate after Q = 3.● MU falls continuously as Q rise; could even be zero after Q = 6Ice Cream Conesper WeekText Example: Graphs of TU & MU9 – 1, p. 274Total and Marginal Utilityfrom Eating Pizza onSuper Bowl SundayNotes● TU rises with Q but at adecreasing rate after Q = 3.● MU falls continuously as Qrise; could even be negativeafter Q = 5The Law of Diminishing MUWhat is it?<strong>Consumer</strong> experience diminishing additionalsatisfaction (or MU) as they consume more ofa good/service during a given period of time.Question: When does a rational consumerstop consuming additional unit?Answer: When MU = PReason: ■MU reflects the extra benefit ofconsuming an extra unit,■P reflects the extra cost of buyingthat extra unit.Suppose You Hungry, How ManyHotdogs Would You Buy?Up to where your MU = PIf MU > P you will buy another one.If MU < P you won’t buy that lasthotdog
TU and MU From Eating Pizza& Drinking Coke 9 – 1, p. 275NUMBER OFSLICES OFPIZZATOTAL UTILITYFROM EATINGPIZZAMARGINALUTILITYFROM THELAST SLICENUMBER OFCUPS OFCOKETOTAL UTILITYFROMDRINKINGCOKEMARGINALUTILITYFROM THELAST CUP0 0 0 01 20 20 1 20 202 36 16 2 35 153 46 10 3 45 104 52 6 4 50 55 54 2 5 53 36 51 −3 6 52 −1●Budget Constraint: The limited amount of income available toconsumers to spend on goods and services●Budget Equation: The equation form of the budget constraintgiven as follows: I = Px.X + Py.Y●Income = Expenditure (≡ Px.X + Py.Y)Is There A Rule for choosing theUtility-Maximization Basket?YES! YES!! YES!!!●Given the budget constraint, theconsumer should choose the combinationwhere MU per dollar is the same for all thegoods in the basket.i.e., MU X ÷P X = MU Y ÷P Y●Once the equality is attained, there is nofurther gain in utility by reallocatingexpenditures in either direction●This is the MU Approach of Utility Max’tion.Using the Rule to Choose BestCombination of Pizza & Coke9 – 2, p. 276(1)(2)(3)Marginal Utilityper Dollar (4)(5)MUSlices Marginal Utility⎛⎜⎞⎟ Cups Marginal UtilityPizzaof Pizza (MU Pizza ) ⎝ Pizza⎠of Coke (MU Coke )(6)Marginal Utilityper Dollar⎛ MUCoke⎞⎜⎟⎝PCkCoke⎠1 20 10 1 20 202 16 8 2 15 153 10 5 3 10 104 6 3 4 5 55 2 1 5 3 36 −3 -- 6 −1 --● Optimal choice is: 3 slices of pizza and 4 cups of coke● The reason is as follows:Using the Rule, continued● Budget constraint = $10 to spend● Pizza (X) P X = $2/slice● Coke (Y) , P Y = $1 per cup●Optimal/best choice is:3 slices pizza (X) & 4 cups of coke (Y)Reason:MU X ÷P X = MU Y ÷P Y = 5 utils●This is the utility maximizing bundleor combination, because Tom’s incomeconstraint ($10) = Expenditure ($10)= 2x3 + 1x4 (≡P X .X + P y .X)More on Why (3,4) is the UtilityMaximization CombinationCombinations of Pizza and Coke withEqual Marginal Utilities per Dollar9 – 3, p. 276Marginal Utility per Dollar(Marginal Utility/Price) Total Spending Total Utility1 Slice of Pizza and 3 Cups of Coke 10 $2 + $3 = $5 20 + 45 = 653 Slices of Pizza and 4 Cups of Coke 5 $6 + $4 = $10 46 + 50 = 964 Slices of Pizza and 5 Cups of Coke 3 $8 + $5 = $13 52 + 53 = 105● (1X,3Y) combination is affordable at $5 but Tom does not achieve themost satisfaction (TU = 65 utils) given his income of $10● (4X,5Y) combination is NOT affordable at $13 since Tom has only$10 to spend even though that combination would yield the highestlevel of satisfaction (TU = 105 utils).● (3X,4Y) combination is affordable at $10 which how much Tom hasto spend to achieve the best satisfaction (TU = 65 utils) possible.Example 2: Anita’s ProblemAnita’s Income = $9/dayPizza (X) at $1/slice Pepsi at $.50 per canQ TU Q TU4 slices 115 5 cans 635 slices 135 6 cans 756 slices 154 7 cans 867 slices 171 8 cans 96What combination of pizza and pepsi willmaximize her utility/satisfaction?
Example 3: Anita’s ProblemAnita’s Income = $9Pizza: P = $1/slice Pepsi: P = $.50/canQ TU MU MU/P Q TU MU MU/P4 115 - - 5 63 - -5* 135 20 20* 6 75 12 246 154 19 19 7 86 11 227 171 17 17 8* 96 10 20*Utility Max. Combination is (5 slices, 8cans)Graphical Analysis: The BLAnita’s Income: I = $9Price of Pizza (X): P x = $1/slicePrice of Pepsi (Y): P y = $0.50/canBudget Constraint Equation:9 = 1X + .50YY-intercept (no pizza) = 9/.50 = 18 cansX-intercept (no pepsi) = 9/1 = 9 slicesGraphical Analysis: The BL & theIndifference Curve (IC)Pepsi (Y)18 Utility Max. combinationor bundle is (5,8) at C8 CIC5 9Pizza (X)More ApplicationsDo in class Problems1. #4, p. 2952. #7, p. 296Practice Problems: #3, p. 295Solutions for Problem # 4 p. 295(1)Quantity ofTwinkies(2)Marginal Utility ofTwinkies(MU T )(3)Marginal Utilityper Dollar (4)⎛ MU ⎞ T⎜⎟⎝ PT⎠Quantity ofHo-Hos(5)Marginal Utility(MU H )(6)Marginal Utilityper Dollar⎛ MU ⎞ H⎜⎟⎝ PH⎠1 10 10 1 18 92 8 8 2 16 83 6 6 3 14 74 4 4 4 12 65 2 2 5 10 56 0 0 6 8 47 0 0 7 6 38 0 0 8 4 29 0 0 9 2 110 0 0 10 0 0● Joes’ Income = $16; P T = $1/pack; and P H = $2/pack● He maximizes utility by buying 4 pack of Twinkies and 6 packs ofHo-Hos. He spends all his income and MU = 4 for both goodsSolutions for #7, p. 296Mary will maximize her utility if the●MU/p is the same for corn chip and sodas● she spends fully her budget on the 2 goods.●Problem: Price of each item is unknown,so we have to assume that they are the samebefore we can apply the utility max. rule.● Since the MU = 10 utils for both goods, sheis maximizing her utility only if the price ofa bag of corn chips is the same as the priceof a bottle of soda, and she is also spendingthe amount of the budget allocated to cornand sodas.
How Does the <strong>Consumer</strong>Modify her/his Behavior WhenIncome Changes?● A rise: <strong>Consumer</strong> can afford to buymore units of both goods if theyare normal (note: BL shifts right)● A Fall: <strong>Consumer</strong> buys fewer units ofboth goods if they are normal(note: BL shifts Left)A rise in Income:Effects of an Increase in IncomeNumber of30Movies per 27Month1. When Max'sincome risesto $300, hisbudget lineshiftsoutward.H''15AB12C963DEF2. If his preferences are as given in thetable, he'll choose point H (6,12)HH'3.But different marginalutility numbers couldlead him to H' or H''1 2 3 4 5 6 7 8 9 10 Number of Concertsper MonthHow Does the <strong>Consumer</strong> ModifyBehavior when Prices Change?● A rise: <strong>Consumer</strong> buys fewer units of thegood whose price has risen.(note: BL rotates inward)● AFall: <strong>Consumer</strong> buys more units of thegoods whose price has fallen.(note: BL rotates outward)Implication: A change in the price producestwo effects – income effect (IE) andsubstitution effect (SE) - that furthervalidate the Law of Demand.What is the IE of a PriceChange ?The change in q d that arises from a changein the price of a good/service on consumerpurchasing power (of income), cet. par.Note: Real I = [Nominal I ÷ CPI]x100measures the PP of income■IE is Positive if the good/service isnormal (all necessities & luxuries)■IE is Negative if the good/service isinferior (e.g. ground beef)What is the SE of a Price Change?The change in q d that arises from a change in pricemaking the good (service) more or less expensiverelative to other goods (services), holding constantthe effect of the price change on consumer PP.■SE is always negative regardless of whether thegood is normal or inferiorReason: A fall in the P x (relative to P y ) willincrease q d of X, and conversely.Key Conclusions: IE & SETogether (Table 9-4, p. 280)●Normal goods: Both effects work together toraise (lower) q d when the pricefalls (rises) - - Law of Demand●Inferior goods: Both effects work against●Inferior goods: Both effects work againsteach other as follows:▪SE moves the q d in the opposite direction ofthe price change - - Law of Demand.▪IE moves it in the same direction as the price▪SE always dominates the IE, so the demandfor an inferior good also "will virtuallyalways obey the law of demand”
Where Does the Individual D-curve Come From?●It comes from the“The Utility Maximization Theory”which is the basis of the Law of Demandfrom which we derive the D-curve●Rationale is provided in figure 9-2,p. 282Deriving the D-Curve for Pizzafrom Utility Max’tion Theory9 – 2, p. 282●Panel a: At old P X = $2/slice, 3X is bought; At new P X = $1.50/slice, 4X is bought●Panel b: Joining the two coordinates result is a D-curveDeriving the D-Curve: AnAlternative ApproachNumber of 15Movies perMonth 10861. When the price of concerts is$30, point D is best for Max.DJK2. If the price falls to $10,Max's BL rotatesrightward/outward, andhe choose point J.More ApplicationsDo in class Problem #8, p. 295(on IE & SE)Price perConcert $301050 3 5 7 10 15 30DJK3. And if the price drops furtherto $5, he chooses point K.4. The D-curve for concerts:It shows the quantity Maxchooses at each price.3 7 10 Number of Concertsper MonthEND