1.2 Observational Study; Experiments, and Simple Random Sampling:
1.2 Observational Study; Experiments, and Simple Random Sampling:
1.2 Observational Study; Experiments, and Simple Random Sampling:
Create successful ePaper yourself
Turn your PDF publications into a flip-book with our unique Google optimized e-Paper software.
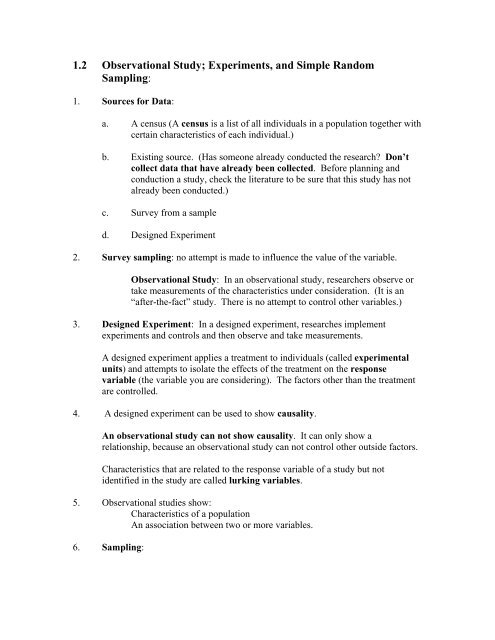
<strong>1.2</strong> <strong>Observational</strong> <strong>Study</strong>; <strong>Experiments</strong>, <strong>and</strong> <strong>Simple</strong> R<strong>and</strong>om<strong>Sampling</strong>:1. Sources for Data:a. A census (A census is a list of all individuals in a population together withcertain characteristics of each individual.)b. Existing source. (Has someone already conducted the research? Don’tcollect data that have already been collected. Before planning <strong>and</strong>conduction a study, check the literature to be sure that this study has notalready been conducted.)c. Survey from a sampled. Designed Experiment2. Survey sampling: no attempt is made to influence the value of the variable.<strong>Observational</strong> <strong>Study</strong>: In an observational study, researchers observe ortake measurements of the characteristics under consideration. (It is an“after-the-fact” study. There is no attempt to control other variables.)3. Designed Experiment: In a designed experiment, researches implementexperiments <strong>and</strong> controls <strong>and</strong> then observe <strong>and</strong> take measurements.A designed experiment applies a treatment to individuals (called experimentalunits) <strong>and</strong> attempts to isolate the effects of the treatment on the responsevariable (the variable you are considering). The factors other than the treatmentare controlled.4. A designed experiment can be used to show causality.An observational study can not show causality. It can only show arelationship, because an observational study can not control other outside factors.Characteristics that are related to the response variable of a study but notidentified in the study are called lurking variables.5. <strong>Observational</strong> studies show:Characteristics of a populationAn association between two or more variables.6. <strong>Sampling</strong>:
a. When conducting a sampling survey, the sample must be representative ofthe entire population. It must reflect, as closely as possible, the relevantcharacteristics of the entire population.b. A sample of size n from a population of size N is obtained throughsimple r<strong>and</strong>om sampling if every possible sample of size n has anequally likely chance of occurring. The sample is then called a simpler<strong>and</strong>om sample (or r<strong>and</strong>om sample). (n < N)c. A simple r<strong>and</strong>om sampling guarantees that the techniques of inferentialstatistics can be applied to the sample.d. There are two types of simple r<strong>and</strong>om sampling procedures, simpler<strong>and</strong>om sampling with replacement (a member of the population can beselected more that once) or simple r<strong>and</strong>om sampling withoutreplacement (a member of the population can be selected at most once.)(Unless stated otherwise, we will assume that the simple r<strong>and</strong>om samplingis conducted without replacement.)7. How do you determine which members of the population should be included inthe sample?a. To select the members in a simple r<strong>and</strong>om sample, we must use some sortto a r<strong>and</strong>om device, such as tossing a coin, pulling names out of a hat, orconsulting a r<strong>and</strong>om number table. (This helps prevent unintentionalselection bias.)b. Using a r<strong>and</strong>om number table to select a sample from a population:Number the individuals in the population. (A list of the individuals in apopulation is called a frame.) Note the number of digits in the largestnumber used in this numbering. (We will use this number of digits foreach number chosen from the r<strong>and</strong>om number table.)Pick a starting point: Close your eyes <strong>and</strong> put your finger on an arbitrarypoint on the table. Use the correct number of digits in the string of digitsunder your finger.Pick the first member of the sample: If the string of digits in the startingnumber is a number in your member list, then this individual will be amember of your sample. If it is not, use the string of digits directly belowyour first string.Continue choosing strings of digits working down <strong>and</strong> then back up thetable of numbers. Skip any sequence that is not in of the numbering ofyour population. Stop when the sample is the desired size.
5. Using a r<strong>and</strong>om number generator in the TI-83/84 calculator.The first time you use the r<strong>and</strong>om number generator, you want to put inthe starting point (or seed number) for the table. (You only need to do thisonce.) To do this, use a r<strong>and</strong>om number table. (Close your eyes <strong>and</strong> putyour finger on an arbitrary string of 5 digits in this table. This will be yourseed number. Enter the number you have selected. Press STO->,MATH, <strong>and</strong> arrow over to PRB. Press ENTER (for the comm<strong>and</strong>r<strong>and</strong>.) Press enter again. This sets the seed number.To form a set of r<strong>and</strong>om numbers: Press MATH, <strong>and</strong> arrow over toPRB. Press 5 or arrow to 5:r<strong>and</strong>int( . Then fill in three number.r<strong>and</strong>int( lowerbound, upperbound, number_of_members_in_the_sample)(See page 22.)
1.3 Other Effective <strong>Sampling</strong> Methods1. Stratified <strong>Sampling</strong>: Divide the population into sub-populations or strata. Allof the members in a stratum should have the same characteristics relative to thestudy.The members of the sample are chosen from each stratum in the same proportionas the stratum to the entire population. This will insure that each relevantcharacteristic of the population is fairly represented in the sample.Step 1: Divide the population into non-overlapping strata so that eachmember of a stratum has the same characteristics.Step 2: From each stratum, obtain a simple r<strong>and</strong>om sample. The size of(stratum size)this sample should be× (sample size).(population size)Step 3: Use all the members obtained from each stratum for the sample.2. Systematic R<strong>and</strong>om <strong>Sampling</strong>: This method is useful if a list of the population(frame) is not easily obtained. Use the r<strong>and</strong>om number table to pick only the firstnumber used in the sample. Then form the sample by selecting every k thindividual after the first.3. Cluster <strong>Sampling</strong>:Step 1: Determine the population size, N, if possible.Step 2: Determine the sample size, n.Step 3: Compute the number N/n <strong>and</strong> round the result down to thenearest whole number. This gives a number we will call k.Step 4: Use the r<strong>and</strong>om number table to pick a number between 1 <strong>and</strong> k.We will call this number p.Step 5: Form the sample using the members from the populationnumbered p, p + k, p + 2k, … to the number p + (n – 1)k.Note that if the size of the population is not known, the k must be chosenso that by choosing every k th member a sample of the desired sample sizewill be obtained.Step 1: Divide the population into groups or clusters.Step 2: Obtain a simple r<strong>and</strong>om sample of the clusters.Step 3: Sample all members in each selected cluster.
If the members of each cluster have similar characteristics, choose more clusterscontaining fewer individuals.If the members of each cluster have a variety of characteristics similar to thevariety of characteristics in the population, then fewer clusters are needed witheach cluster containing a larger number of individuals.4. Convenience <strong>Sampling</strong>: One example of a convenience sampling is a samplingin which the individuals self-select. That is the individuals in a sample choose tobe in the sample. (For example, a TV show that asks the viewers to phone in withtheir opinion on a topic.) Any conclusions draw from a study that was conductedusing convenience sampling is extremely suspect. The sample is probably notr<strong>and</strong>om or representative.5. Most large surveys are conducted using a combination of the sampling techniquesgiven here. This type of sampling is called a multistage sampling.


