temperature and pressure in the svartsengi ... - Orkustofnun
temperature and pressure in the svartsengi ... - Orkustofnun
temperature and pressure in the svartsengi ... - Orkustofnun
You also want an ePaper? Increase the reach of your titles
YUMPU automatically turns print PDFs into web optimized ePapers that Google loves.
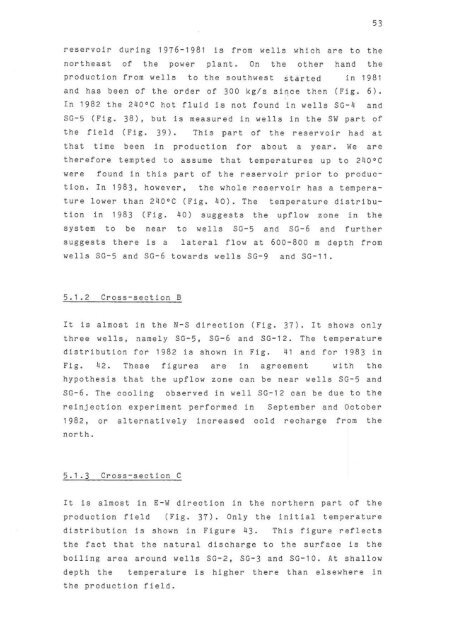
53reservoir dur<strong>in</strong>g 1976- 1981 Is from wells which are to <strong>the</strong>nor<strong>the</strong>ast of <strong>the</strong> power plant. On <strong>the</strong> o<strong>the</strong>r h<strong>and</strong> <strong>the</strong>production from wells to <strong>the</strong> southwest started <strong>in</strong> 1981<strong>and</strong> has been of <strong>the</strong> order of 300 kg/s sl~ce <strong>the</strong>n (Fig. 6).In 1982 <strong>the</strong> 240 0 c hot fluid Is not found In wells SG-lI <strong>and</strong>SC - 5 (Fig. 38), but is measured In wells <strong>in</strong> <strong>the</strong> SW part of<strong>the</strong> field (Fig. 39). This part of <strong>the</strong> reservoir had atthat time been I n production for about a year. We are<strong>the</strong>refore tempted to assume that <strong>temperature</strong>s up to 240°Cwere found In this part of <strong>the</strong> reservoir prior to production.In 1983. however, <strong>the</strong> whole reservoir has a tempera ture lower than 240°C (Fig. 40). The <strong>temperature</strong> distribution<strong>in</strong> 1983 (Fig. 110) suggests <strong>the</strong> upflow zone <strong>in</strong> <strong>the</strong>system to be near to wells SG-5 <strong>and</strong> SG-6 <strong>and</strong> fur<strong>the</strong>rsuggests <strong>the</strong>re is a lateral flow at 600-800 m depth fromwells SG - 5 <strong>and</strong> SG - 6 towards wells SG - 9 <strong>and</strong> SG - 11.5.1.2 Cross-section 8It is almost <strong>in</strong> <strong>the</strong> N- S direction (Fig. 37). It shows onlythree wells. namely SG-5. SG - 6 <strong>and</strong> SG-12. The <strong>temperature</strong>distribution for 1982 is shown <strong>in</strong> Fig. 41 <strong>and</strong> for 1983 <strong>in</strong>Fig. 42. These figures are <strong>in</strong> agreement with <strong>the</strong>hypo<strong>the</strong>sis that <strong>the</strong> upflow zone can be near wells SG - 5 <strong>and</strong>SG - 6. The cool<strong>in</strong>g observed <strong>in</strong> well SG - 12 can be due to <strong>the</strong>re<strong>in</strong>jection experiment performed <strong>in</strong> September <strong>and</strong> October1982, or alternatively <strong>in</strong>creased cold recharge from <strong>the</strong>north.5.1.3 Cross-section CIt is almost <strong>in</strong> E-W direction <strong>in</strong> <strong>the</strong> nor<strong>the</strong>rn part of <strong>the</strong>production field ( Fig. 37). Only <strong>the</strong> <strong>in</strong>itial <strong>temperature</strong>distribution is shown <strong>in</strong> Figure 43 . This figure reflects<strong>the</strong> fact that <strong>the</strong> natural discharge to <strong>the</strong> surface Is <strong>the</strong>boil<strong>in</strong>g area around wells SG-2, SG - 3 <strong>and</strong> SG-lO. At shallowdepth <strong>the</strong> <strong>temperature</strong> is higher <strong>the</strong>re than elsewhere In<strong>the</strong> production field.


