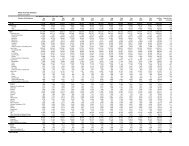
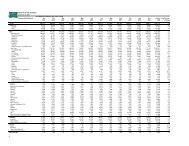
1. <strong>Tourism</strong> ReceiptsJANUARY TO DECEMBER <strong>2011</strong> PERFORMANCE 1 (PRELIMINARY)Preliminary <strong>Tourism</strong> Receipts (TR) for <strong>2011</strong> were estimated at S$22.2 billion, charting a newhigh, and meeting the year’s forecast range of S$22 – S$24 billion.All preliminary TR components saw year-on-year growth, with Sightseeing & Entertainmentrecording the highest growth of 37%.Chart 1: <strong>Tourism</strong> Receipts by Major Components, January-December <strong>2011</strong>1 Full year <strong>Tourism</strong> Receipts estimates are preliminary.
2. International Visitor ArrivalsJANUARY TO DECEMBER <strong>2011</strong> PERFORMANCEInternational Visitor Arrivals (IVA) for <strong>2011</strong> stood at 13.2 million, charting a new high andexceeding the year’s forecast range of 12 – 13 million.1,400,000International Visitor Arrivals, January to December <strong>2011</strong>Jan-Dec <strong>2011</strong>: 13.2 million (+13% vs Jan-Dec 2010)1,200,0001,000,000IVA800,000600,000400,000200,000-JAN FEB MAR APR MAY JUN JUL AUG SEP OCT NOV DECSource: Disembarkation/Embarkation cardsChart 2: International Visitor Arrivals, January-December <strong>2011</strong>Indonesia (2,592,000), P R China (1,577,000), Malaysia (1,141,000), Australia (956,000) andIndia (869,000) were <strong>Singapore</strong>'s top five international visitor-generating markets for <strong>2011</strong> 2 .76% of total IVA came from Asia (includes Southeast Asia, North Asia, South Asia and West Asiaand excludes Oceania). IVA from Europe saw a 2% growth despite a 4% drop in IVA from theUnited Kingdom.International Visitor Arrivals, Top 15 Markets, January to December <strong>2011</strong>% Chg vs. 10 Jan-Dec <strong>2011</strong>: 13.2 million (+13% vs Jan-Dec 2010)+12 Indonesia2,592+35 P R China1,577+10 Malaysia1,141+9 Australia956+5India869+24 Philippines678+24Japan656+10 Thailand473+20 Hong Kong SAR464-4UK443+6USA441+15 South Korea415+3 Vietnam332+25 Taiwan 238+5 Germany 220'000s0 500 1000 1500 2000 2500 3000Source: Disembarkation/Embarkation cardsChart 3: International Visitor Arrivals, Top 15 Markets, January-December<strong>2011</strong>2Statistics on top international visitor-generating markets for <strong>2011</strong> can be found here: https://app.stb.gov.sg/asp/tou/tou0201.asp