Tourism Sector Performance For 2011 - Singapore Tourism Board
Tourism Sector Performance For 2011 - Singapore Tourism Board
Tourism Sector Performance For 2011 - Singapore Tourism Board

Create successful ePaper yourself
Turn your PDF publications into a flip-book with our unique Google optimized e-Paper software.
7/2/2012TOURISM SECTOR PERFORMANCE FOR <strong>2011</strong>FACTSHEETHIGHLIGHTS1. <strong>Tourism</strong> Receipts• Preliminary <strong>Tourism</strong> Receipts (TR) for <strong>2011</strong> were estimated at S$22.2 billion.• All preliminary TR components saw year-on-year growth.2. International Visitor Arrivals• International Visitor Arrivals (IVA) for <strong>2011</strong> stood at 13.2 million.• 76% of total IVA came from Asia3. Hotel Industry• Gazetted hotel room revenue for <strong>2011</strong> came in at an estimated S$2.6 billion,representing a 27.8% year-on-year growth.• Robust performance in Average Room Rate (ARR) and Average Occupancy Rate(AOR) resulted in a 15% year-on-year growth in Revenue Per Available Room(RevPAR).Note to Editors:This fact sheet provides a summary of key statistics on tourism receipts, international visitorarrivals and gazetted hotels. The analysis in this fact sheet is based on data from a variety ofsources, including Disembarkation/Embarkation cards, the Overseas Visitors Survey (OVS) andthe monthly hotel returns from gazetted hotels. Data derived from the OVS are subject tosampling error. Users are advised to exercise discretion when drawing any conclusions orinferences, or taking any action, based on the data.A downloadable version of this report is also available at:http://app.stb.gov.sg/asp/new/new02a.asp?id=3Monthly International Visitor Arrival and Hotel statistics are available at:https://app.stb.gov.sg/asp/tou/tou02.asp#VS
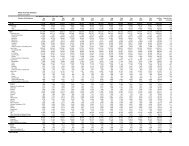
1. <strong>Tourism</strong> ReceiptsJANUARY TO DECEMBER <strong>2011</strong> PERFORMANCE 1 (PRELIMINARY)Preliminary <strong>Tourism</strong> Receipts (TR) for <strong>2011</strong> were estimated at S$22.2 billion, charting a newhigh, and meeting the year’s forecast range of S$22 – S$24 billion.All preliminary TR components saw year-on-year growth, with Sightseeing & Entertainmentrecording the highest growth of 37%.Chart 1: <strong>Tourism</strong> Receipts by Major Components, January-December <strong>2011</strong>1 Full year <strong>Tourism</strong> Receipts estimates are preliminary.
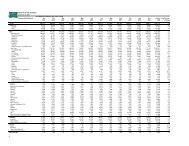
2. International Visitor ArrivalsJANUARY TO DECEMBER <strong>2011</strong> PERFORMANCEInternational Visitor Arrivals (IVA) for <strong>2011</strong> stood at 13.2 million, charting a new high andexceeding the year’s forecast range of 12 – 13 million.1,400,000International Visitor Arrivals, January to December <strong>2011</strong>Jan-Dec <strong>2011</strong>: 13.2 million (+13% vs Jan-Dec 2010)1,200,0001,000,000IVA800,000600,000400,000200,000-JAN FEB MAR APR MAY JUN JUL AUG SEP OCT NOV DECSource: Disembarkation/Embarkation cardsChart 2: International Visitor Arrivals, January-December <strong>2011</strong>Indonesia (2,592,000), P R China (1,577,000), Malaysia (1,141,000), Australia (956,000) andIndia (869,000) were <strong>Singapore</strong>'s top five international visitor-generating markets for <strong>2011</strong> 2 .76% of total IVA came from Asia (includes Southeast Asia, North Asia, South Asia and West Asiaand excludes Oceania). IVA from Europe saw a 2% growth despite a 4% drop in IVA from theUnited Kingdom.International Visitor Arrivals, Top 15 Markets, January to December <strong>2011</strong>% Chg vs. 10 Jan-Dec <strong>2011</strong>: 13.2 million (+13% vs Jan-Dec 2010)+12 Indonesia2,592+35 P R China1,577+10 Malaysia1,141+9 Australia956+5India869+24 Philippines678+24Japan656+10 Thailand473+20 Hong Kong SAR464-4UK443+6USA441+15 South Korea415+3 Vietnam332+25 Taiwan 238+5 Germany 220'000s0 500 1000 1500 2000 2500 3000Source: Disembarkation/Embarkation cardsChart 3: International Visitor Arrivals, Top 15 Markets, January-December<strong>2011</strong>2Statistics on top international visitor-generating markets for <strong>2011</strong> can be found here: https://app.stb.gov.sg/asp/tou/tou0201.asp
3. Hotel IndustryJANUARY TO DECEMBER <strong>2011</strong> PERFORMANCEGazetted hotel room revenue for <strong>2011</strong> came in at an estimated S$2.6 billion, representing a27.8% year-on-year growth.Average Room Rate (ARR 3 ) stood at S$245 in <strong>2011</strong>, a year-on-year increase of 13%. Room ratesfor all hotel tiers increased, with the Upscale tier posting the highest growth rate at 14%.Average Occupancy Rate (AOR 4 ) reached 86% in <strong>2011</strong>.Robust performance in ARR and AOR resulted in a 15% growth in Revenue Per Available Room(RevPAR 5 ), which stood at S$212 in <strong>2011</strong>. The Upscale tier was the top performer in terms ofRevPAR growth.Note:January – December <strong>2011</strong>ARR AOR RevPAR$ %∆ % %∆ $ %∆OVERALL 245 13% 86 +1% pt 212 15%LUXURY 397 12% 80 +2% pt 319 14%UPSCALE 278 14% 88 +2% pt 244 16%MID-TIER 187 11% 87 - 164 11%ECONOMY 109 9% 85 -1% pt 93 7%Table 1: ARR, AOR and RevPAR, <strong>2011</strong>The hotel tiering system is a reference system developed by the <strong>Singapore</strong> <strong>Tourism</strong> <strong>Board</strong> (STB) to categorise thedifferent hotels in <strong>Singapore</strong> into tiers based on a combination of factors that include average room rates, locationand product characteristics.Figures for the hotel industry are preliminary estimates, based on returns as at 26 November <strong>2011</strong>. The currenthotel tiers published are based on the hotels’ performance in 2010. The response rate across the tiers may vary.Luxury - Includes hotels in the luxury segment and are predominantly in prime locations and/or in historicalbuildingsUpscale - Includes hotels in the upscale segment and are generally in prime locations or hotels with boutiquepositioning in prime or distinctive locationsMid-Tier - Includes hotels in the mid-tier segment and are primarily located in prime commercial zones orimmediately outlying areasEconomy - Includes hotels in the budget segment and are generally located in outlying areas3 Standard AOR = [Gross lettings (Room Nights) / Available room nights] x 1004 Standard AOR = [Gross lettings (Room Nights) / Available room nights] x 1005 RevPAR = AOR x ARR
<strong>For</strong> more information, please contact:Siti Nurhidayati (Ms)Communications Division<strong>Singapore</strong> <strong>Tourism</strong> <strong>Board</strong>Tel: +65 6831 3416Email: siti_nurhidayati@stb.gov.sgOr the STB Media Hotline at +65 9011 2071