Youth Employment Programs - Independent Evaluation Group
Youth Employment Programs - Independent Evaluation Group Youth Employment Programs - Independent Evaluation Group
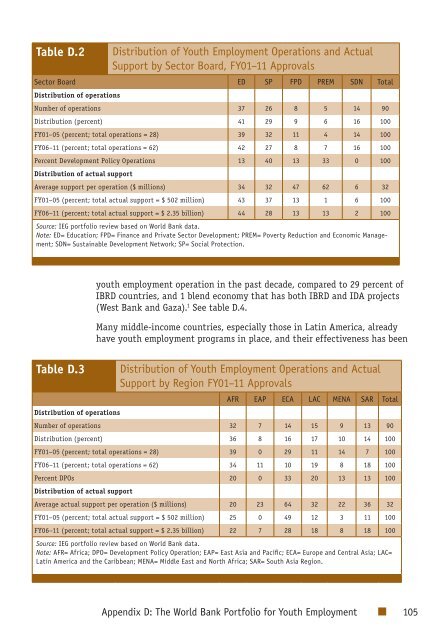
The number of projects and total lending for youth employment increasedover time (figure D.1).Most lending is managed by the Human Development Network (HDN), 73percent), which implements 63 operations (70 percent). The SustainableDevelopment Network (SDN) follows with 14 operations (3 percent of totallending), and Finance and Private Sector Development (FPD) with 8 operationsaccounting for 13 percent of total lending. More recently, 5 PREM operationsalso started to incorporate youth employment, reflecting 11 percent of totalyouth employment lending (figure D.1 and table D.2).Most youth employment projects are in Africa, and most lending wentto Europe and Central Asia (ECA). Africa had more than one-third of theprojects. The ECA Region leads slightly with 31 percent of lending, followedby Africa with 23 percent of total lending (figure D.3). The average youthemployment loan commitment ranges from $20 million in Africa to $64million in ECA (table D.3 and figure D. 3).Who is Borrowing for Youth Employment Programs?IDA countries are more likely to borrow for youth employment. AlthoughIBRD countries received 61 percent of total youth employment lending,IDA countries are more likely to receive Bank support to promote youthemployment. More than half of IDA countries (59 percent) report at least oneFigure D.1Actual ($ million)700600500400300200100Trends in World Bank Commitments for Youth EmploymentProjects (US$ millions) by Network and Fiscal Year of Approval1412108642Operations (number)02001 2002 2003 2004 2005 2006 2007 2008 2009 2010 2011Fiscal year of approvalFPD HDN PREM SDN Number of operations0Source: IEG portfolio review based on World Bank data.Note: FPD= Finance and Private Sector Development: HDN= Human Development Network; PREM= PovertyReduction and Economic Management; SDN=Sustainable Development Network.104 Youth Employment Programs
Table D.2Distribution of Youth Employment Operations and ActualSupport by Sector Board, FY01–11 ApprovalsSector Board ED SP FPD PREM SDN TotalDistribution of operationsNumber of operations 37 26 8 5 14 90Distribution (percent) 41 29 9 6 16 100FY01–05 (percent; total operations = 28) 39 32 11 4 14 100FY06–11 (percent; total operations = 62) 42 27 8 7 16 100Percent Development Policy Operations 13 40 13 33 0 100Distribution of actual supportAverage support per operation ($ millions) 34 32 47 62 6 32FY01–05 (percent; total actual support = $ 502 million) 43 37 13 1 6 100FY06–11 (percent; total actual support = $ 2.35 billion) 44 28 13 13 2 100Source: IEG portfolio review based on World Bank data.Note: ED= Education; FPD= Finance and Private Sector Development; PREM= Poverty Reduction and Economic Management;SDN= Sustainable Development Network; SP= Social Protection.youth employment operation in the past decade, compared to 29 percent ofIBRD countries, and 1 blend economy that has both IBRD and IDA projects(West Bank and Gaza). 1 See table D.4.Many middle-income countries, especially those in Latin America, alreadyhave youth employment programs in place, and their effectiveness has beenTable D.3Distribution of Youth Employment Operations and ActualSupport by Region FY01–11 ApprovalsAFR EAP ECA LAC MENA SAR TotalDistribution of operationsNumber of operations 32 7 14 15 9 13 90Distribution (percent) 36 8 16 17 10 14 100FY01–05 (percent; total operations = 28) 39 0 29 11 14 7 100FY06–11 (percent; total operations = 62) 34 11 10 19 8 18 100Percent DPOs 20 0 33 20 13 13 100Distribution of actual supportAverage actual support per operation ($ millions) 20 23 64 32 22 36 32FY01–05 (percent; total actual support = $ 502 million) 25 0 49 12 3 11 100FY06–11 (percent; total actual support = $ 2.35 billion) 22 7 28 18 8 18 100Source: IEG portfolio review based on World Bank data.Note: AFR= Africa; DPO= Development Policy Operation; EAP= East Asia and Pacific; ECA= Europe and Central Asia; LAC=Latin America and the Caribbean; MENA= Middle East and North Africa; SAR= South Asia Region.Appendix D: The World Bank Portfolio for Youth Employment 105
- Page 89: farm self-employment and employment
- Page 92 and 93: This appendix presents the factors
- Page 94 and 95: Organization for Standardization (I
- Page 96 and 97: Box A.3Youth as a Demographic Divid
- Page 98 and 99: Table A.1Types of Youth Employment
- Page 100 and 101: Notes1. This phenomenon could be le
- Page 103 and 104: Appendix BEvaluation Data Sources a
- Page 105 and 106: Identification and Analysis of the
- Page 107 and 108: • Making the labor market work be
- Page 109 and 110: Table B.3ApprovalFYList of Projects
- Page 111 and 112: Table B.3ApprovalFYList of Projects
- Page 113 and 114: Table B.4(I)nvestmentClimate(L)abor
- Page 115 and 116: Table B.6List of Economic Sector Wo
- Page 117 and 118: ment, Private Sector Development, a
- Page 119 and 120: Other evaluations with outcome meas
- Page 121 and 122: Table B.8CountryFranceKenyaMexicoPa
- Page 123 and 124: Table B.8CountryUnitedStatesYouth E
- Page 125 and 126: Table B.8CountryEuropeancountriesLa
- Page 127 and 128: Bidani, Benu, Niels-Hugo Blunch, Ch
- Page 129: Training Replication Sites.” Manp
- Page 132 and 133: Appendix C provides additional info
- Page 134 and 135: Box C.2Global Partnership for Youth
- Page 136 and 137: ReferencesAedo, Cristian, and Ian W
- Page 138 and 139: This appendix provides additional i
- Page 142 and 143: Figure D.2World Bank Youth Employme
- Page 144 and 145: Table D.5Intervention categoryYouth
- Page 146 and 147: Table D.7Prevalence of Project Obje
- Page 148 and 149: Table D.9Target Groups of Project O
- Page 150 and 151: Table D.11Type of Interventions Sup
- Page 152 and 153: Table D.13 Frequently Used Youth Em
- Page 154 and 155: In sum, this portfolio review chapt
- Page 156 and 157: approach in Turkey and Sierra Leone
- Page 158 and 159: This appendix presents a detailed a
- Page 160 and 161: to Finance business line, over a si
- Page 162 and 163: entrepreneurship projects. Investme
- Page 164 and 165: IFC has three types of investments
- Page 166 and 167: Box E.1Africa Schools ProgramIFC su
- Page 168 and 169: Box E.2e4e Initiative for Arab Yout
- Page 170 and 171: 3. IFC’s Advisory Services corpor
- Page 172 and 173: This appendix presents lessons for
- Page 174 and 175: Labor Market RegulationsLabor marke
- Page 176 and 177: to the definition of unemployment b
- Page 178 and 179: In post-conflict zones with small f
- Page 180 and 181: Public works programs in Bank proje
- Page 182 and 183: marginal impact of school-to-work t
- Page 184 and 185: of the program. However, results fo
- Page 186 and 187: • Weak results frameworks on the
- Page 188 and 189: sustainability. Zambia’s TEVET pr
Table D.2Distribution of <strong>Youth</strong> <strong>Employment</strong> Operations and ActualSupport by Sector Board, FY01–11 ApprovalsSector Board ED SP FPD PREM SDN TotalDistribution of operationsNumber of operations 37 26 8 5 14 90Distribution (percent) 41 29 9 6 16 100FY01–05 (percent; total operations = 28) 39 32 11 4 14 100FY06–11 (percent; total operations = 62) 42 27 8 7 16 100Percent Development Policy Operations 13 40 13 33 0 100Distribution of actual supportAverage support per operation ($ millions) 34 32 47 62 6 32FY01–05 (percent; total actual support = $ 502 million) 43 37 13 1 6 100FY06–11 (percent; total actual support = $ 2.35 billion) 44 28 13 13 2 100Source: IEG portfolio review based on World Bank data.Note: ED= Education; FPD= Finance and Private Sector Development; PREM= Poverty Reduction and Economic Management;SDN= Sustainable Development Network; SP= Social Protection.youth employment operation in the past decade, compared to 29 percent ofIBRD countries, and 1 blend economy that has both IBRD and IDA projects(West Bank and Gaza). 1 See table D.4.Many middle-income countries, especially those in Latin America, alreadyhave youth employment programs in place, and their effectiveness has beenTable D.3Distribution of <strong>Youth</strong> <strong>Employment</strong> Operations and ActualSupport by Region FY01–11 ApprovalsAFR EAP ECA LAC MENA SAR TotalDistribution of operationsNumber of operations 32 7 14 15 9 13 90Distribution (percent) 36 8 16 17 10 14 100FY01–05 (percent; total operations = 28) 39 0 29 11 14 7 100FY06–11 (percent; total operations = 62) 34 11 10 19 8 18 100Percent DPOs 20 0 33 20 13 13 100Distribution of actual supportAverage actual support per operation ($ millions) 20 23 64 32 22 36 32FY01–05 (percent; total actual support = $ 502 million) 25 0 49 12 3 11 100FY06–11 (percent; total actual support = $ 2.35 billion) 22 7 28 18 8 18 100Source: IEG portfolio review based on World Bank data.Note: AFR= Africa; DPO= Development Policy Operation; EAP= East Asia and Pacific; ECA= Europe and Central Asia; LAC=Latin America and the Caribbean; MENA= Middle East and North Africa; SAR= South Asia Region.Appendix D: The World Bank Portfolio for <strong>Youth</strong> <strong>Employment</strong> 105


