THIV ASI
THIV ASI
THIV ASI

You also want an ePaper? Increase the reach of your titles
YUMPU automatically turns print PDFs into web optimized ePapers that Google loves.
Robust:“Road Upgrade of Standards”GRD1-2002-70021Testing procedures and severityindices evaluation.Marco AnghileriDipartimento di Ingegneria AerospazialePolitecnico di MilanoItaly
Contribution.Robust. GRD1-2002-700211. Statistical analysis of alreadyperformed tests.2. Severity indices definition.3. Data acquisition and severity indicesevaluation.34. Instrumentation mounting.3 /77 Bruxelles 30/05/2006
Statistical analysis of alreadyperformed tests.Robust. GRD1-2002-70021• Analysis of existing data obtained formEuropean laboratories to investigatepossible correlation between severityindices.4• Analysis of existing data obtained formEuropean laboratories to investigatedifferences between tests houses4 /77 Bruxelles 30/05/2006
Data base.Robust. GRD1-2002-70021• From European laboratories a set of 174 data ofTB11 full scale crash tests have been obtainedcontaining the following information:– year of test– vehicle make– vehicle test mass– data sample rate– actual speed and angle– barrier dynamic deflection5– <strong>ASI</strong>– <strong>THIV</strong>/PHD• Data were received from 7 Laboratories. Of 174TB11 tests, 111 were successful and 63unsuccessful. Some tests have been receivedwithout PHD data.5 /77 Bruxelles 30/05/2006
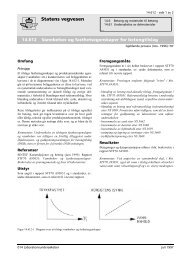
<strong>THIV</strong>-<strong>ASI</strong>Correlation <strong>THIV</strong>- <strong>ASI</strong> (All data except singular points)50.0045.0040.00y = 25.033x 0.4983R 2 = 0.745135.0030.00<strong>THIV</strong>/<strong>ASI</strong>-ReRobust. GRD1-2002-70021<strong>THIV</strong>25.0020.0015.0010.005.000.0060 0.5 1 1.5 2 2.5<strong>ASI</strong>• This graph shows a fair correlation between<strong>ASI</strong> and <strong>THIV</strong> indices. Correlation factor of0.7451<strong>THIV</strong>=25.033<strong>ASI</strong>0.4989Pow er (<strong>THIV</strong>/<strong>ASI</strong>-Re)6 /77 Bruxelles 30/05/2006
Thiv-Asi different labs.Correlation <strong>THIV</strong>/<strong>ASI</strong>LabALLCorr. functiony = 25.0 <strong>ASI</strong>^0.498370.0060.001y = 26.9 <strong>ASI</strong>^0.430550.00Robust. GRD1-2002-70021<strong>THIV</strong>40.0030.0020.0010.000.000.00 0.50 1.00 1.50 2.00 2.50 3.00<strong>ASI</strong>7Lab1Lab 2Lab 3Lab 4Lab 52345y = 24.0 <strong>ASI</strong>^0.3305y = 24.8 <strong>ASI</strong>^0.545y = 25.1 <strong>ASI</strong>^0.5596y = 23.6 <strong>ASI</strong>^0.48997 /77 Bruxelles 30/05/2006
<strong>THIV</strong>-PHD PHD-<strong>ASI</strong><strong>THIV</strong>-PHD correlation<strong>THIV</strong> [km/h]50.0045.0040.0035.0030.0025.0020.0015.0010.005.000.000.00 10.00 20.00 30.00 40.00 50.00 60.00 70.00PHD [g]Robust. GRD1-2002-70021<strong>ASI</strong>32.521.510.5PHD-<strong>ASI</strong> correlation00.00 10.00 20.00 30.00 40.00 50.00 60.00 70.00PHD [g]8 /77 Bruxelles 30/05/20068• no correlationbetween PHDand <strong>THIV</strong> or <strong>ASI</strong>
<strong>ASI</strong>-DD <strong>THIV</strong>-DD PHD-DD<strong>ASI</strong>-dynamic deflectionPHD - Dynamic deflection<strong>ASI</strong><strong>THIV</strong>2.001.601.200.800.40Robust. GRD1-2002-700210.000.00 0.50 1.00 1.50 2.0045.0040.0035.0030.0025.0020.0015.0010.005.00Dynamic deflexion<strong>THIV</strong> - Dyn. deflexion0.000.00 0.50 1.00 1.50 2.009 /77 Bruxelles 30/05/2006Dynamic deflexion9<strong>ASI</strong>-DDEspo. (<strong>ASI</strong>-DD)y = 1.4448e 0.683x-R 2 0.5653 =<strong>THIV</strong>-DDEspo. (<strong>THIV</strong>-DD)y = 30.631e 0.3764x-R 2 0.5591 =PHD35.0030.0025.0020.0015.0010.005.000.000.00 0.50 1.00 1.50 2.00Dynamic deflexion• PHD: nocorrelation.• <strong>THIV</strong>-DD <strong>ASI</strong>_DD:weak correlationsPHD-DDEspo. (PHD-DD)y = 16.719e 0.6093x-R 2 0.2336 =
ASi<strong>ASI</strong>-dynamic deflection3.002.50Lab 12.00Lab 21.50Lab 3Lab 41.00Lab 5Robust. GRD1-2002-70021<strong>THIV</strong> [km/h]0.500.0070.0060.0050.0040.0030.0020.0010.000.000.00 0.50 1.00 1.50 2.00Dynamic deflection [m]<strong>THIV</strong>-dynamic deflection100.00 0.50 1.00 1.50 2.0010 /77 Bruxelles 30/05/2006Dynamic deflection [m]Different LabsLab 1Lab 2Lab 3Lab 4Lab 5LabAll12345LabAll12345Corr. Functiony = 1.4448e-0.683xy = 1.2829e-0.5836xy = 1.4973e-0.6099xy = 1.3841e-0.6902xy = 1.6442e-0.9867xy = 1.4716e-0.8779xCorr. Functiony = 30.631e-0.3764xy = 32.827e-0.5464xy = 32.141e-0.4018xy = 27.476e-0.2846xy = 29.923e-0.4634xy = 27.801e-0.3747x
Results of statistical analysis.Robust. GRD1-2002-70021• These results show that there is a limitedcorrelation between severity indices.• Reason: from the scientific point of view, <strong>ASI</strong>, <strong>THIV</strong>and PHD are different things.• The main differences between these severityindices are:– <strong>ASI</strong> is using three components of acceleration while <strong>THIV</strong>-PHD use a planar motion where the z accelerationcomponent is not used.11– <strong>THIV</strong> – PHD use a critical time that corresponds to thetime where the theoretical head impact against theconventional box representing the vehicle interior.– <strong>THIV</strong> is affected also by the yaw motion while <strong>ASI</strong> doesnot take into account this measure into account.• Test houses have similar tendencies.11 /77 Bruxelles 30/05/2006
Severity indices definition.• EN 1317 requires, to evaluate barrierperformance, to measure the followingseverity indices:Robust. GRD1-2002-7002112<strong>ASI</strong><strong>THIV</strong> / (PHD)• Based on acceleration measured duringthe certification test on the vehicle CG.12 /77 Bruxelles 30/05/2006
<strong>ASI</strong>. Acceleration Severity IndexRobust. GRD1-2002-70021– “The index <strong>ASI</strong> is intended to give ameasure of the severity of the vehiclemotion for a person seated in the proximityof point P (CG) during an impact.”–Steps:• Measure three acceleration components ofvehicle CG according with CFC180.• Apply a 50 ms moving average on these13acceleration.• Evaluate Asi as:22 2⎛ a ⎞ ⎛ a ⎞xy⎛ a ⎞z<strong>ASI</strong>()t = ⎜ ⎟ + +a ⎜ xlim a ⎟ ⎜ ⎟⎝ ⎠ ⎝ ylim ⎠ ⎝azlim⎠13 /77 Bruxelles 30/05/2006
<strong>ASI</strong>. Acceleration Severity Index.Robust. GRD1-2002-70021• Where: axlim = 12 g aylim = 9 g azlim= 10g– “Are obtained from the human body tolerances limits.”• <strong>ASI</strong> is the maximum value of <strong>ASI</strong>(t).• “The average in equation (of <strong>ASI</strong>) is actually alow pass filter, taking into account the fact thatvehicle accelerations can be transmitted to theoccupant body through relatively soft contacts,which cannot pass the highest frequencies.”• The equation 14(of <strong>ASI</strong>) is the simplest possibleinteraction equation of three variables x, y and z.• The limit accelerations are interpreted as thevalues below which passenger risk is very small(light injures if any).”14 /77 Bruxelles 30/05/2006
Moving averageRobust. GRD1-2002-70021• Asi and Phd evaluation requires movingaverage techniques:– <strong>ASI</strong> 50ms– PHD 10ms (NCHRP-350 ORA 10 ms)– The original idea was to have a window toobserve the acceleration time histories.• Questions:15– Is moving average a true filter?– Can moving average give wronginformation?15 /77 Bruxelles 30/05/2006
FilteringRobust. GRD1-2002-70021• Signal processing (analog, digital ormechanical) to:– Eliminate noise or oscillation– Amplify frequencies– Avoid problems (example: aliasing)16• Attenuation:Input signalDbFilter⎛Out⎞= 20log 10 ⎜ ⎟⎝ In ⎠Output signal16 /77 Bruxelles 30/05/2006
Typical low-pass filter frequencyresponse0-5 0-100F iltro B utte rw o rth• -20 db meansOutput=0.1* InputRobust. GRD1-2002-70021Ampiezza [Db]-150-200-250-300-350-40010 0 10 1 17 10 2 10 3 10 4fre q [H z]• The moving average is a filter in the sense thatit modifies the original signal.17 /77 Bruxelles 30/05/2006
50 ms moving average – standardfiltering gain.• Gain=output/input0.8Robust. GRD1-2002-7002110.90.70.60.50.40.30.20.1-0.2-0.3moving average over 50 ms180-0.1 0 50 100 150 200frequency [Hz]Gain1Butterworth filter0.90.80.70.60.50.40.30.20.10 20 40 60 80 100freq [Hz]18 /77 Bruxelles 30/05/2006
50 ms moving average – standardfiltering attenuation.• Comparison with a CFC shaped filter10050Moving average0-50Moving averageFilterRobust. GRD1-2002-70021Amplitude [Db]0-50-100-150-200-250-30019-3500 20 40 60 80 100freq [Hz]Amplitude [Db]-100-150-200-250-300-35010 0 10 1 10 2 10 3 10 4freq [Hz]19 /77 Bruxelles 30/05/2006
Moving average does notpreserve energy.• Velocity evaluation with:– Original signal– Filtered signal (Butterworth)– Moving AveragevelocityRobust. GRD1-2002-7002110.50-0.5-1-1.5Velocity evaluation20-20 0.2 0.4 0.6 0.8 1time20 /77 Bruxelles 30/05/2006Moving averageOriginal signalFiltered signalvelocity0.60.40.20-0.2-0.4-0.6-0.8-1-1.2Velocity evaluationMoving averageOriginal signalFiltered signal-1.40 0.2 0.4 0.6 0.8 1 1.2 1.4time
Moving average sensitivity to noise.Robust. GRD1-2002-70021• Different acceleration noises:• Constant amplitude acceleration for differentfrequencies.• Constant energy (same velocity), theamplitude is modified with frequencies.– How these noises are seen by the moving21average and a “correct” filter.• “Correct” = equivalent filter:– 10 hz two poles Butterworth “forwardbackward”(four total poles) to avoid time shift.21 /77 Bruxelles 30/05/2006
Noise influence on <strong>ASI</strong> with movingaverageRobust. GRD1-2002-700212222 /77 Bruxelles 30/05/2006
Is this a real problem?Robust. GRD1-2002-70021• To verify the presence of this problem:– Test cases obtained from some standardcrash tests.• For each test case:– Acceleration time-history.– Frequency spectrum.23– Evaluation of <strong>ASI</strong> with moving average.– Evaluation of <strong>ASI</strong> with “correct” filter.23 /77 Bruxelles 30/05/2006
Example.30TEST 3: accelerazione X20TEST 3: accelerazione Y15TEST 3: accelerazione Z2015101010055g-10g0g0-20-5-5-30Robust. GRD1-2002-70021-40-500 0.2 0.4 0.6 0.8 1time [s]600050004000300020001000Spettro TEST 3: accelerazione X00 50 100 150 200-10-15700024600050004000300020001000-200 0.2 0.4 0.6 0.8 1time [s]Spettro TEST 3: accelerazione Y00 50 100 150 200 250 300-10-150 0.2 0.4 0.6 0.8 1time [s]7000600050004000300020001000Spettro TEST 3: accelerazione X00 50 100 150 200 250 30024 /77 Bruxelles 30/05/2006
20TEST 3:Confronto tra media mobile e filtraggio. Componente XMedia mobileFiltro-2-4g-6-8-10-1232.52TEST 3:Confronto tra media mobile e filtraggio. Componente ZMedia mobileFiltro-141.5-160 0.2 0.4 0.6 0.8 1time [s]Robust. GRD1-2002-70021g2.521.510.50-0.5-1-1.5TEST 3:Confronto tra media mobile e filtraggio. Componente YMedia mobileFiltro25-20 0.2 0.4 0.6 0.8 125 /77 time Bruxelles [s] 30/05/2006g10.50-0.5-1-1.50 0.2 0.4 0.6 0.8 1time [s]
Moving averageRobust. GRD1-2002-70021• The modification of original signalsdriven by the moving average has beendemonstrated but:• Is this strange behavior of movingaverage desired by the original designerof <strong>ASI</strong>?26• Or was simply not observed?26 /77 Bruxelles 30/05/2006
History of <strong>ASI</strong>.• I.Laker: “ A short summary of threevehicle Impact Severity Measure- <strong>ASI</strong><strong>THIV</strong>/PHD NCHRP 230” 1991.Robust. GRD1-2002-700212727 /77 Bruxelles 30/05/2006
<strong>ASI</strong> HistoryRobust. GRD1-2002-7002129• 1955 Stapptests.• 1969 Limits in3 direction• 1971 movingaverage.• 1972EllipsoidalEnvelope fromUS Air forcedocuments29 /77 Bruxelles 30/05/2006
Acceleration time histories.Robust. GRD1-2002-70021– Aeronautical deceleration:• Source: Us Army “AircraftCrash Survival DesignGuide”.• Single peak: from 15 to 30 g• Time duration from 0.1 to0.15 s30– Safety barrier deceleration.g1050-5-10TEST 1: accelerazione X30 /77 Bruxelles 30/05/2006-150 0.2 0.4 0.6 0.8 1time [s]
<strong>ASI</strong> HistoryRobust. GRD1-2002-70021• The origin of <strong>ASI</strong> calculation procedure was based onresearch on the injury assessment of vehicle andaircraft occupants in phenomena such as re-entryspace capsule impacts and combat airplane maneuvers.• These phenomena have limited or no oscillationsthroughout the event.• For this reason, computing an average over a period of50 ms was used to obtain an average value to becompared with the tolerable limits.• Impacts against 31road restraint systems generally have aduration much greater than 50 milliseconds, and showstrong oscillations at different frequencies.• The 50 ms moving average when applied over suchlonger acceleration pulses becomes a low-pass filter,but it does not behave like filters used conventionallyfor crash analysis.31 /77 Bruxelles 30/05/2006
<strong>ASI</strong> modification.Robust. GRD1-2002-70021• To avoid the problem related to themoving average a standard filteringtechnique should be used.• Which filter?32• Which cut off frequency?32 /77 Bruxelles 30/05/2006
Robust. GRD1-2002-70021<strong>ASI</strong>Asi modification with different“correct” filtering cut off frequency.Test 321.81.61.41.210.80.60.40.2Influence of different cut off filtering on Test 4 modified <strong>ASI</strong>.33Original <strong>ASI</strong>Modified <strong>ASI</strong>00 5 10 15 20 25 30frequency [hz]hzModified <strong>ASI</strong>10.0 1.091515.0 1.200920.0 1.218125.0 1.270530.0 1.387633 /77 Bruxelles 30/05/2006
Modification of <strong>ASI</strong> formulation.Robust. GRD1-2002-70021• 126 tests analyzed– 65 from Autostrade– 17 from Lier– 20 from TRL– 16 from Italian producers– 8 from Round Robin34• Evaluation of <strong>ASI</strong> using filtering insteadof moving average.34 /77 Bruxelles 30/05/2006
Filtered <strong>ASI</strong>Robust. GRD1-2002-70021• Raw data have been filtered with CFC180 anda new <strong>ASI</strong> technique has been appliedavoiding moving average and using:• 2 poles Butterworth forward – backward (toavoid time shift) filter. 4 total poles.• Cut off frequencies tested:10 –12–14–16–18–20 hz35• The final cut off frequency has been identifiedas the one with the better correlation with thestandard <strong>ASI</strong> formula. The idea is to avoid, ifpossible, modification of the current limits forthe <strong>ASI</strong> formula.35 /77 Bruxelles 30/05/2006
Filtered <strong>ASI</strong> results<strong>ASI</strong> filteredRobust. GRD1-2002-700212.22.12.01.91.81.71.61.51.41.31.21.1361.00.90.80.70.60.6 0.7 0.8 0.9 1.0 1.1 1.2 1.3 1.4 1.5 1.6 1.7 1.8 1.9 2.0 2.1 2.2<strong>ASI</strong> standardasi10 Hz12 hz14 hz16 hz18 hz20 hzLineare (asi)Lineare (18 hz)Lineare (20 hz)Lineare (14 hz)Lineare (12 hz)Lineare (10 Hz)Lineare (16 hz)36 /77 Bruxelles 30/05/2006
Filtered <strong>ASI</strong>.• Best correlation (not in all the domain):– 12 hz cutoff frequency.– 2 pole forward-backward Butterworth filter. (4 resultantpoles)2.22.12.01.91.81.71.6371.51.41.31.21.11.00.90.80.70.60.6 0.7 0.8 0.9 1.0 1.1 1.2 1.3 1.4 1.5 1.6 1.7 1.8 1.9 2.0 2.1 2.237 /77 Bruxelles 30/05/2006 <strong>ASI</strong> standardRobust. GRD1-2002-70021<strong>ASI</strong> filteredasi12 hzLineare (asi)Lineare (12 hz)
Filtered <strong>ASI</strong>.<strong>ASI</strong> filteredRobust. GRD1-2002-700212.22.12.01.91.81.71.61.51.41.31.21.11.00.90.80.70.6• Comparison with original <strong>ASI</strong> values:– Up to 1 small modification (for some tests new <strong>ASI</strong>value is higher than the standard value)– From 1 to 1.5 global decrease if compared to standard<strong>ASI</strong>.– For higher <strong>ASI</strong> value a slightly decrease of the newvalue.– Cut off frequency must carefully considered.• Moving average 38 effect cancelled.• Less sensible to noise.38 /77 Bruxelles 30/05/20060.6 0.7 0.8 0.9 1.0 1.1 1.2 1.3 1.4 1.5 1.6 1.7 1.8 1.9 2.0 2.1 2.2<strong>ASI</strong> standardR 2 = 0.9668asi12 hzLineare (asi)Potenza (12 hz)Amplitude [Db]0-50-100-150-200-250-300Moving averageFilter-35010 0 10 1 10 2 10 3 10 4freq [Hz]
Data acquisition and severityindices evaluation (experimental).Robust. GRD1-2002-70021• Round Robin 1: TB11 tests, same newcar (Peugeot 106), same concrete rigidbarrier in all the labs. Only, transducers,data acquisition system and software isdifferent.39• Round Robin 2: TB11 tests, differentcars (each lab uses own standard car),same concrete rigid barrier.39 /77 Bruxelles 30/05/2006
Round RobinRobust. GRD1-2002-70021• A first analysis show a large scatter betweenlabs and strong differences between differentindices evaluation of the same signals.• Some of the differences came from differenttesting procedures. Some other from softwareand data acquisition.• To better understand this problem a first analysisfound as a key point the offset evaluation thatcan produce strong influences on <strong>THIV</strong> value andmedium influences on <strong>ASI</strong> and PHD.40Med max % min %Asi 1.86 0.05 2.83 -0.03 -1.48<strong>THIV</strong> 32.89 1.31 3.98 -0.49 -1.5PHD 14.15 3.55 25.1 -2.75 -19.440 /77 Bruxelles 30/05/2006
Offset removal.Robust. GRD1-2002-70021• Offset is usually evaluated obtaining the meanvalue of that channel for some millisecondsbefore the impact. The number of millisecondsused as well as the precise impacting pointsample evaluation can produce different offsetresults on the same signal.• Acceleration time histories just before theimpact can contain oscillations transmittedfrom ground and (mainly for pushed or pulledcar systems)41the release of the car inducesmovements of the vehicle that can influenceoffset evaluation.• For this reason the evaluation of zero-levelshould be better defined and improved.41 /77 Bruxelles 30/05/2006
Offset removal.Robust. GRD1-2002-70021• Oscillation with amplitude of about 1 g are presentbefore the impact being the mean value zero but can beunderstood that a different offset window or a realvehicle acceleration can strongly influence the output.• A different offset evaluation of .5 g on each channel canproduces a delta in <strong>ASI</strong> of about 0.1 and in <strong>THIV</strong> of 1.74km/h.• Drift of signals during the preparation must be takeninto account to find a better solution.1.510.50-0.5-1-1.542accelerazione y42 /77 Bruxelles-230/05/20060.01 0.02 0.03 0.04 0.05 0.06 0.07 0.08 0.09 0.1
Software influence.Robust. GRD1-2002-70021• To investigate the influence of differentsoftware a benchmark file has beenproduced where the different offsetevaluation procedures would notgenerate influences.• This signal is simply one of the originalsignals where the impacting point has43been defined and all data before thispoint are equal to 0.• With this file the influence of offsetremoval has been avoided.43 /77 Bruxelles 30/05/2006
Software influence.Robust. GRD1-2002-70021• Can be seen that the different software usedevaluate indices with scatter that should notbe present. Conclusion to this point is that avalidated and common software should beused to evaluate severity indices .L1L2L3L44444 /77 TRAPBruxelles30/05/2006<strong>ASI</strong> t (s) <strong>THIV</strong> t (s) PHD t (s)1.8432.43 0.076612.15 0.13691.84 0.00971.84 0.00991.84 0.11481.84 0.0098BENCH DATA32.45 0.076632.49 0.076732.43 0.156632.4 0.077911.88 0.137012.15 0.137013.69 0.222011.9 0.1370
Accelerometer mountingRobust. GRD1-2002-70021• The structure of the floor of a car ismade of thin plates that, during thetest, produces vibrations.• These vibrations can be affected by themass of the structure used to install theaccelerometers in the proper position.45• The severity indices can be affected bythe structure used to install theaccelerometers.45 /77 Bruxelles 30/05/2006
Different mounting block naturalfrequencies• First natural frequencies located between 10 and 15hz.1.2E+001.0E+00Robust. GRD1-2002-70021Ampiezza8.0E-016.0E-014.0E-012.0E-010.0E+00460 20 40 60 80 100 120 140 160 180 200Frequenza [hz]Serie1Serie3Serie4Serie6Serie7Serie9Serie1546 /77 Bruxelles 30/05/2006
ResultsRobust. GRD1-2002-70021• These frequencies are lower that thetarget design ones (about 30 hz).• 15 hz is a frequency not modified by themoving average.– This frequency can influence severityindices• Mounting block 47 influence:– weight of the block in general decreases thefirst frequency.• Mounting block should be describedinside the standards.47 /77 Bruxelles 30/05/2006
Composite mounting blockRobust. GRD1-2002-70021• To demonstrate the influence of the mass acomposite mounting block has been designed.• Structure:– Carbon fiber /nomex structure.– Glass fiber plates to be easily machined to fix thestructure to the car and install accelerometers.– 8 blocks produced.• Some tests houses used this structure to verifythe influence on the final results.48• The idea is not to suggest the use of thisstructure but to demonstrate how can affect theresults.48 /77 Bruxelles 30/05/2006
Composite mounting fixing.Robust. GRD1-2002-700214949 /77 Bruxelles 30/05/2006
Deceleration tests.Robust. GRD1-2002-700215050 /77 Bruxelles 30/05/2006
Robust. GRD1-2002-7002180007000600050004000300020001000Deceleration tests. Results.• Frequency response:– Strong differences between different mountingblocks– Differences also at lower frequenciesspectrum power density. y direction. 70° impact5100 20 40 60 80 10051 /77 Bruxelles 30/05/2006AluminiumComposite70006000500040003000200010000spectrum power density. y direction. 70° impactAluminiumComposite2 4 6 8 10 12 14
Conclusion.Robust. GRD1-2002-70021• Validated software should be usedduring certification tests.• A precise procedure to evaluate theoffset value must be inserted in EN1317• Mounting block structure can influence52the acceleration time histories.• EN 1317 should describe the technicalrequirements to avoid this kind ofinfluences on the results.52 /77 Bruxelles 30/05/2006
53Robust. GRD1-2002-7002153 /77 Bruxelles 30/05/2006Questions?