Christian Mission Aid CMA - Action Against Hunger
Christian Mission Aid CMA - Action Against Hunger
Christian Mission Aid CMA - Action Against Hunger

You also want an ePaper? Increase the reach of your titles
YUMPU automatically turns print PDFs into web optimized ePapers that Google loves.
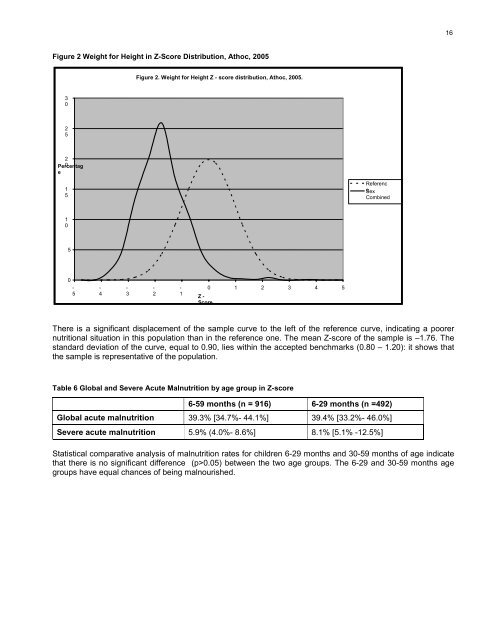
16Figure 2 Weight for Height in Z-Score Distribution, Athoc, 2005Figure 2. Weight for Height Z - score distribution, Athoc, 2005.30252Percentag 0e15ReferenceSexCombined1050-5-4-3-2-10 1 2 3 4 5Z -ScoreThere is a significant displacement of the sample curve to the left of the reference curve, indicating a poorernutritional situation in this population than in the reference one. The mean Z-score of the sample is –1.76. Thestandard deviation of the curve, equal to 0.90, lies within the accepted benchmarks (0.80 – 1.20): it shows thatthe sample is representative of the population.Table 6 Global and Severe Acute Malnutrition by age group in Z-score6-59 months (n = 916) 6-29 months (n =492)Global acute malnutrition 39.3% [34.7%- 44.1%] 39.4% [33.2%- 46.0%]Severe acute malnutrition 5.9% (4.0%- 8.6%] 8.1% [5.1% -12.5%]Statistical comparative analysis of malnutrition rates for children 6-29 months and 30-59 months of age indicatethat there is no significant difference (p>0.05) between the two age groups. The 6-29 and 30-59 months agegroups have equal chances of being malnourished.