Endothermic and Exothermic Reactions - Westminster College
Endothermic and Exothermic Reactions - Westminster College
Endothermic and Exothermic Reactions - Westminster College
- No tags were found...

Create successful ePaper yourself
Turn your PDF publications into a flip-book with our unique Google optimized e-Paper software.
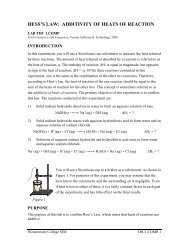
<strong>Endothermic</strong> <strong>and</strong> Extothermic <strong>Reactions</strong>PROCEDURE1. Obtain <strong>and</strong> wear goggles.Part I Citric Acid plus Baking Soda2. Place a Styrofoam cup into a 250-mL beaker as shown in Figure 1. Measure out 30mL of citric acid solution into the Styrofoam cup. Place a Temperature Probe into thecitric acid solution.3. Prepare the computer for data collection by opening the Experiment 1 folder from theChemistry with Computers folder of Logger Pro. Then open the experiment file thatmatches the probe you are using. The vertical axis has temperature scaled from -10 to40°C. The horizontal axis has time scaled from 0 to 300 seconds.4. Weigh out 10.0 g of solid baking soda on a piece of weighing paper.5. The Temperature Probe must be in the citric acid solution for at least 30 secondsbefore this step. Begin data collection by clicking Collect . After about 20 secondshave elapsed, add the baking soda to the citric acid solution. Gently stir the solutionwith the Temperature Probe to ensure good mixing. Collect data until a minimumtemperature has been reached <strong>and</strong> temperature readings begin to increase. You canclick on Stop to end data collection or let the computer automatically end it after300 seconds.6. Dispose of the reaction products as directed by your teacher.7. To analyze <strong>and</strong> print your data:a. Click the Statistics button, . In the statistics box that appears on the graph,several statistical values are displayed for Temp 1, including minimum <strong>and</strong>maximum. In your data table, record the maximum as the initial temperature <strong>and</strong>the minimum as the final temperature. Close the statistics box by clicking theupper-right corner of the box.b. To confirm the minimum <strong>and</strong> maximum temperatures, use the scroll bars in theTable window to scroll through the table to examine the data. Compare theminimum <strong>and</strong> maximum data points to those you recorded in the previous step.c. Print a copy of the Table window. Enter your name(s) <strong>and</strong> the number of copies.d. You will often want to change the scale of either axis of the graph. There areseveral ways to do this. To scale the temperature axis from 0 to 25°C instead of thepresent scaling, click the mouse on the “40” tickmark at the top of the axis. Inplace of the “40”, type in “25” <strong>and</strong> press the Enter key. Notice that the entire axisreadjusts to the change you made. Use the same method to change the “-10”tickmark to “0”. Note: A second option is to click the Autoscale button, . Thecomputer will automatically rescale the axes for you.e. You can also exp<strong>and</strong> any portion of the graph by zooming in on it. Select the areayou want to zoom in on. Do this by moving the mouse pointer to the beginning ofthis section of data—press the mouse button <strong>and</strong> hold it down as you drag acrossthe curve, leaving a rectangle. Then click the Zoom In button, . The computerwill now create a new, full-size graph that includes just the region inside therectangle. You can reverse this action by clicking the Undo Zoom button, .f. When you again collect data in Part II of this experiment, the data will be collectedas Latest run, the most recent set of data you have collected. The original Latest<strong>Westminster</strong> <strong>College</strong> SIM Page 2