Endothermic and Exothermic Reactions - Westminster College
Endothermic and Exothermic Reactions - Westminster College
Endothermic and Exothermic Reactions - Westminster College
- No tags were found...

Create successful ePaper yourself
Turn your PDF publications into a flip-book with our unique Google optimized e-Paper software.
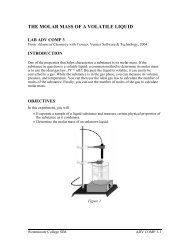
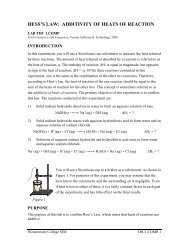
<strong>Endothermic</strong> <strong>and</strong> <strong>Exothermic</strong> <strong>Reactions</strong>From Chemistry with Vernier, Vernier Software <strong>and</strong> TechnologyLAB 01<strong>Westminster</strong> <strong>College</strong>Many chemical reactions give off energy. Chemical reactions that release energy arecalled exothermic reactions. Some chemical reactions absorb energy <strong>and</strong> are calledendothermic reactions. You will study one exothermic <strong>and</strong> one endothermic reaction inthis experiment.In Part I, you will study the reaction between citric acid solution <strong>and</strong> baking soda. Anequation for the reaction is:H 3 C 6 H 5 O 7 (aq) + 3 NaHCO 3 (s) ⎯ → 3 CO 2 (g) + 3 H 2 O(l) + Na 3 C 6 H 5 O 7 (aq)In Part II, you will study the reaction between magnesium metal <strong>and</strong> hydrochloric acid.An equation for this reaction is:Mg(s) + 2 HCl(aq) ⎯ → H 2 (g) + MgCl 2 (aq)Another objective of this experiment is for you to become familiar with Logger Pro, aprogram you will use with nearly every experiment in this manual. In this experiment,you will use Logger Pro to collect <strong>and</strong> display data as a graph or table, analyze yourexperimental data values, <strong>and</strong> print a graph or data table.Figure 1MATERIALSPower Macintosh or Windows PCStyrofoam cupVernier computer interface250-mL beakerLogger Procitric acid, H 3 C 6 H 5 O 7 , solutionTemperature Probe baking soda, NaHCO 350-mL graduated cylinderhydrochloric acid, HCl, solutionbalancemagnesium, Mg<strong>Westminster</strong> <strong>College</strong> SIM Page 1
<strong>Endothermic</strong> <strong>and</strong> Extothermic <strong>Reactions</strong>PROCEDURE1. Obtain <strong>and</strong> wear goggles.Part I Citric Acid plus Baking Soda2. Place a Styrofoam cup into a 250-mL beaker as shown in Figure 1. Measure out 30mL of citric acid solution into the Styrofoam cup. Place a Temperature Probe into thecitric acid solution.3. Prepare the computer for data collection by opening the Experiment 1 folder from theChemistry with Computers folder of Logger Pro. Then open the experiment file thatmatches the probe you are using. The vertical axis has temperature scaled from -10 to40°C. The horizontal axis has time scaled from 0 to 300 seconds.4. Weigh out 10.0 g of solid baking soda on a piece of weighing paper.5. The Temperature Probe must be in the citric acid solution for at least 30 secondsbefore this step. Begin data collection by clicking Collect . After about 20 secondshave elapsed, add the baking soda to the citric acid solution. Gently stir the solutionwith the Temperature Probe to ensure good mixing. Collect data until a minimumtemperature has been reached <strong>and</strong> temperature readings begin to increase. You canclick on Stop to end data collection or let the computer automatically end it after300 seconds.6. Dispose of the reaction products as directed by your teacher.7. To analyze <strong>and</strong> print your data:a. Click the Statistics button, . In the statistics box that appears on the graph,several statistical values are displayed for Temp 1, including minimum <strong>and</strong>maximum. In your data table, record the maximum as the initial temperature <strong>and</strong>the minimum as the final temperature. Close the statistics box by clicking theupper-right corner of the box.b. To confirm the minimum <strong>and</strong> maximum temperatures, use the scroll bars in theTable window to scroll through the table to examine the data. Compare theminimum <strong>and</strong> maximum data points to those you recorded in the previous step.c. Print a copy of the Table window. Enter your name(s) <strong>and</strong> the number of copies.d. You will often want to change the scale of either axis of the graph. There areseveral ways to do this. To scale the temperature axis from 0 to 25°C instead of thepresent scaling, click the mouse on the “40” tickmark at the top of the axis. Inplace of the “40”, type in “25” <strong>and</strong> press the Enter key. Notice that the entire axisreadjusts to the change you made. Use the same method to change the “-10”tickmark to “0”. Note: A second option is to click the Autoscale button, . Thecomputer will automatically rescale the axes for you.e. You can also exp<strong>and</strong> any portion of the graph by zooming in on it. Select the areayou want to zoom in on. Do this by moving the mouse pointer to the beginning ofthis section of data—press the mouse button <strong>and</strong> hold it down as you drag acrossthe curve, leaving a rectangle. Then click the Zoom In button, . The computerwill now create a new, full-size graph that includes just the region inside therectangle. You can reverse this action by clicking the Undo Zoom button, .f. When you again collect data in Part II of this experiment, the data will be collectedas Latest run, the most recent set of data you have collected. The original Latest<strong>Westminster</strong> <strong>College</strong> SIM Page 2
<strong>Endothermic</strong> <strong>and</strong> Extothermic <strong>Reactions</strong>run will be lost if it is not saved or stored. Choose Store Latest Run from the Datamenu to store Latest as Run 1, then save or print it later. Note that the line for Run1 is thinner than it was for Latest. To hide the curve of your first data run, click theTemperature vertical-axis label of the graph, <strong>and</strong> uncheck Run 1. Click OK .Part II Hydrochloric Acid Plus Magnesium8. Manually rescale the vertical axis to the original temperature scale of -10 to 40°C. Todo so, click the mouse on the bottom tickmark <strong>and</strong> type in “-10”. Then click on thetop tickmark <strong>and</strong> type in “40”.9. Measure out 30 mL of HCl solution into the Styrofoam cup. Place the TemperatureProbe into the HCl solution. Note: The Temperature Probe must be in the HClsolution for at least 45 seconds before doing Step 11. CAUTION: Hydrochloric acidis caustic. Avoid spilling it on your skin or clothing. Wear chemical splash goggles atall times. Notify your teacher in the event of an accident.10. Obtain a piece of magnesium metal from the teacher.11. Begin data collection by clicking Collect . After about 20 seconds have elapsed, addthe Mg to the HCl solution. Gently stir the solution with the Temperature Probe toensure good mixing. CAUTION: Do not breathe the vapors! Collect data until amaximum temperature has been reached <strong>and</strong> the temperature readings begin todecrease.12. Dispose of the reaction products as directed by your teacher.13. To analyze your Part II data:a. Change the appearance of the graph by double-clicking anywhere on the graphbring up the Graph Options dialog. Check the box in front of Point Protector Every1 Point—a point protector will now outline each data point on the graph. ClickOK .b. Instead of scrolling through the Table window in this trial, click the Examinebutton, . The cursor will become a vertical line. As you move the mouse pointeracross the screen, the temperature <strong>and</strong> time values corresponding to its positionwill be displayed in the box at the upper-left corner of the graph. Scroll across theinitial 3-4 points to determine the initial temperature. Record the initialtemperature in the data table. Move the mouse pointer across the peak of thetemperature curve to determine the maximum temperature, <strong>and</strong> record it as thefinal temperature in your data table. To remove the examine box, click the upperrightcorner of the box.c. It is also possible to calculate statistics just for a portion of your collected data. Todo so, you must first select the data you are interested in. For example, you mightwant to find the average (or mean) of the first few data points to use as an initialtemperature, instead of using the minimum value. Select the flat portion of thecurve—move the mouse pointer to time 0 <strong>and</strong> drag across the flat part of the curve.Now click the Statistics button, , <strong>and</strong> note the mean temperature value in thestatistics box on the graph. This value is the mean of only the selected data points.When you are done, click on the upper-right corner of the statistics box to removeit.14. To print a graph of temperature vs. time showing both data runs:a. Click the Temperature vertical-axis label of the graph. To display both temperatureruns, check the Run 1 <strong>and</strong> Latest boxes. Click OK .<strong>Westminster</strong> <strong>College</strong> SIM Page 3
<strong>Endothermic</strong> <strong>and</strong> Extothermic <strong>Reactions</strong>b. Label both curves by choosing Make Annotation from the Analyze menu, <strong>and</strong>typing “<strong>Endothermic</strong>” (or “<strong>Exothermic</strong>”) in the edit box. Then drag each box to aposition near its respective curve.c. Print a copy of the Graph window. Enter your name(s) <strong>and</strong> the number of copies ofthe graph you want.15. Save the temperature <strong>and</strong> time data from both data runs. Choose Save As from theFile menu <strong>and</strong> give the file a distinct name. As directed by your teacher, choose alocation for the file, <strong>and</strong> click OK .DATA TABLEPart IPart IIFinal temperature, t 2 °C °CInitial temperature, t 1 °C °CTemperature change, Δt °C °COBSERVATIONSPROCESSING THE DATA1. Calculate the temperature change, Δt, for each reaction by subtracting the initialtemperature, t 1 , from the final temperature, t 2 (Δt = t 2 – t 1 ).2. Tell which reaction is exothermic. Explain.3. Which reaction had a negative Δt value? Is the reaction endothermic or exothermic?Explain.4. For each reaction, describe three ways you could tell a chemical reaction was takingplace.5. Which reaction took place at a greater rate? Explain your answer.<strong>Westminster</strong> <strong>College</strong> SIM Page 4