Volume 1 - Hillsborough County & City of Tampa Water Atlas
Volume 1 - Hillsborough County & City of Tampa Water Atlas
Volume 1 - Hillsborough County & City of Tampa Water Atlas
- No tags were found...

You also want an ePaper? Increase the reach of your titles
YUMPU automatically turns print PDFs into web optimized ePapers that Google loves.
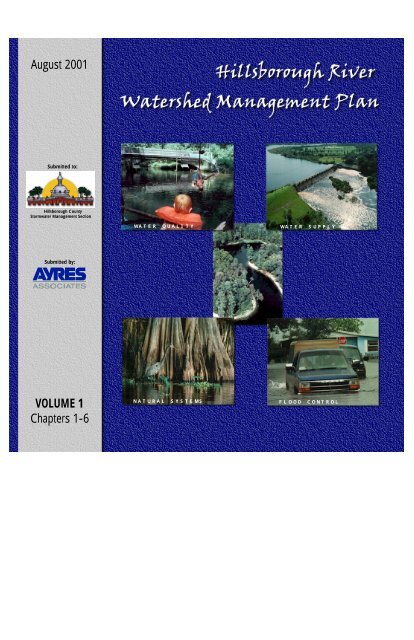
August 2001Submitted to:<strong>Hillsborough</strong> <strong>County</strong>Stormwater Management SectionWATER QUALITYWATER SUPPLYSubmitted by:VOLUME 1Chapters 1-6NATURAL SYSTEMSFLOOD CONTROL
TABLE OF CONTENTSChapter Page1 INTRODUCTION......................................................................................................................1-11.1 Project Location and Description.................................................................................1-11.2 Current Management <strong>of</strong> the <strong>Water</strong>shed .......................................................................1-31.3 Climate <strong>of</strong> the <strong>Hillsborough</strong> River <strong>Water</strong>shed...............................................................1-41.4 Historical Flooding .......................................................................................................1-41.5 Scope <strong>of</strong> the Project....................................................................................................1-61.6 Background and Data Collection..................................................................................1-71.7 Project Objectives .......................................................................................................1-72 GENERAL DESCRIPTION ......................................................................................................2-12.1 Climate .......................................................................................................................2-12.2 Topography .................................................................................................................2-12.3 Soils ..........................................................................................................................2-92.3.1 Crystal Springs................................................................................................2-92.3.2 Blackwater Creek..........................................................................................2-142.3.3 Central Tributaries.........................................................................................2-142.3.4 Northwestern Tributaries ...............................................................................2-142.3.5 <strong>Hillsborough</strong> River .........................................................................................2-142.3.6 TBC and Tributaries ......................................................................................2-142.4 Land Use / Coverage.................................................................................................2-142.4.1 Crystal Springs..............................................................................................2-322.4.2 Blackwater Creek..........................................................................................2-322.4.3 Central Tributaries.........................................................................................2-322.4.4 Northwestern Tributaries ...............................................................................2-322.4.5 <strong>Hillsborough</strong> River .........................................................................................2-402.4.6 TBC and Tributaries ......................................................................................2-402.4.7 Future Land Uses within the <strong>Hillsborough</strong> River <strong>Water</strong>shed...........................2-402.5 Physiography and Hydrology .....................................................................................2-402.6 Hydrogeology ............................................................................................................2-463 WATERSHED DESCRIPTION .................................................................................................3-13.1 Introduction..................................................................................................................3-13.2 Crystal Springs Region................................................................................................3-13.2.1 <strong>Hillsborough</strong> above Crystal Springs .................................................................3-13.2.2 Big Ditch .........................................................................................................3-23.2.3 Indian Creek....................................................................................................3-23.3 Blackwater Creek Region ............................................................................................3-23.3.1 Blackwater Creek............................................................................................3-23.3.2 Itchepackesassa Creek ..................................................................................3-33.3.3 East Canal......................................................................................................3-33.3.4 Tiger Creek.....................................................................................................3-3ii
TABLE OF CONTENTSChapter Page3.4 Central Tributaries Region...........................................................................................3-33.4.1 Two Hole Branch.............................................................................................3-33.4.2 Clay Gully East ...............................................................................................3-43.4.3 Hollomans Branch ...........................................................................................3-43.5 Northwest Tributaries Region.......................................................................................3-53.5.1 New River .......................................................................................................3-53.5.2 Basset Branch ................................................................................................3-53.5.3 Clay Gully West ..............................................................................................3-63.5.4 Trout Creek.....................................................................................................3-63.6 <strong>Hillsborough</strong> River........................................................................................................3-63.6.1 <strong>Hillsborough</strong> River Above S-155......................................................................3-73.6.2 <strong>Hillsborough</strong> River Below S-155 ......................................................................3-73.7 TBC and Tributaries.....................................................................................................3-83.7.1 Vandenberg Area ............................................................................................3-93.7.2 Williams Area..................................................................................................3-93.7.3 Mango Area ....................................................................................................3-93.7.4 Falkenburg Area..............................................................................................3-94 HYDROLOGIC / HYDRAULIC MODEL METHODOLOGY........................................................................4-1General Hydrology / Hydrologic Model Development ................................................................4-14.1 Hydrology ....................................................................................................................4-14.1.1 Hydrologic Model.............................................................................................4-14.1.2 Rainfall Depths and Distribution.......................................................................4-14.1.3 Time-<strong>of</strong>-Concentration.....................................................................................4-84.1.4 Basin Delineations ..........................................................................................4-84.1.5 Run<strong>of</strong>f Curve Numbers....................................................................................4-94.1.6 Initial Abstraction...........................................................................................4-184.1.7 Shape Factor ................................................................................................4-184.2 Hydraulics..................................................................................................................4-184.2.1 Hydraulic Model.............................................................................................4-184.2.2 Natural Channels...........................................................................................4-184.2.3 Conduits........................................................................................................4-214.2.4 Storage Facilities..........................................................................................4-214.2.5 Weirs............................................................................................................4-214.2.6 Orifices .........................................................................................................4-224.2.7 Initial <strong>Water</strong> Surface Elevations ....................................................................4-224.2.8 Dummy Junctions and Conduits.....................................................................4-224.2.9 Boundary Conditions .....................................................................................4-224.2.10 Numerical Instability ......................................................................................4-234.2.11 Link-Node Diagrams......................................................................................4-23iii
TABLE OF CONTENTSChapter Page5 HYDROLOGIC / HYDRAULIC MODEL CALIBRATION & VERIFICATION ...................................................5-15.1 Existing Conditions Data Collection .............................................................................5-15.1.1 Selection.........................................................................................................5-15.1.2 Antecedent Moisture Condition........................................................................5-25.1.3 Precipitation Data ...........................................................................................5-45.1.4 Surface <strong>Water</strong> Data........................................................................................5-45.2 Calibration Parameters and Methodology ....................................................................5-55.2.1 Hydrologic Parameters....................................................................................5-55.2.2 Hydraulic Parameters......................................................................................5-65.2.3 Calibration Method..........................................................................................5-65.3 Existing Conditions Model Calibration..........................................................................5-75.3.1 Headwater Basin Calibration...........................................................................5-75.3.2 State Park Gage Calibration..........................................................................5-105.3.3 Morris Bridge Gage Calibration .....................................................................5-105.3.4 S-155 Gage Calibration.................................................................................5-115.3.5 Fowler Avenue Gage Calibration...................................................................5-115.3.6 <strong>Tampa</strong> Bypass Canal Calibration ..................................................................5-126 EXISTING CONDITIONS LEVEL OF SERVICE.....................................................................................6-16.1 Standard Design Storm Events....................................................................................6-16.2 Existing Conditions Model Simulaion Results ...............................................................6-16.3 Level <strong>of</strong> Service (LOS) Analysis..................................................................................6-16.4 Level <strong>of</strong> Service (LOS) Determinations .......................................................................6-36.4.1 <strong>Hillsborough</strong> River Near Crystal Springs (LOS not determined)........................6-36.4.2 Blackwater Creek (LOS D)..............................................................................6-46.4.3 Central Tributaries (LOS D).............................................................................6-86.4.4 Northwest Tributaries (LOS D) ......................................................................6-196.4.5 <strong>Hillsborough</strong> River (LOS A)............................................................................6-226.4.6 <strong>Tampa</strong> Bypass Canal And Tributaries (LOS D)..............................................6-23iv
TABLE OF CONTENTSTABLESChapter 22.3.1 Soil Coverage <strong>of</strong> the Crystal Springs Region2.3.2 Soil Coverage <strong>of</strong> the Blackwater Creek Region2.3.3 Soil Coverage <strong>of</strong> the Central Tributaries Region2.3.4 Soil Coverage <strong>of</strong> the Northwest Tributaries Region2.3.5 Soil Coverage <strong>of</strong> the <strong>Hillsborough</strong> River Region2.3.6 Soil Coverage <strong>of</strong> the TBC and Tributaries Region2.4.1 1995 Land Use Distribution in the Crystal Springs Region2.4.2 1995 Land Use Distribution in the Blackwater Creek Region2.4.3 1995 Land Use Distribution in the Central Tributaries Region2.4.4 1995 Land Use Distribution in the Northwest Tributaries Region2.4.5 1995 Land Use Distribution in the <strong>Hillsborough</strong> River Region2.4.6 1995 Land Use Distribution in the TBC and Tributaries RegionChapter 44.1.1 Basin Numbering Scheme4.1.2 Hydrologic Soil Group Determination4.1.3 FLUCCS Code Description4.1.4 Run<strong>of</strong>f Curve Number (CN) Lookup4.2.1 Historical Studies <strong>of</strong> Channel Systems in the <strong>Hillsborough</strong> River <strong>Water</strong>shedChapter 55.1.1 <strong>Hillsborough</strong> <strong>County</strong> Calibration Criteria5.1.2 Storms Potentially Suitable for Calibration and Verification5.1.3 Antecedent Moisture Conditions5.1.4 AMC Curve Number Lookup Table5.3.1 Global Adjustments to Non-Detailed <strong>Water</strong>shedsChapter 66.4.2 Existing Conditions Level <strong>of</strong> Service Blackwater Creek Region6.4.3 Existing Conditions Level <strong>of</strong> Service Central Tributaries Region6.4.4 Existing Conditions Level <strong>of</strong> Service Northwest Tributaries Region6.4.5 Existing Conditions Level <strong>of</strong> Service <strong>Hillsborough</strong> River Region6.4.6 Existing Conditions Level <strong>of</strong> Service TBC and Tributaries Regionv
TABLE OF CONTENTSFIGURESChapter 11.1.1 <strong>Hillsborough</strong> River <strong>Water</strong>shed Location Map1.5.1 <strong>Water</strong>shed Management Plan Development ProcessChapter 22.1.1 <strong>Hillsborough</strong> River <strong>Water</strong>shed Regional Divisons2.2.1 Topography <strong>of</strong> the Crystal Springs Region2.2.2 Topography <strong>of</strong> the Blackwater Creek Region2.2.3 Topography <strong>of</strong> the Central Tributaries Region2.2.4 Topography <strong>of</strong> the Northwestern Tributaries Region2.2.5 Topography <strong>of</strong> the <strong>Hillsborough</strong> River Region2.2.6 Topography <strong>of</strong> the TBC and Tributaries Region2.3.1 Soil Types in Crystal Springs Region2.3.2 Hydrologic Soil Groups in the Crystal Springs Region2.3.3 Soil Types in the Blackwater Creek Region2.3.4 Hydrologic Soil Groups in the Blackwater Creek Region2.3.5 Soil Types in the Central Tributaries Region2.3.6 Hydrologic Soil Groups in the Central Tributaries Region2.3.7 Soil Types in the Northwestern Tributaries Region2.3.8 Hydrologic Soil Groups in the Northwestern Tributaries Region2.3.9 Soil Types in the <strong>Hillsborough</strong> River Region2.3.10 Hydrologic Soil Groups in the <strong>Hillsborough</strong> River Region2.3.11 Soil Types in the TBC and Tributaries Region2.3.12 Hydrologic Soil Groups in the TBC and Tributaries Region2.4.1 Land Use for the Crystal Springs Region2.4.2 Land Use for the Blackwater Creek Region2.4.3 Land Use for the Central Tributaries Region2.4.4 Land Use for the Northwestern Tributaries Region2.4.5 Land Use for the <strong>Hillsborough</strong> River Region2.4.6 Land Use for the TBC and Tributaries Region2.6.1 SWFWMD Hydrogeologic Cross-Sectionvi
TABLE OF CONTENTSFIGURESChapter 44.1.1 2.33-Year, 24-Hour Isohyetal Rainfall Map4.1.2 5-Year, 24-Hour Isohyetal Rainfall Map4.1.3 10-Year, 24-Hour Isohyetal Rainfall Map4.1.4 25-Year, 24-Hour Isohyetal Rainfall Map4.1.5 50-Year, 24-Hour Isohyetal Rainfall Map4.1.6 100-Year, 24-Hour Isohyetal Rainfall MapChapter 55.1.1 Rain Gage Locations5.1.2 Sept. 1997 Rainfall Depth Thiessen Polygons5.1.3 Dec. 1997 Rainfall Depth Thiessen Polygons5.1.4 Sept. 1997 Rainfall Distribution Thiessen Polygons5.1.5 Dec. 1997 Rainfall Distribution Thiessen Polygons5.1.6 Gage/Control Structure Locations5.1.7 Hydrograph Separation5.3.1 Trout, Blackwater, & Crystal Gages Calibration5.3.2 Blackwater Creek September 1997 Gage vs Model Stage5.3.3 Blackwater Creek September 1997 Gage vs Model Flow5.3.4 September 1997 Trout Creek Gage vs Model Stage5.3.5 September 1997 Trout Creek vs Model Flow5.3.6 Blackwater Creek December 1997 Gage vs Model Stage5.3.7 Blackwater Creek December 1997 vs Model Flow5.3.8 December 1997 Trout Creek Gage vs Model Stage5.3.9 December 1997 Trout Creek Gage vs Model Flow5.3.10 September 1997 Crystal Springs Gage vs Model Flow5.3.11 September 1998 Crystal Springs Gage vs Model Flow5.3.12 State Park Gage Calibration5.3.13 September 1997 State Park Gage vs Model Stage5.3.14 September 1997 State Park Gage vs Model Flow5.3.15 December 1997 State Park Gage vs Model Stage5.3.16 December 1997 State Park Gage vs Model Flow5.3.17 Morris Bridge Gage Calibration5.3.18 September 1997 Morris Bridge Gage vs Model Stage5.3.19 December 1997 Morris Bridge Gage vs Model Stage5.3.20 S-155 Gage Calibrationvii
TABLE OF CONTENTSFIGURES5.3.21 September 1997 S-155 Gage vs Model Stage5.3.22 December 1997 S-155 Gage vs Model Stage5.3.23 Fowler Avenue Gage5.3.24 September 1997 Fowler Gage vs Model Stage5.3.25 December 1997 Fowler Gage vs Model Stage5.3.26 TBC Calibration GagesChapter 66.4.2 Levels <strong>of</strong> Service for the Blackwater Creek Region6.4.3 Levels <strong>of</strong> Service for the Central Tributaries Region6.4.4 Levels <strong>of</strong> Service for the Northwestern Tributaries Region6.4.5 Levels <strong>of</strong> Service for the <strong>Hillsborough</strong> River Region6.4.6 Levels <strong>of</strong> Service for the TBC and Tributaries Regionviii
EXECUTIVE SUMMARYIntroduction<strong>Water</strong>sheds are defined by natural hydrology, and they represent the most logical basisfor managing water resources. The resource becomes the focal point, and managersare able to gain a more complete understanding <strong>of</strong> overall conditions in an area and thestressors which affect those conditions.Traditionally, alleviating flooding problems have focused on efficient routing <strong>of</strong>stormwater with little consideration to environmental impact. Similarly, water qualityimprovements have focused on specific sources <strong>of</strong> pollution, such as industrialdischarge or sewage discharges for a specific water resource, such as a river segmentor wetland. While this approach may be successful in addressing site-specificproblems, it <strong>of</strong>ten failed to address the more subtle and chronic problems that contributeto the long-term deterioration <strong>of</strong> a watershed. For example, pollution from a sewagetreatment plant might be reduced significantly after a new technology is installed, andyet the local river may still suffer if otherfactors in the watershed, such as habitatdestruction or polluted run<strong>of</strong>f, gounaddressed. <strong>Water</strong>shed managementapproach <strong>of</strong>fers a holistic view <strong>of</strong> definingall related stressors that affect the overallquality <strong>of</strong> a watershed, and attempts toprovide solutions that have multi-facetedbenefits towards overall restoration andenhancement <strong>of</strong> the resources.Besides the environmental pay-<strong>of</strong>f,watershed approaches <strong>of</strong>ten have theadded benefit <strong>of</strong> saving time and money.Whether the task is monitoring, modeling,issuing permits, or reporting, a watershedframework <strong>of</strong>fers many opportunities to simplify and streamline the tasks, and facilitatescoordination among different local, state, and federal agencies. By coordinating theseefforts, the agencies can complement and reinforce each other’s activities, avoidduplication, and leverage resources to achieve greater results.<strong>Water</strong>shed protection also leads to greater awareness and support from the public.Active involvement and participation by the public build a sense <strong>of</strong> community, helpreduce conflicts, increase commitment to the actions necessary to meet environmentalgoals, and ultimately, improve the likelihood <strong>of</strong> success for environmental programs.1 <strong>Hillsborough</strong> River <strong>Water</strong>shed Management Plan
EXECUTIVE SUMMARY<strong>Hillsborough</strong> River-<strong>Tampa</strong> Bypass Canal <strong>Water</strong>shed ManagementPlanThe overall philosophy <strong>of</strong> watershed management in <strong>Hillsborough</strong> <strong>County</strong> (Florida)revolves around the holistic approach mentioned above and focuses on four keyobjectives: Flood protection; water quality enhancement; creation, restoration, andenhancement <strong>of</strong> natural systems; and improvement <strong>of</strong> water supply conditions. In 1998the Board <strong>of</strong> <strong>County</strong> Commissioners approved approximately $10 million to completethe watershed management plans for all the major watersheds within theunincorporated <strong>Hillsborough</strong> <strong>County</strong>. <strong>Hillsborough</strong> River-<strong>Tampa</strong> Bypass Canalwatershed is one <strong>of</strong>the largest and mosturbanized watershedsin the countyencompassingapproximately 637square mile area, <strong>of</strong>which 220 squaremiles lie within theunincorporatedcounty.The headwaters <strong>of</strong>the <strong>Hillsborough</strong> Riverare located in theGreen Swamp area <strong>of</strong>Pasco <strong>County</strong>. From that point, the river meanders for approximately 45 miles throughthe northeastern part <strong>of</strong> <strong>Hillsborough</strong> <strong>County</strong> and the cities <strong>of</strong> Temple Terrace and<strong>Tampa</strong> before discharging into <strong>Tampa</strong> Bay. Twenty major tributaries contribute to theflow <strong>of</strong> the river, draining residential, commercial, and agricultural lands from as faraway as Zephyrhills and Lakeland. The <strong>Tampa</strong> Bypass Canal is a man-made canalsystem (approximately 13 miles long) with several flow control structures to provideflood relief. The canal originates near the <strong>County</strong>’s Trout Creek Park north <strong>of</strong> MorrisBridge Road and is joined by a second diversion canal originating near Harney Road.The main canal discharges into the Palm River approximately 2.5 miles upstream <strong>of</strong> theriver’s mouth at McKay Bay.In 1999, Ayres Associates was retained by <strong>Hillsborough</strong> <strong>County</strong> to develop acomprehensive watershed management plan for this important watershed. The overallstudy period was estimated as two years with completion date <strong>of</strong> November 2001. Thisarticle provides an overview <strong>of</strong> the <strong>Hillsborough</strong> River <strong>Water</strong>shed Management Planand demonstrates the integrated approach <strong>of</strong> watershed management. Several uniquetools and concepts were developed/utilized during the development <strong>of</strong> this plan, whichfacilitated data collection/analysis and prioritization <strong>of</strong> management alternatives, and arehighlighted as appropriate.2 <strong>Hillsborough</strong> River <strong>Water</strong>shed Management Plan
Working Together for a Healthy <strong>Water</strong>shedData CollectionThe key steps followed during thedevelopment <strong>of</strong> the watershedmanagement plan are outlined in the flowdiagram. The process essentially beganwith data collection to characterize theexisting conditions <strong>of</strong> the watershed.State-<strong>of</strong>-the-art GPS technologyintegrated with a custom made databasewas used to collect survey information forthe conveyance systems. Historicflooding information was collected andmapped in a GIS system, and wassubsequently verified in the field. Tocharacterize the existing water qualityconditions in the watershed,approximately 20,000 sampling data wascollected from various federal, state, and local agencies. Wherever major data gapswere found, new sampling stations were implemented and both flow and water qualitydata were collected for the duration <strong>of</strong> the study. Historic land-use and vegetation mapswere collected to determine the extent <strong>of</strong> habitat degradation within the watershed.Information was also collected to determine the change in predominant species <strong>of</strong> floraand fauna within the watershed. Wherever possible, the collected data was storedelectronically in GIS linked databases.Hydrologic / Hydraulic ModelingThe hydrologic/hydraulic modeling was performed using the <strong>Hillsborough</strong> <strong>County</strong> Storm<strong>Water</strong> management Model (HCSWMM) which utilizes the U.S. Soil ConservationService (SCS) Run<strong>of</strong>f Curve Number method to convert stormwater rainfall excess intorun<strong>of</strong>f, by developinghydrographs (SCSDimensionless UnitHydrograph Method).The generated run<strong>of</strong>fhydrographs weresubsequently assignedto the hydraulic modelat specified, unique,junction locations andwere routed throughthe hydraulic systemvia a modified version<strong>of</strong> EPA Stormwater3 <strong>Hillsborough</strong> River <strong>Water</strong>shed Management Plan
EXECUTIVE SUMMARYManagement Model v.4.31a (SWMM) Extended Transport Block (EXTRAN). EXTRANuses a numerical method to solve the St. Venant Equations for gradually varied,unsteady flow in open channels, and computes time dependent values for flow rate andwater surface elevation.ArcInfo (ESRI Version 7.0) was utilized to aid in the determination <strong>of</strong> run<strong>of</strong>f curvenumbers utilizing (i) basin delineations prepared from topographic aerial coverages(Southwest Florida <strong>Water</strong> Management District), and (ii) soils and land use informationfrom soil map unit identifiers (MUID) and Florida Land Use Cover and ClassificationSystem (FLUCCS), respectively. A user-friendly GIS/database system was developed(as shown above) to present the connectivity diagrams <strong>of</strong> each subwatershed, whichalso housed all other information and pictures related to the nodes and reaches used inthe model.Customized databaseprograms (e.g., DatCon 2000)were also developed to performthe QA/QC <strong>of</strong> all informationutilized by the model. Theprogram facilitated theformatting <strong>of</strong> datasets inaccordance with the GIS dataformat outlined by theSWFWMD Data ManagementSystem.Using one calibration(September 1997) and twoverification events (December1997), the <strong>Hillsborough</strong> RiverSWMM model was successfullycalibrated to emulate observed run<strong>of</strong>f responses. Rainfall depths and distributions wereobtained from over 43 rain gages located in and around the watershed for calibration.These depths and distributions were then allocated to individual subbasins using theThiessen Polygon method. Calibration was performed to match computed stage,discharge, and run<strong>of</strong>f volume at 14 stream gage locations.Following calibration, level <strong>of</strong> service (LOS) determinations were made to correspondwith the <strong>Hillsborough</strong> <strong>County</strong> Comprehensive Stormwater Plan definitions for the floodprotection LOS designations. These levels were not strictly defined, and required aquantitative interpretation for analysis, resulting in the following definitions.LOS-A:LOS-B:No Significant Flooding (No flooding <strong>of</strong> roadways, No structures flooding,
Working Together for a Healthy <strong>Water</strong>shedLOS-C:LOS-D:No Significant Structure Flooding (>3" above road crown, No structuresflooding, >6" above site)No Limitation <strong>of</strong> Flooding (Structure Flooding)Known flooding problems in the study area were also evaluated based on a review <strong>of</strong>complaint information compiled from <strong>Hillsborough</strong> <strong>County</strong> staff and from publicmeetings. The model results <strong>of</strong> the existing conditions and the flooding complaintrecords were identified and combined to create a set <strong>of</strong> LOS deficiencies. Also,maintenance needs were identified from field observations and reports from <strong>County</strong>Maintenance Units and identified for each <strong>of</strong> the regions.<strong>Water</strong> Quality Evaluation and Pollutant Loading ModelingThe primary water quality issues/areas <strong>of</strong> concern in the <strong>Hillsborough</strong> River watershedare related to both the highly developed nature <strong>of</strong> the landscape in the areassurrounding the <strong>Tampa</strong> Bypass Canal as well as the potential for future growth in thenorth, northwest, and northeastern region <strong>of</strong> the<strong>County</strong>. Intense urbanization and commercialdevelopment in the lower regions <strong>of</strong> the <strong>Tampa</strong>Bypass Canal area have resulted in significantnegative impacts. These impacts were estimated byanalyzing the existing water quality data andcomparing the historic and current trends <strong>of</strong> the majorpollutants. For the purpose <strong>of</strong> data analysis a custommade database was developed (as shown) whichprovided easy access to data, data query capabilities,WQI and TSI calculations, and automated plotting <strong>of</strong>queried data using Excel.The key areas <strong>of</strong> concerndetermined from theseanalyses included thefollowing:• Increased impervioussurface area• Decreased stormwaterinfiltration to replenishand maintaingroundwater levels in theaquifer• Increased peak flowscausing stream5 <strong>Hillsborough</strong> River <strong>Water</strong>shed Management Plan
EXECUTIVE SUMMARY• bank erosion, sedimentation, andincreased pollutant loading• Extreme losses <strong>of</strong> riparian andupland buffer areas which protectstreams and lakes from waterquality degradation• Increased surface water pollutionfrom residential and agriculturalrun-<strong>of</strong>f, residual applications(septage and sludge spreading),and atmospheric deposition• Consistently elevated mercuryconcentrations causing potentialthreat <strong>of</strong> bioaccumulation, and• Potential contamination <strong>of</strong> groundwater from stormwater run<strong>of</strong>f, residualapplications, and septic tank systems.Based on the <strong>County</strong>’s future land use plan for the area, these impacts are anticipatedto occur at various locations in the northern regions <strong>of</strong> the watershed and would causesimilar negative trends in water quality. Existing agricultural and waste managementactivities in these areas already contribute occasional high levels <strong>of</strong> nutrients (primarilynitrogen) and fecal coliform bacteria. Previous studies by Ayres Associates indicatedthat land application <strong>of</strong> residuals (septage and sludge) in the <strong>Tampa</strong> Bypass Canal andother subwatersheds could contribute significant nitrogen loading.To determine the temporal trend in water quality conditions and present the datagraphically, an interactive GIS based display program (<strong>Water</strong>Focus – shown below) wasdeveloped. In this program the user chooses the specific area in the watershed anddefines the range <strong>of</strong> pollutant concentrations for favorable and unfavorable conditions.The program searches the database for appropriate data and colors the subwatershedsaccording to the measured concentrations at sampling stations. The program runsthrough the data points in a pre-defined time step and allows the user to see theseasonal changes in pollutant concentrations simultaneously for all subwatersheds.Potential water quality impact resulting from stormwater run<strong>of</strong>f in the watershed wasevaluated using the <strong>Hillsborough</strong> <strong>County</strong> Pollutant Loading and Removal Model, whichuses the EPA Simple Method (1992) to calculate pollutant loads. According to theSimple Method, non-point source pollutant loads are calculated as follows.Annual pollutant load per basin (lb/yr)= (0.227)(P)(CF)(Rv I )(C I )(A I )P = annual average precipitation (in/yr)Rv I = weighted average run<strong>of</strong>f coeff. based on impervious areaC I = event mean concentration <strong>of</strong> pollutant (mg/L)A I = catchment area contributing to outfall (acres)CF = correction factor for storms that do not produce run<strong>of</strong>f(assumed CF=0.9, 10% <strong>of</strong> storms do not produce run<strong>of</strong>f)6 <strong>Hillsborough</strong> River <strong>Water</strong>shed Management Plan
Working Together for a Healthy <strong>Water</strong>shedThe pollutant loading model was developed in GIS to estimate the potential waterquality impacts resulting from existing landuse and soils conditions, and also to evaluatethe reduction in potential loading due to the existing best management practices (BMP)within the watershed. The gross pollutant load which assumes no treatment <strong>of</strong> thestormwater run<strong>of</strong>f is indicative <strong>of</strong> the potential <strong>of</strong> the land to yield contaminants into theenvironment. From this gross loading, the reduction in loading due to the existing BMPswas subtracted to approximate the net pollutant loading within the watershed. Theexisting BMPs considered within the watershed include approximately 775 treatmentareas which were digitized in ArcView. Creating a shape file with the digitized treatmentareas provided several advantages including the following:• Modeling results are reproducible• Treatment polygons may be geographically overlaid on other GIS coverages (e.g.,soils, land-use, potentiometric surface, etc.)• Digitized information can be used in future analyses including characterizing theeffects <strong>of</strong> land use changes• Treatment polygons can be added or deleted to reflect changes in the level <strong>of</strong>treatment.<strong>Water</strong> quality treatment levels-<strong>of</strong>-service (LOS) criteria were used as part <strong>of</strong> this studyto allow comparisons <strong>of</strong> existing and proposed stormwater treatment conditions topollutant loading goals, and to help prioritize alternatives throughout the watershed.7 <strong>Hillsborough</strong> River <strong>Water</strong>shed Management Plan
EXECUTIVE SUMMARYThe pollutant loading model was run at the finest level <strong>of</strong> basin delineation and eachsubbasin was characterized following the LOS criteria (A through F) defined below:LOS A: Net load equivalent to 20% (or less) <strong>of</strong> untreated single family residential. LOSequal to A for a subbasin would indicate the presence <strong>of</strong> a high percentage <strong>of</strong>undisturbed natural systems, or high percentages <strong>of</strong> developed areas treated withBMPs capable <strong>of</strong> removing pollution levels to those representing natural systems.LOS B: Net load equivalent tobetween 20 and 40% <strong>of</strong> untreatedsingle family residential areas. LOSequal to B would indicate thepresence <strong>of</strong> BMPs with removalefficiencies consistent with thoserepresenting adequately designedand maintained conditions and arelatively even mix <strong>of</strong> developedand natural land uses.LOS C: Net load equivalent tobetween 40 and 70% <strong>of</strong> untreatedsingle family residential areas. LOSequal to C would indicate the presence <strong>of</strong> treatment systems showing removalefficiencies consistent with those representing average to poorly maintained conditionsand a greater percentage <strong>of</strong> developed versus natural land uses.LOS D: Net load equivalent to between 70 and 100% <strong>of</strong> untreated single familyresidential areas. LOS equal to D would indicate minimal treatment <strong>of</strong> sub-basindischarges and relatively high percentage <strong>of</strong> developed land uses.LOS F: Net load equal to or greater than 100% <strong>of</strong> untreated single family residentialareas. LOS equal to F would indicate no treatment for sub-basin discharges, or thepresence <strong>of</strong> extensive areas <strong>of</strong> land uses producing larger pollution loads per unit areathan typical residential land uses.Although there are some stormwater treatment areas in the watershed, many subbasinsreceived D or F for nitrogen and phosphorus loading, mainly because <strong>of</strong> intenseurbanization, increased imperviousness, and the lack <strong>of</strong> regional stormwater treatmentfacilities. The model results were also assessed by comparing the predicted loadingrates with the calculated values <strong>of</strong> loading rates obtained from discharge data recordedat specific stations and pollutant concentrations measured at nearby locations. Basedon these comparisons the loading model appears to estimate loads within reasonableaccuracy for isolated drainage areas where there are no extraneous factors that affectflow (e.g., dams, surface water withdrawals, etc.). An example <strong>of</strong> this is BlackwaterCreek where few significant changes in land use have occurred over the last ten yearsand there are no major control structures that affect the flow <strong>of</strong> surface waters.8 <strong>Hillsborough</strong> River <strong>Water</strong>shed Management Plan
Working Together for a Healthy <strong>Water</strong>shedEvaluation <strong>of</strong> Natural SystemsThe <strong>Hillsborough</strong> River watershed supports a diversity <strong>of</strong> natural resources includingimportant habitats and wildlife species. However, fragmentation <strong>of</strong> contiguous forestsand riparian corridors has resulted in significant declines in wildlife populations and anoverall decline in ecosystem health. The loss <strong>of</strong> natural systems can result in otheradverse effects includingdeclining water quality,increases in run<strong>of</strong>f volumeand timing, and the lack <strong>of</strong>recreational areas. RecentHistoric VegetationExisting LanduseNaturalSystemEvaluationPublicly Owned LandHabitat Fragmentation Riparian Habitat Strategic Conservation Arearesearch has shown that withas little as 10%imperviousness (developedroads, buildings, parking lots,etc.) in a watershed, dramaticdeclines in biological healthcan occur as a result <strong>of</strong>changes in channelmorphology, hydrologicregimes, habitat quality, andwater quality.One <strong>of</strong> the key objectives <strong>of</strong>this study was to identifyopportunities to restore andprotect natural systems which are important in preventing excessive run<strong>of</strong>f volumes andpollutant loads, maintaining terrestrial and aquatic biodiversity, protecting streamchannel stability, and reducing stream bank erosion. The first step toward this goal wasto identify and describe historical and existing natural systems. A description <strong>of</strong> keyfactors which influence ecosystem health were described and evaluated to assess andrank each <strong>of</strong> the subwatersheds using an evaluation matrix. Finally, significant issuesand areas <strong>of</strong> concern for specific habitat types were evaluated and specific restorationefforts were recommended.The parameters used in the evaluation matrix included the following:• Habitat fragmentation: represents the extent to which existing natural habitat arefragmented within a given subwatershed.• Riparian Buffer Rating: represents a numerical score based on the percent <strong>of</strong> intactriparian habitat within various distances from creeks, streams, and rivers.• Percent <strong>of</strong> existing natural systems: represents the percent <strong>of</strong> remaining naturalhabitat for a subwatershed.9 <strong>Hillsborough</strong> River <strong>Water</strong>shed Management Plan
EXECUTIVE SUMMARY• Exotic Vegetation (presence/absence): indicates the presence or absence <strong>of</strong>significant coverages <strong>of</strong> exotic vegetation based on field surveys <strong>of</strong> the watershed,primarily by low-level aerial overflights. Several species which have easilyidentifiable signatures were selected during the overflights (Brazilian pepper trees,Australian pine trees, Melaleuca, cogon grass, air potato).• Strategic Habitat Conservation Areas: represents the percentage <strong>of</strong> strategicwildlife habitat contained within a subwatershed.Regions<strong>Hillsborough</strong> RiverNear Crystal SpringsSub-<strong>Water</strong>shedsHabitat FragmentationRiparian Buffer RatingPercent <strong>of</strong> <strong>Water</strong>shedas Natural HabitatExotic VegetationObservedPercent <strong>of</strong> <strong>Water</strong>shedIdentified as StrategicHabitat ConservationAreaPercent <strong>of</strong> <strong>Water</strong>shedunder Public Ownership<strong>Hillsborough</strong> River Above Crystal Springs 1 n/a 2 3 0 2 3 CBig Ditch 0 n/a 1 0 0 2 0 FIndian Creek 0 n/a 1 3 1 0 3 DHydrologic AlterationsScoreBlackwater CreekBlackwater Creek 1 3 2 3 1 2 2 CItchepackesassa Creek 0 2 1 0 0 2 1 DEast Canal 0 1 3 0 0 1 1 DTiger Creek 0 1 0 0 0 3 1 D• Public Ownership: represents the percent <strong>of</strong> lands in public ownership for thepurposes <strong>of</strong> conservation within a subwatershed.• Hydrologic Alterations: represents the extent <strong>of</strong> drainage alterations that haveoccurred within a subwatershed. Such alterations include drainage ditches,berms/levees, dams, dredge and/or filling <strong>of</strong> waterways and wetlands.Percentages <strong>of</strong> land area within a subwatershed affected by hydrologic alterationswere estimated using digital orthophotography and aerial overflights.An overall score was calculated for eachsubwatershed based on the sum <strong>of</strong>scores for each parameter (see matrixabove). Following a scoring techniquesimilar to the water quality level <strong>of</strong>service evaluation, these total scoreswere normalized in to ratios obtained bydividing the total subwatershed score bythe maximum possible score. Eachsubwatershed was then given a gradebased on the following:1.0 to 0.8 = A, 0.79 to 0.6 = B, 0.59 to 0.4 = C, 0.39 to 0.20 = D,
Working Together for a Healthy <strong>Water</strong>shedDevelopment <strong>of</strong> AlternativesIn order to provide “true”watershed management, bestmanagement practices mustcombine water quality andnatural systems benefits withflooding problem solutions.Utilizing upstream areas toprovide regional attenuationfacilities prior to improvingdownstream conveyancesystems provide one method <strong>of</strong>accomplishing this goal.An example <strong>of</strong> such a concept can be demonstrated by the conceptual project shownhere. This alternative is designed to attenuate flood water, provide water qualitytreatment by increasing the retention time, create and restore wetland habitat, and helpin groundwater recharge through percolation. During development <strong>of</strong> alternatives forthe <strong>Hillsborough</strong> River <strong>Water</strong>shed this philosophy was maintained and whereverpossible projects with multiple benefits were recommended.To facilitate locating undeveloped/open lands for construction <strong>of</strong> flood storage andwater quality treatment ponds, GIS land use and soils data were used to identify themost suitable and cost-effective sites within each subwatershed. During this process,the undeveloped land, excluding water bodies and wetlands were intersected withhydrologic group A, B, C, and D soils. Using the maps and known flood problem areas,specific locations <strong>of</strong> storage ponds were identified and evaluated in the field.A similar methodology to the above was used to identify potential wetland restorationareas within the <strong>Hillsborough</strong> River watershed. Since a large portion <strong>of</strong> thenortheastern region <strong>of</strong> the watershed (including the Cone Ranch area) is relativelyundeveloped, opportunities for riparian, wetland, and upland restoration <strong>of</strong> existingagricultural areas are extensive. Restoration and conservation activities in these areasare expected to be more cost-effective and viable than in urbanized regions such as the<strong>Tampa</strong> Bypass Canal area. For this analysis, agricultural and undeveloped land,excluding water bodies and wetlands, were intersected with hydrological group D soilsto identify those areas most conducive to wetland restoration. These areas were furtherrefined to identify potential riparian buffer restoration within 730 feet (223 meters) <strong>of</strong> theexisting stream network. In addition, existing wetlands greater than 10 acres (4.05hectares) were intersected within a 98-foot (30-meter) buffer <strong>of</strong> the stream network toidentify potential hydrologic restoration <strong>of</strong> wetlands. Actual restoration site locationswere refined through the collection <strong>of</strong> ecological data, field verification, and ownershipinformation11 <strong>Hillsborough</strong> River <strong>Water</strong>shed Management Plan
EXECUTIVE SUMMARYThe results from thepollutant loading model wereintegrated with a spatialanalysis to further refine andprioritize areas <strong>of</strong> thewatershed most in need <strong>of</strong>water quality improvement.To facilitate this process, aseries <strong>of</strong> GIS analyses wereperformed to prioritize thesubbasins which are in need<strong>of</strong> stormwater treatment.The first step <strong>of</strong> this processwas to identify thosesubbasins that were in close proximity to the main stem and major tributaries <strong>of</strong> the riverand Bypass canal using a centroid analysis in Arc/Info. Subbasins closest to a tributarywere scored higher than those farther away.This data was combined with theLOS output data that hadidentified subbasins havingrelatively high loading values(poor level <strong>of</strong> service scores) fortotal nitrogen, total phosphorus,and total suspended solids.Those subbasins identified in redare the highest priority areas forstormwater treatment, followed byareas in yellow, green, blue, andwhite. A number <strong>of</strong> stormwatertreatment alternatives have beendeveloped for these priority areasto reduce pollutant loads.Cost estimates for flooding and water quality alternatives were calculated based on acost per item basis for each. Excavation quantities were determined as the volume <strong>of</strong>storage needed. For alternative items that are not listed as individual pay items, suchas channel maintenance, a cost per unit was calculated as a product <strong>of</strong> its constituentpay items. Land values were calculated from a GIS layer created from the <strong>Hillsborough</strong><strong>County</strong> Property Appraisers property boundaries map joined to the <strong>Hillsborough</strong> <strong>County</strong>Real Estate database <strong>of</strong> just market values. The just market value <strong>of</strong> each parcel wasdivided by the size (acres) <strong>of</strong> each parcel to develop a cost per acre GIS layer. Thecost per acre layer was intersected with undeveloped lands on hydrologic group A, B,and C soils and clipped within a one-quarter mile radius <strong>of</strong> each node location requiringa stormwater pond.12 <strong>Hillsborough</strong> River <strong>Water</strong>shed Management Plan
Working Together for a Healthy <strong>Water</strong>shedCost estimates for potential habitat restoration and water quality projects excavationwere estimated with GIS by calculating the volume <strong>of</strong> soil above the low range <strong>of</strong> thegroundwater table within a given area. Land values were estimated from the cost peracre GIS layer referenced above. The cost <strong>of</strong> potential restoration <strong>of</strong> existing wetlandsthrough rehydration was estimated as a cost per acre <strong>of</strong> the wetland area delineated inthe SWFWMD 1995 land use GIS layer.Evaluation <strong>of</strong> AlternativesEvaluation <strong>of</strong> preferred alternatives was performed using a two tiered approach. Initiallythe subwatersheds were ranked based on broad parameters which depict the overallconditions <strong>of</strong> the subwatersheds, such as severity <strong>of</strong> flooding, potential nitrogen loading,and current conditions <strong>of</strong> thenatural habitats. During thisanalysis flooding andenvironmental issues wereconsidered to be <strong>of</strong> equivalentimportance and were weightedequally. Flooding issues weremainly described by thenumber <strong>of</strong> flooding locations assimulated in the existingconditions model, and theenvironmental issues consisted<strong>of</strong> a combination <strong>of</strong> both waterquality and natural systemconditions within thesubwatershed. The analysisresulted in a prioritized ranking <strong>of</strong> the subwatersheds in order <strong>of</strong> the “criticality” <strong>of</strong> theoverall existing conditions.Subsequently the proposedalternatives were evaluatedusing a consistent and unifiedapproach, independent <strong>of</strong> the“criticality” <strong>of</strong> the individualsubwatersheds. At this stepthe impact <strong>of</strong> each alternativewas evaluated individuallybased on a predetermined set<strong>of</strong> parameters, and thealternatives were scoredindependently using a predefinedmethodology. Several different parameters were used to evaluate the potentialimpact <strong>of</strong> the proposed projects including the net change in level <strong>of</strong> service for flooding,water quality, and natural systems, and impact on water supply/groundwater conditions.13 <strong>Hillsborough</strong> River <strong>Water</strong>shed Management Plan
EXECUTIVE SUMMARYThe feasibility <strong>of</strong> implementation was evaluated by another set <strong>of</strong> parameters such aspublic acceptance, permittability, constructability, and project cost. The analysisresulted in overall scores for each individual alternative, which was multiplied by thecriticality factor for the purpose <strong>of</strong> determining the priority <strong>of</strong> implementation <strong>of</strong> therecommended projects.Recommended AlternativesBased on the scoresobtained from theevaluation matrix, a total<strong>of</strong> 54 projects wererecommended toimprove flooding andwater quality conditions,and restore/enhancenatural systemsconditions in the<strong>Hillsborough</strong> River-<strong>Tampa</strong> Bypass Canal<strong>Water</strong>shed. Out <strong>of</strong> atotal <strong>of</strong> 54 projects 32projects wererecommended primarilyas flood controlalternatives withsecondary benefits <strong>of</strong> water quality and natural system benefits. Remaining 22 projectswere developed specifically for enhancement <strong>of</strong> water quality and natural systems.These projects were summarized in project fact-sheets (as shown here) with allpertinent information, including a location map created using digital orthoquads. Thelong tern maintenance needs were also identified for conveyance systems and wereincluded in the recommendedproject fact sheets.Finally the recommended projectswere incorporated in thehydrologic/hydraulic model andpollutant loading model todetermine the overall change inLOS for flooding and water qualityconditions. The change in floodingLOS is shown here as “before andafter” project implementation.14 <strong>Hillsborough</strong> River <strong>Water</strong>shed Management Plan
Working Together for a Healthy <strong>Water</strong>shedPublic InvolvementThe public involvement program for the <strong>Hillsborough</strong> River <strong>Water</strong>shed ManagementStudy was geared to inform citizens, groups, and organizations about decisions thatwere made regarding theirwatershed and as a way to ensureall views were considered in theplanning and decision making.During the course <strong>of</strong> the study, thecounty and the project team <strong>of</strong>fereda variety <strong>of</strong> ways to capture thepublic’s interest and give them theinformation they need to understandto be able to provide constructivefeedback.Three separate public meetingswere held at various locationsthroughout the watershed duringthe course <strong>of</strong> the study. Thepurpose <strong>of</strong> the first public meeting was to inform the public about the objectives <strong>of</strong> thestudy, share information regarding the existing conditions <strong>of</strong> the watershed, and receivefeedback on specific issues and concerns.The third public meeting was conducted toprovide the public with the information onthe recommended alternatives selected bythe project team to address significantflooding, water quality, and natural systemsissues. The feedback received from thepublic as well as other civic organizationsduring these meetings were incorporatedthroughout the study.The second public meeting was conducted toprovide the public with the results <strong>of</strong> theexisting conditions analysis and alternativesdeveloped to address significant flooding,water quality, and natural systems issues.The information was presented in the form <strong>of</strong>a video presentation, which was followed bya poster-board session and question andanswer session. As in the first meeting, theattendees were invited to provide oral andwritten comments to the project team.15 <strong>Hillsborough</strong> River <strong>Water</strong>shed Management Plan
EXECUTIVE SUMMARYA project web site was created and maintained throughout the duration <strong>of</strong> the study.The web page gave the public information about the project, the schedule, who tocontact, maps, and a comment form that could be filled out and submitted.16 <strong>Hillsborough</strong> River <strong>Water</strong>shed Management Plan
CHAPTER 1INTRODUCTION1.1 Project Location and DescriptionThe <strong>Hillsborough</strong> River and <strong>Tampa</strong> Bypass Canal <strong>Water</strong>sheds are located in <strong>Hillsborough</strong> <strong>County</strong>in west central Florida. The overall, combined watershed contains approximately 637 square miles<strong>of</strong> which 220 square miles lies within unincorporated <strong>Hillsborough</strong> <strong>County</strong> (Figure 1.1.1). Thepurpose <strong>of</strong> the study was to develop a <strong>Water</strong>shed Management Plan to address four mainobjectives including flood control, water quality, natural systems, and water supply conditions.<strong>Hillsborough</strong> RiverThe headwaters <strong>of</strong> the <strong>Hillsborough</strong> River arelocated in the Green Swamp area <strong>of</strong> Pasco<strong>County</strong>. From that point, the river meanders forapproximately 45 miles through the northeasternpart <strong>of</strong> the county and the cities <strong>of</strong> TempleTerrace and <strong>Tampa</strong> before discharging into<strong>Tampa</strong> Bay. The first recorded charting <strong>of</strong> theriver was completed over 240 years ago in 1757by Don Francisco, pilot <strong>of</strong> the Spanish RoyalFleet. A journal documenting his surveying andcharting efforts was found in the SpanishGovernments archives for the Indies by Dr.Charles Arnade <strong>of</strong> the University <strong>of</strong> SouthFlorida.Twenty major tributaries contribute to the flow <strong>of</strong> the river, draining residential, commercial, andagricultural lands from as far away as Zephyrhills and Lakeland. A listing <strong>of</strong> the tributaries thatcontribute to the flow <strong>of</strong> the river includes the following named streams: Basset Branch, Big Ditch,Blackwater Creek, Clay Gully East, Clay Gully West, Cow House Creek, Curiosity Creek, CypressCreek, East Canal, Fish Hatchery Drain, Hollomans Branch, Indian Creek, Itchepackesassa Creek,Lake Thonotosassa/Flint Creek, New River, Port Lonesome Ditches, Tiger Creek, Trout Creek,Two Hole Branch and the Zephyrhills Drain.<strong>Tampa</strong> Bypass CanalThe <strong>Tampa</strong> Bypass Canal is a man-made canal system with several flowcontrol structures to provide flood relief. The canal originates near the<strong>County</strong>’s Trout Creek Park north <strong>of</strong> Morris Bridge Road and is joined by asecond diversion canal originating near Harney Road. The main canaldischarges into the Palm River approximately 2.5 miles upstream <strong>of</strong> theriver’s mouth at McKay Bay. The total distance <strong>of</strong> the canal is approximately 13 miles with widths1-1 <strong>Hillsborough</strong> River <strong>Water</strong>shed Management Plan
Location MapNWESN.T.S.Source:Derived from SWFWMD GISCartographic Coverages andDeLorme 3-D TopoQuads<strong>Hillsborough</strong> River <strong>Water</strong>shed Management Plan<strong>Hillsborough</strong> River <strong>Water</strong>shed Location MapFigure1.1.1
CHAPTER 1ranging from 200 to 400 feet and a depth <strong>of</strong> 20 feet at its deepest point near McKay Bay. As a result<strong>of</strong> significant flooding <strong>of</strong> areas located along the lower <strong>Hillsborough</strong> River in 1959 and 1960 duringHurricane Donna, local residents petitioned the federal and state governments for relief. As aresult, the state created the Southwest Florida <strong>Water</strong> Management District in 1961, charged withfinding a way to prevent future floods. Authorization by Congress to construct the canal was givenin 1962 and the canal was completed 20 years later in 1982. The <strong>Tampa</strong> Bypass Canal wasconstructed as part <strong>of</strong> the Four Rivers Basins projects which included the <strong>Hillsborough</strong>,Withlacoochee, Peace, and Oklawaha Rivers. The Harney Canal was constructed to provideadditional flood relief associated with significant flows from Cypress Creek.Small man-made ditches drain run<strong>of</strong>f from approximately 32.0 square miles <strong>of</strong> medium to highdensityresidential and commercial land use areas from U.S. 301 near Thonotosassa to just aboveS.R. 60 in Brandon. These ditches collect the run<strong>of</strong>f from the areas <strong>of</strong> Falkenburg Road, LakeMango, Williams Road, and Vandenberg Airport. An additional area in the northeast portion <strong>of</strong> the<strong>Tampa</strong> Bypass Canal watershed consists <strong>of</strong> depressional areas (sinkholes) that act as closedbasins and do not directly contribute run<strong>of</strong>f to the canal.1.2 Current Management <strong>of</strong> the <strong>Water</strong>shedThe Southwest Florida <strong>Water</strong> Management District (SWFWMD) manages a large portion <strong>of</strong> theriver and its associated floodplain as the Lower <strong>Hillsborough</strong> Flood Detention Area for the purposes<strong>of</strong> flood control. The river is also the primary source <strong>of</strong> drinking water for the <strong>City</strong> <strong>of</strong> <strong>Tampa</strong>, whichhas constructed a dam on the lower reaches <strong>of</strong> the river to serve as a reservoir for that purpose.Class I (potable – suitable for drinking water supply) waters exist south <strong>of</strong> Flint Creek to the damand in Cow House Creek between the river and the creek’s source. The majority <strong>of</strong> the waters inthe watershed are classified as Class III waters and are designated for recreation and thepropagation and maintenance <strong>of</strong> a healthy, well balanced population <strong>of</strong> fish and wildlife. In addition,the portions <strong>of</strong> the river north <strong>of</strong> Fletcher Avenue to the headwaters in the Green Swamp have beendesignated as Outstanding Florida <strong>Water</strong>s (OFW). This designation includes the tributaries <strong>of</strong>Blackwater, Cypress, and Trout Creeks.Many government agencies and private groups have proposed ways to better utilize and protect thewatershed. The <strong>Hillsborough</strong> River Greenways Task Force is committed to developing solutionsand facilitating action plans within the upper <strong>Hillsborough</strong> Basin. The SWFWMD Surface <strong>Water</strong>Improvement and Management (SWIM) team has initiated several projects to improve water quality.The <strong>Tampa</strong> Bay National Estuary Program (NEP) sets goals for water quality in <strong>Tampa</strong> Bay. TheUnited States Army Corps <strong>of</strong> Engineers (USACOE), SWFWMD, the Florida Department <strong>of</strong>Environmental Protect (FDEP), and the <strong>Hillsborough</strong> <strong>County</strong> Environmental Protection Commission(EPC) all have various regulatory powers over the river and the watershed.1-3 <strong>Hillsborough</strong> River <strong>Water</strong>shed Management Plan
INTRODUCTION1.3 Climate <strong>of</strong> the <strong>Hillsborough</strong> River <strong>Water</strong>shedThe climate is considered humid subtropical. Summers are warm and humid; however, duringsome months some areas <strong>of</strong> this region may fall below 64 degrees F, which makes this area humidsubtropical versus tropical. Typical evaporation in the watershed ranges from 60 to 70 inches andthe average rainfall is 52 inches per year. By plotting typical rainfall and evaporation versus time inmonths, and considering soil moisture utilization, the water budget would suggest a waterdeficiency from January through June and a water surplus from June through October during therainy season.Drought in the region has not been uncommon, asevidenced by below normal rainfall between 1999 and 2001.This severe lack <strong>of</strong> rainfall has resulted in critical watersupply conditions for the <strong>Tampa</strong> Bay area. Many measures<strong>of</strong> drought have been devised with the most commonlyused measure being the Palmer Drought Severity Index orPDSI. The index extends from positive 6 to negative 6. Avalue <strong>of</strong> zero represents near normal conditions. Values <strong>of</strong>-2 to -3 indicate moderate drought, -3 to -4 is severedrought, values beyond this represent extreme drought.According to the National Oceanic and AtmosphericAdministration (NOAA), the <strong>Tampa</strong> Bay area wasconsidered to be in a severe drought based on the PDSIfrom May 27 to July 29, 2000. As <strong>of</strong> August 12, 2000,NOAA has estimated that up to 12 inches <strong>of</strong> rainfall will berequired to bring the PDSI up to near normal conditions. Other record lows for the <strong>Hillsborough</strong>River have occurred in 1962 and 1977 which were at 8.6 and 6.6 inches deep at <strong>Hillsborough</strong> RiverState Park. Low flows can increase salt-water intrusion, increase health hazards due to increasedconcentration <strong>of</strong> toxic substances, and curtail recreational opportunities. Therefore, the balance <strong>of</strong>providing adequate flood control through both structural and nonstructural measures andconserving water to meet the region’s water supply budget is critical.1.4 Historical FloodingDocumented flood events in the watershed date back as far asthe early 1800s to as recent as El Nino during 1997 and 1998.Flooding has typically occurred as a result <strong>of</strong> hurricanes andtropical storms that bring significantly high tides, rainfall, or acombination there<strong>of</strong>. Storm surges on the Gulf Coast <strong>of</strong> Floridacan be expected to be higher than on the east coast for storms<strong>of</strong> equal intensity due to the gentle slope <strong>of</strong> the Gulf sea floor.Rainfall along the Gulf coast during a hurricane can range from1-4 <strong>Hillsborough</strong> River <strong>Water</strong>shed Management Plan
CHAPTER 15 to 12 inches over the affected area, with the greatest amount occurring over the front quadrant <strong>of</strong>the hurricane. For the <strong>Hillsborough</strong> River, the minimum level <strong>of</strong> service for flood control will be for a25-year storm event which equates to approximately 8 inches <strong>of</strong> rainfall. For a 100-year event thetotal predicted rainfall is estimated at 11 inches.The National Weather Service has estimated the probability <strong>of</strong> a hurricane passing through the<strong>Tampa</strong> Bay area as 1 in 25, with the highest probability occurring in Miami at 1 in 6. Some <strong>of</strong> thehistorical storm or hurricane events that have directly impacted the <strong>Tampa</strong> Bay area are outlined asfollows:• The Storm <strong>of</strong> 1848 was the largest documented storm event that has occurred to date in theregion where the tide rose to over 15 feet and Fort Brooke was devastated.• Hurricane <strong>of</strong> 1921 resulted in tides in excess <strong>of</strong> 10.5 feet with wind gusts <strong>of</strong> 100 mph. Thisevent had a significant impact on the outfall <strong>of</strong> the <strong>Hillsborough</strong> River.• Hurricane Easy in 1950, dumped 38.7 inches <strong>of</strong> rain in Yankeetown, located at the mouth <strong>of</strong>the Withlacoochee River. The excessive rainfall is believed to be due to the two completedloops the hurricane made around the area. Although not a direct impact to the <strong>Hillsborough</strong>River watershed, it documents the potential for significant amounts <strong>of</strong> rain in the region.• Hurricane Donna, which occurred in September 1960and made landfall south <strong>of</strong> the <strong>Tampa</strong> Bay area with a100 mile swath and 166 mph winds, that released over10 inches <strong>of</strong> rainfall within the <strong>Hillsborough</strong> River<strong>Water</strong>shed. The center <strong>of</strong> the storm passed betweenLakeland and Plant <strong>City</strong>. Significant flooding occurredin the Sulphur Springs and Temple Terrace areas <strong>of</strong><strong>Hillsborough</strong> <strong>County</strong>. As mentioned above, this eventtriggered the design and construction <strong>of</strong> the <strong>Tampa</strong>Bypass Canal which was completed during the earlyeighties.• El Nino, which occurred from September <strong>of</strong> 1997 through March <strong>of</strong> 1998, saturated thewatershed which resulted in significantly high water elevations for the river and its tributaries.Significant documentation through stream gages and the <strong>Hillsborough</strong> <strong>County</strong> EmergencyOperation Center (EOC) have documented both regional and local flooding areas within thewatershed.1-5 <strong>Hillsborough</strong> River <strong>Water</strong>shed Management Plan
INTRODUCTION1.5 Scope <strong>of</strong> the ProjectAyres Associates was retained by <strong>Hillsborough</strong> <strong>County</strong> to prepare the <strong>Hillsborough</strong> River<strong>Water</strong>shed Management Plan as a part <strong>of</strong> the <strong>County</strong>’s overall watershed management program.Several tributary systems to the <strong>Hillsborough</strong> River that were not included in the Management Planinclude Curiosity Creek, Cypress Creek and Pemberton Baker Creek. <strong>Water</strong>shed ManagementPlans for these basins are being prepared by other entities. The objective <strong>of</strong> this phase <strong>of</strong> the<strong>Water</strong>shed Management Plan was to describe the existing conditions <strong>of</strong> the watershed as theyrelate to water quantity and flooding by evaluating the Level-<strong>of</strong>-Service (LOS) provided to residents<strong>of</strong> the area. LOS designations were established by the <strong>County</strong> to provide a means <strong>of</strong> individuallyrating sub-basins <strong>of</strong> a major watershed with respect to flooding concerns.The process for developing the watershed management plan is outlined in the flow chart presentedbelow (Fig. 1.5.1). The project considers public input a high priority to allow for continuousfeedback on historical flooding, water quality, natural systems, and other related concerns in thewatershed. Opportunities to interact and communicate with the public are being accomplishedthrough public workshops (charettes) and a project website (www.hillsboroughriver.org) whichincludes a detailed on-line questionnaire.DataCollectionCitizen InputHydrologicConditionsHydraulicConditionsEnvironmentalConditionsEnvironmentalImpactsCalibration / VerificationLevel <strong>of</strong> ServiceAnalysisAlternativeSelectionCitizen Input&RegulatoryReviewRecommendationsFig. 1.5.1. <strong>Water</strong>shed Management Plan Development Process1-6 <strong>Hillsborough</strong> River <strong>Water</strong>shed Management Plan
CHAPTER 11.6 Background and Data CollectionTo properly describe the watershed area, a literature/data search was performed to compilerelevant available information. This data included previous studies, existing survey information,determinations <strong>of</strong> additional survey needs, land use and soils coverages, rainfall and streamflowdata, construction plan information, historical flooding documentation, and field investigations. Thefollowing is a brief listing <strong>of</strong> the agencies that were contacted for data:• <strong>Hillsborough</strong> <strong>County</strong>• Pasco <strong>County</strong>• Polk <strong>County</strong>• Southwest Florida <strong>Water</strong> Management District (SWFWMD)• <strong>Hillsborough</strong> <strong>County</strong> Environmental Protection Commission (HCEPC)• United States Army Corps <strong>of</strong> Engineers (USACOE)• <strong>City</strong> <strong>of</strong> <strong>Tampa</strong>• <strong>City</strong> <strong>of</strong> Temple Terrace• <strong>Tampa</strong> Bay <strong>Water</strong>• <strong>Tampa</strong> Bay National Estuary Program (NEP)• Florida Department <strong>of</strong> Transportation (FDOT)• Florida Department <strong>of</strong> Environmental Protection (FDEP)• Federal Emergency Management Agency (FEMA)• United States Geological Survey (USGS)1.7 Project ObjectivesThe objectives for this plan are to examine and analyze existing data, develop an accuratecharacterization <strong>of</strong> the watershed, and identify and develop alternatives and recommendations toimprove flood protection, water quality, natural systems, and water supply conditions using anintegrated, comprehensive approach. The overall goal <strong>of</strong> the plan will be to provide solutions thatgive appropriate consideration <strong>of</strong> habitat conservation, hydrology, land use, regulatory processes,flood control, soil conservation, water quality improvement, water use, economics, and overallcommunity objectives.Specific objectives <strong>of</strong> the management plan for each <strong>of</strong> the major areas <strong>of</strong> interest include thefollowing:Flood Control• provide effective flood control protection for public and private property by identifying floodproblem areas and assign levels <strong>of</strong> service for existing and future conditions• investigate and inventory existing drainage and stormwater management system using a1-7 <strong>Hillsborough</strong> River <strong>Water</strong>shed Management Plan
INTRODUCTIONGeographic Information System• recommend projects that meet the level <strong>of</strong> service by integrating flood control, water quality, andecological protection, and restoration objectives<strong>Water</strong> Quality• analysis <strong>of</strong> historical and recent trends in water quality using available data• identification <strong>of</strong> data gaps and collection <strong>of</strong> additional data to characterize water quality intributaries currently not monitoring• development <strong>of</strong> a water quality model to identify areas which have the potential to contributesignificant pollutant loads to surface waters• identification <strong>of</strong> water quality treatment levels <strong>of</strong> service for existing and future conditions• describe how current developed areas may be managed for improved water quality• describe how new urban development may be designed for improved water quality]• development <strong>of</strong> alternatives which strategically target regions with high pollutant loadingpotential and, if feasible, integrate water quality improvement with flood protectionNatural Systems• analysis <strong>of</strong> historical and recent trends in natural land cover for the watershed• identification <strong>of</strong> protected species, their habitats, and methods for improved conservation <strong>of</strong>lands for their continued survival• identification and analysis <strong>of</strong> existing riparian habitats, conservation areas, habitatfragmentation, and hydrologic alterations• identification <strong>of</strong> indicators and measures <strong>of</strong> habitat quality• development <strong>of</strong> alternatives that integrate habitat restoration/preservation/conservation withflood protection and water quality improvements<strong>Water</strong> Supply• analysis <strong>of</strong> trends in water use and identification <strong>of</strong> significant water use categories in thewatershed• identification <strong>of</strong> ongoing programs to improve water management and water supplies• development <strong>of</strong> alternatives which consider water supply needs for the area1-8 <strong>Hillsborough</strong> River <strong>Water</strong>shed Management Plan
CHAPTER 2GENERAL DESCRIPTIONThe <strong>Hillsborough</strong> River <strong>Water</strong>shed (HRW) encompasses the main river and associated tributariesand the <strong>Tampa</strong> Bypass Canal (TBC) and it’s tributaries. The twelve major creeks and streams thatdrain directly to the river are considered subwatersheds. There are an additional foursubwatersheds contributing to the TBC. The subwatersheds sharing geographic or hydraulicsimilarities (e.g., converge at a common point) have been grouped together in six regions for thepurpose <strong>of</strong> discussion. The regions are as follows:• Crystal Springs• Blackwater Creek• Central Tributaries• Northwestern Tributaries• <strong>Hillsborough</strong> River• TBC and TributariesThe regions are comprised <strong>of</strong> between three and five distinct subwatersheds. Figure 2.1.1illustrates the location <strong>of</strong> the six regions within the overall watershed. The regions are presentedthroughout the rest <strong>of</strong> this report in the order in which they discharge to the river from upstream todownstream.2.1 ClimateThe HRW is located in northeastern <strong>Hillsborough</strong>, southern Pasco, and western Polk Counties.The climate in these areas can be classified as subtropical with average rainfall depths <strong>of</strong>approximately 50 inches per year. This area <strong>of</strong> west central Florida experiences a wet seasonextending from June to September with temperatures ranging between 70 to 90º F during thisperiod. Also common during these months are late afternoon thunderstorms <strong>of</strong> high intensity andshort duration.2.2 TopographyThe topography <strong>of</strong> the overall HRW can be classified as relatively flat. The highest parts <strong>of</strong> thewatershed (approximate elevation 225 feet NGVD) occur in Polk <strong>County</strong> at the eastern extents <strong>of</strong>the Blackwater and Itchepackesassa Creeks. The lowest portions <strong>of</strong> the watershed, at anapproximate elevation <strong>of</strong> 5 feet NGVD, occur at the downstream extents <strong>of</strong> the TBC andFalkenburg Areas. The topography <strong>of</strong> the river itself varies in elevation from approximately 85 feetNGVD near its headwaters to 25 feet NGVD near the downstream boundary at the <strong>Tampa</strong> Dam.The six regions <strong>of</strong> the HRW described above are comprised <strong>of</strong> varying numbers <strong>of</strong> subwatershedsthat share common topographic characteristics. Plots <strong>of</strong> the topography within each region can beseen in Figures 2.2.1 through 2.2.6.2-1 <strong>Hillsborough</strong> River <strong>Water</strong>shed Management Plan
NWE.-, 75 .-, 75.-, 4 .-,275(/ 41 (/ 98 (/ 98NorthwestTributaries RegionCrystal SpringsRegionSN.T.S.ôó 39ø÷ 301ôó 54 ø÷ 301 ôó 60 ôó 39TBC andTributariesRegion<strong>Hillsborough</strong>River RegionCentralTributariesRegion.-, 4ø÷ 579 BlackwaterCreek Region.-, 4(/ 92LegendRegional BoundaryMajor Roads<strong>Hillsborough</strong> River <strong>Water</strong>shed Management Plan<strong>Hillsborough</strong> River <strong>Water</strong>shed Regional DivisionsFigure2.1.1
<strong>Hillsborough</strong> River aboveCrystal SpringsLegendCrystal Springs Region BoundarySub-watershed BoundariesRegion Topography (10ft contour intervals)455565758595105115125135145155165175185195205215225Indian CreekWNSN.T.S.ESource:Derived fromSWFWMD GIStopography coverage.Big Ditch<strong>Hillsborough</strong> River <strong>Water</strong>shed Management PlanTopography <strong>of</strong> the Crystal Springs RegionFigure2.2.1
Blackwater CreekNWESN.T.S.Tiger CreekSource:Derived fromSWFWMD GIStopography coverage.LegendBlackwater Creek Region BoundarySub-watershed BoundariesRegion Topography (10ft contour intervals)455565758595105115125135145155165175185195205215225235245East CanalItchepackesassaCreek<strong>Hillsborough</strong> River <strong>Water</strong>shed Management PlanTopography <strong>of</strong> the Blackwater Creek RegionFigure2.2.2
Clay Gully EastTwo Hole BranchWNESN.T.S.Source:Derived fromSWFWMD GIStopography coverage.LegendCentral Tributaries Region BoundarySub-watershed BoundaryRegion Topography (10ft contour intervals)35455565758595105115Hollomans Branch<strong>Hillsborough</strong> River <strong>Water</strong>shed Management PlanTopography <strong>of</strong> the Central Tributaries RegionFigure2.2.3
WNESource:Derived fromSWFWMD GIStopography coverage.New RiverSN.T.S.Trout CreekClay Gully WestBassett BranchLegendNorthwestern Tributaries Region BoundarySub-watershed BoundariesRegion Topography (10ft contour intervals)30130401405015060160701708018090190100200110210120<strong>Hillsborough</strong> River <strong>Water</strong>shed Management PlanTopography <strong>of</strong> the Northwestern Tributaries RegionFigure2.2.4
Legend<strong>Hillsborough</strong> River Region BoundarySub-watershed BoundariesRegion Topography (10ft contour intervals)152535455565758595105WNSN.T.S.Source:Derived fromSWFWMD GIStopography coverage.E<strong>Hillsborough</strong> Riverbelow S-155<strong>Hillsborough</strong> Riverabove S-155<strong>Hillsborough</strong> River <strong>Water</strong>shed Management PlanTopography <strong>of</strong> the <strong>Hillsborough</strong> River RegionFigure2.2.5
Cow House CreekNVandenburg AreaWESN.T.S.<strong>Tampa</strong> By-pass CanalSource:Derived fromSWFWMD GIStopography coverage.Williams AreaMango AreaLegendTBC and Tributaries Region BoundarySub-watershed BoundariesRegion Topography (10ft contour intervals)5156575115125258513535954510555Falkenburg Area<strong>Hillsborough</strong> River <strong>Water</strong>shed Management PlanTopography <strong>of</strong> the TBC and Tributaries RegionFigure2.2.6
CHAPTER 22.3 SoilsThere are over 85 different types <strong>of</strong> soils located within the HRW. The Natural ResourceConservation Service (NRCS) has mapped these soil types in soil surveys for <strong>Hillsborough</strong>, Pasco,and Polk Counties. The Geographic Information Systems (GIS) soil coverages were obtained fromthe Southwest Florida <strong>Water</strong> Management District (SWFWMD).The soil types contained in the figures can be classified as belonging to one <strong>of</strong> four mainhydrologic soil groups. These groups are directly related to a soil’s run<strong>of</strong>f potential and arecommonly used in hydrologic modeling to predict infiltration rates and moisture capacity. The majorhydrologic soil groups are:• Group A soils (low run<strong>of</strong>f potential) are characterized as having high rates <strong>of</strong> both infiltrationand water transmission under all conditions. Examples <strong>of</strong> these soil types that are found withinthe HRW include Archbold, Candler, Fort Meade, Gainsville, Kendrick, Orlando, and Tavares.• Group B soils (moderately low run<strong>of</strong>f potential) are characterized as having only moderaterates <strong>of</strong> infiltration and water transmission when thoroughly wetted. There are no soils withinthe HRW that fall into this category.• Group C soils (moderately high run<strong>of</strong>f potential) are characterized as having low infiltration andwater transmission rates under wet conditions. Examples <strong>of</strong> these soil types that are foundwithin the HRW include Adamsville, Broward-Urban land, Cassia, Electra, Lochloosa,Narcoossee, Pomello, St. Augustine, and Zolfo.• Group D soils (high run<strong>of</strong>f potential) are characterized as having very slow infiltration and watertransmission rates under both wet and dry conditions. Anclote, Pompano, St. Johns, andWabasso are just a few examples <strong>of</strong> the many that can be found within the HRW.Soils can also have dual classifications such as A/D or B/D. A soil is assigned to two hydrologicgroups if part <strong>of</strong> the acreage is artificially drained and part is undrained. Areas that are artificiallydrained will show the characteristics <strong>of</strong> the first listed group, while the undrained portions show that<strong>of</strong> the second.2.3.1 Crystal SpringsThe GIS coverage <strong>of</strong> soil types for this region can be seen in Figure 2.3.1. Table 2.3.1 presents thepercentage by area <strong>of</strong> these soil types within the region. The prevailing soil type in this area isPomona, making up approximately 27% <strong>of</strong> the coverage. Of the other 72 soil types within thisregion, only two account for more than 4% <strong>of</strong> the area. The distribution <strong>of</strong> hydrologic groups forthese soils can be seen in Figure 2.3.2. The soils <strong>of</strong> this region are comprised <strong>of</strong> approximately15% type A, 12% type C, and 73% type D soils.2-9 <strong>Hillsborough</strong> River <strong>Water</strong>shed Management Plan
NWESN.T.S.Source: Derived from SWFWMD GISsoil coverages and SCS soil surveysCrystal Springs Region BoundaryRegion Soil TypesAdamsvilleChobeeAnclote-Tavares-Pomello DelrayApopkaEatonArchboldEauGallieArentsEayGallieArents-Urban landElectraArredondoElectra variantAstatulaFeldaBasingerFlemington VariantBlichtonFloridanaBradentonFort MeadeCandlerGainesvilleCassiaGypsum landHaplaquentsHolopawHontoonHydraquentsImmokaleeKaligaKanapahaKendrickLakeLochloosaLynneMalabarMillhopperLegendTavaresTavares-Urban landUdorthentsUrban LandUrban landValkariaVeroWabasso<strong>Water</strong>WauchulaWinderZephyrZolfoPlacid-MyakkaPomelloPomonaPomona-Urban landPompanoQuartzipsammentsSamsulaSellersSmyrnaSmyrna-MyakkaSparrSt. Augustine-Urban landSt. Johns<strong>Hillsborough</strong> River <strong>Water</strong>shed Management PlanSoil Types in the Crysta Springs RegionMyakkaMyakka-Immokalee-Urban landNarcoosseeNeilhurstNewnanNobletonOkeelanta-Terra CeiaOnaPaisleyPalmetto-Zephyr-SellersPinedaPitsPits, dumpsNOTE: Soil Surveys for differentcounties use different soil descriptions.Figure2.3.1
Table 2.3.1 Soil Coverage <strong>of</strong> theCrystal Springs RegionSoil Description Area (Ac.) Percent Area Hydrologic Soil GroupAdamsville 663.3 1.96 CAnclote-Tavares-Pomello 54.4 0.09 DApopka 162.2 0.27 AArchbold 12.2 0.02 AArents 388.7 1.28 DArents-Urban land 2.1 0 CArredondo 1357.9 2.26 AAstatula 211.2 0.35 ABasinger 1397.1 2.32 DBlichton 139.2 0.23 DBradenton 239.7 0.4 DCandler 79 0.13 ACassia 82.2 0.14 CChobee 5079.5 8.44 DDelray 43.3 0.07 DEaton 1303.2 2.17 DEayGallie 1336.1 2.22 DElectra 9 0.01 CElectra variant 1076.1 1.79 CFelda 1313.1 2.18 DFlemington Variant 25.9 0.04 DFloridana 1430.9 2.38 DFort Meade 79.4 0.13 AGainesville 70.9 0.12 AGypsum land 559.8 0.93 DHaplaquents 103.8 0.17 DHolopaw 726 1.21 DHontoon 17.3 0.03 DHydraquents 8.2 0.01 DImmokalee 76.2 0.13 DKaliga 347.1 0.58 DKanapaha 17.4 0.03 DKendrick 713.8 1.19 ALochloosa 453.7 0.75 CLynne 188.2 0.31 DMalabar 287.6 0.48 DMillhopper 1089.3 1.81 AMyakka 2011.7 3.34 DMyakka-Immokalee-Urban land 3 0.01 DNarcoossee 198.5 0.33 CNeilhurst 18 0.03 ANewnan 154.4 0.26 CNobleton 348.5 0.58 COkeelanta-Terra Ceia 6.9 0.01 DOna 98.9 0.16 DPaisley 175.2 0.29 DPalmetto-Zephyr-Sellers 972.1 1.62 DPineda 42.4 0.07 D
Table 2.3.1 Soil Coverage <strong>of</strong> theCrystal Springs RegionSoil Description Area (Ac.) Percent Area Hydrologic Soil GroupPits, dumps 89.6 0.14 DPlacid-Myakka 244.1 0.41 DPomello 156.4 0.26 CPomona 16039.7 26.65 DPomona-Urban land 8.1 0.01 DPompano 46.5 0.08 DQuartzipsamments 175.2 0.29 DSamsula 197.6 0.33 DSellers 1011.1 1.68 DSmyrna 179.3 0.3 DSmyrna-Myakka 1612.1 2.68 DSparr 2620.5 4.35 CSt. Augustine-Urban land 1.9 0 CSt. Johns 27.9 0.05 DTavares 3067.9 5.1 ATavares-Urban land 2047 3.4 AUdorthents 28.3 0.05 DUrban Land 143.6 0.24 DValkaria 21.7 0.04 DVero 2091 3.47 DWabasso 638.4 1.06 DWauchula 1615.3 2.68 DWinder 96 0.16 DZephyr 1175.2 1.95 DZolfo 741.8 1.23 C<strong>Water</strong> 940.4 1.56 NA
LegendCrystal Springs Region BoundaryRegional Hydrologic Soil GroupACDWNSN.T.S.ESource:Derived fromSWFWMD GISsoil coveragesand SCS soilsurveys<strong>Hillsborough</strong> River <strong>Water</strong>shed Management PlanHydrologic Soil Groups in the Crystal Springs RegionFigure2.3.2
GENERAL DESCRIPTION2.3.2 Blackwater CreekFigure 2.3.3 presents the coverage <strong>of</strong> soil types for this region. Table 2.3.2 lists the soil types bypercentage found within the region. The prevailing soil types in this area are Myakka and Pomona,accounting for approximately 28% <strong>of</strong> the area. Each <strong>of</strong> the remaining 66 soil types contributes lessthan 5% to the coverage. The distribution <strong>of</strong> hydrologic groups for these soils can be seen inFigure 2.3.4. The soils <strong>of</strong> this region are comprised <strong>of</strong> approximately 12% type A, 10% type C, and78% type D soils.2.3.3 Central TributariesCoverages <strong>of</strong> soil types for this region can be seen in Figure 2.3.5. The prevailing soil type in thisarea is Myakka, making up approximately 42% <strong>of</strong> the coverage. Basinger type soils are also fairlyprevalent, accounting for approximately 18% <strong>of</strong> the area. This can be seen in Table 2.3.3, whichpresents soil percentages by area within the region. The distribution <strong>of</strong> hydrologic groups in thisarea is illustrated in Figure 2.3.6. The soils <strong>of</strong> this region are classified as approximately 6% typeA, 9% type C, and 85% type D soils.2.3.4 Northwestern TributariesFigure 2.3.7 illustrates the coverage <strong>of</strong> soil types for this region. Table 2.3.4 presents thepercentage by area <strong>of</strong> these soil types in this area. The prevailing soil types in this region areEauGallie, Myakka, and Pomona, which account for approximately 50% <strong>of</strong> the area. Theremaining coverage area is fairly evenly distributed among the other 43 soil types in this region.The distribution <strong>of</strong> hydrologic groups for these soils can be seen in Figure 2.3.8. The soils <strong>of</strong> thisregion are comprised <strong>of</strong> approximately 2% type A, 10% type C, and 88% type D soils.2.3.5 <strong>Hillsborough</strong> RiverThe regional distribution <strong>of</strong> soil types for this area can be seen in Figure 2.3.9. The prevailing soiltype in this region is Chobee, which accounts for approximately 23.5% <strong>of</strong> the region’s area. TheMyakka and Winder soil types account for an additional 25.6% <strong>of</strong> the area. The area weighteddistribution <strong>of</strong> soil types can be seen in Table 2.3.5. Figure 2.3.10 illustrates the coverage, byhydrologic group, <strong>of</strong> soils within the region. The soils <strong>of</strong> this region are classified as approximately22% type A, 6% type C, and 72% type D soils.2.3.6 TBC and TributariesThe prevailing soil type in this region is Candler as illustrated in Figure 2.3.11. Table 2.3.6 presentsthe soil types within the region by percentage. The GIS coverage <strong>of</strong> hydrologic soil groups can beseen in Figure 2.3.12. The soils <strong>of</strong> this region are classified as approximately 44% type A, 7% typeC, and 49% type D soils.2.4 Land Use/CoverageGIS land use coverages were obtained from SWFWMD for this project. This database, which waslast updated in 1995, is based on the Florida Land Use and Cover Classification System2-14 <strong>Hillsborough</strong> River <strong>Water</strong>shed Management Plan
Source: Derived from SWFWMD GISsoil coverages and SCS soil surveysNBlackwater Creek Region BoundaryRegional Soil TypesAdamsvilleAdamsville-Urban landApopkaArchboldArentsArents-Urban landArents-<strong>Water</strong>BasingerBradentonBroward-Urban landCandlerCandler-Urban landChobeeEatonEayGallieFeldaFloridanaFort MeadeFort Meade-Urban landGainesvilleGypsum landHaplaquentsHolopawHontoonHydraquentsImmokaleeKaligaKendrickKessonLakeLochloosaLochloosa-MicanopyLynneMalabarMyakka<strong>Water</strong>NeilhurstNeilhurst-Urban landOldsmarOnaOrlandoWinderZolfoPaisleyPlacid-MyakkaPomelloPomello-Urban landPomonaPomona-Urban landPompanoQuartzipsammentsSamsulaSeffnerSmyrnaSmyrna-MyakkaSparrSparr-Urban landSt. AugustineSt. Augustine-Urban landSt. JohnsSt. LucieTavaresTavares-MillhopperTavares-Urban landUdorthentsUrban LandWabassoMyakka-Immokalee-Urban landWauchulaNOTE: Soil Surveys for differentcounties use different soil descriptions.WSN.T.S.E<strong>Hillsborough</strong> River <strong>Water</strong>shed Management PlanSoil Types in the Blackwater Creek RegionFigure2.3.3
Table 2.3.2 Soil Coverage <strong>of</strong> theBlackwater Creek RegionSoil Description Area (Ac.) Percent Area Hydrologic Soil GroupAdamsville 420 0.6 CAdamsville-Urban land 53.3 0.08 CApopka 1201.2 1.7 AArchbold 13.3 0.02 AArents 2082.6 2.96 DArents-Urban land 494.4 0.7 BArents-<strong>Water</strong> 127.5 0.18 DBasinger 6910.8 9.8 DBradenton 16.5 0.02 DBroward-Urban land 3 0 CCandler 552.8 0.78 ACandler-Urban land 24.3 0.04 AChobee 1566.9 2.22 DEaton 972.9 1.38 DEayGallie 4.4 0.01 DFelda 1565.7 2.22 DFloridana 180.2 0.26 DFort Meade 1704.1 2.41 AFort Meade-Urban land 5.7 0.01 AGainesville 71.3 0.1 AGypsum land 12 0.02 DHaplaquents 160.8 0.23 DHolopaw 496.2 0.7 DHontoon 1227.8 1.74 DHydraquents 58.8 0.08 DImmokalee 690.7 0.98 DKaliga 499.3 0.71 DKendrick 827.6 1.18 AKesson 9.8 0.01 DLake-soil 966.8 1.37 ALochloosa 119.3 0.17 CLochloosa-Micanopy 65 0.09 CLynne 63.6 0.09 DMalabar 1961.2 2.78 DMyakka 11771.7 16.69 DMyakka-Immokalee-Urban land 656.4 0.93 DNeilhurst 60.8 0.09 ANeilhurst-Urban land 58 0.08 AOldsmar 75 0.11 DOna 1693 2.4 DOrlando 275.1 0.39 APaisley 259.1 0.37 DPlacid-Myakka 621 0.88 DPomello 165.4 0.23 CPomello-Urban land 68.5 0.1 CPomona 8106.6 11.49 DPomona-Urban land 216.5 0.31 DPompano 76.4 0.11 D
Table 2.3.2 Soil Coverage <strong>of</strong> theBlackwater Creek RegionSoil Description Area (Ac.) Percent Area Hydrologic Soil GroupQuartzipsamments 19.1 0.03 DSamsula 1064 1.51 DSeffner 1745.4 2.47 CSmyrna 275.2 0.39 DSmyrna-Myakka 3207.4 4.55 DSparr 1722.6 2.44 CSparr-Urban land 946.9 1.34 CSt. Augustine 7.3 0.01 CSt. Augustine-Urban land 2.6 0 CSt. Johns 1801.5 2.56 DSt. Lucie 66.6 0.09 ATavares 1762.1 2.5 ATavares-Millhopper 125.5 0.18 ATavares-Urban land 444.7 0.63 AUdorthents 70.3 0.1 DUrban Land 735 1.04 DWabasso 1968.6 2.79 DWauchula 358.7 0.51 DWinder 2854.1 4.04 DZolfo 1566.7 2.22 C<strong>Water</strong> 555.4 0.79 NA
NWESN.T.S.Source:Derived fromSWFWMD GISsoil coveragesand SCS soilsurveysLegendBlackwater Creek Region BoundaryRegional Hydrologic Soil GroupABCD<strong>Hillsborough</strong> River <strong>Water</strong>shed Management PlanHydrologic Soil Groups in the Blackwater Creek RegionFigure2.3.4
LegendCentral TributariesRegion BoundaryRegional Soil TypesOnaAdamsvilleTavares-MillhopperKendrickKessonLakeLochloosa-MicanopyMalabarArchboldArentsBasingerCandlerChobeeEatonFeldaFloridanaFort MeadeGainesvilleImmokaleeOrsinoPaisleyPomelloSeffnerSmyrnaSt. JohnsMyakkaWabasso<strong>Water</strong>WinderZolfoNWESN.T.S.Source: Derived from SWFWMD GISsoil coverages and SCS soil surveysNOTE: Soil Surveys for differentcounties use different soil descriptions.<strong>Hillsborough</strong> River <strong>Water</strong>shed Management PlanSoil Types in the Central Tributaries RegionFigure2.3.5
Table 2.3.3 Soil Coverage <strong>of</strong> theCentral Tributaries RegionSoil Description Area (Ac.) Percent Area Hydrologic Soil GroupAdamsville 51.6 0.31 CArchbold 1.2 0.01 AArents 0.0 0 DBasinger 2940.9 17.85 DCandler 358.2 2.17 AChobee 52.8 0.32 DEaton 2.9 0.02 DFelda 266.8 1.62 DFloridana 1.9 0.01 DFort Meade 299.6 1.82 AGainesville 28.4 0.17 AImmokalee 306.7 1.86 DKendrick 4.9 0.03 AKesson 10.2 0.06 DLake-soil 263.8 1.6 ALochloosa-Micanopy 10.5 0.06 CMalabar 1014.5 6.16 DMyakka 6911.0 41.95 DOna 696.9 4.23 DOrsino 2.1 0.01 APaisley 16.8 0.1 DPomello 0.9 0.01 CSeffner 1081.1 6.56 CSmyrna 74.1 0.45 DSt. Johns 745.5 4.53 DTavares-Millhopper 29.4 0.18 AWabasso 22.6 0.14 DWinder 936.4 5.68 DZolfo 338.7 2.06 D<strong>Water</strong> 4.3 0.03 NA
LegendCentral Tributaries Region BoundaryRegional Hydrologic Soil GroupACDNWESN.T.S.Source:Derived fromSWFWMD GISsoil coveragesand SCS soilsurveys<strong>Hillsborough</strong> River <strong>Water</strong>shed Management PlanHydrologic Soil Groups in the Central Tributaries RegionFigure2.3.6
NWESource: Derived from SWFWMD GISsoil coverages and SCS soil surveysSN.T.S.LegendNOTE: Soil Surveys for differentcounties use different soil descriptions.Northwestern Tributaries Region BoundaryRegional Soil TypesAdamsvilleFeldaAncloteFloridanaArredondoImmokaleeBasingerKanapahaBlichtonKendrickCandlerLakeCassiaLochloosaChobeeMalabarDelrayMillhopperEauGallieMyakkaEauGallie-Urban land NarcoosseeElectra variant NewnanSellersSmyrnaSparrSt. JohnsTavaresTomokaVeroWabasso<strong>Water</strong>WinderZephyrZolfoOkeelanta-Terra CeiaOnaPaisleyPalmetto-Zephyr-SellersPinedaPitsPomelloPomonaPompanoQuartzipsammentsSamsula<strong>Hillsborough</strong> River <strong>Water</strong>shed Management PlanSoil Types in the Northwestern Tributaries RegionFigure2.3.7
Table 2.3.4 Soil Coverage <strong>of</strong> theNorthwest Tributaries RegionSoil Description Area (Ac.) Percent Area Hydrologic Soil GroupAdamsville 217.9 0.52 CAnclote 46.3 0.11 DArredondo 54 0.13 ABasinger 1950.9 4.67 DBlichton 7.5 0.02 DCandler 41.8 0.1 ACassia 138.4 0.33 CChobee 1500.7 3.6 DDelray 553.7 1.33 DEauGallie 5101.5 12.22 DEauGallie-Urban land 68.5 0.16 DElectra variant 277.2 0.66 CFelda 559 1.34 DFloridana 1.5 0 DImmokalee 52.8 0.13 DKanapaha 42.1 0.1 DKendrick 107.3 0.26 ALake-soil 20.3 0.05 ALochloosa 118.4 0.28 CMalabar 404.1 0.97 DMillhopper 43.9 0.11 AMyakka 6253.5 14.99 DNarcoossee 374.8 0.9 CNewnan 1580.4 3.79 COkeelanta-Terra Ceia 49.8 0.12 DOna 82.5 0.19 DPaisley 372.8 0.89 DPalmetto-Zephyr-Sellers 3470 8.32 DPineda 88.6 0.21 DPits 36.9 0.09 DPomello 35.7 0.09 CPomona 9365.7 22.44 DPompano 109.6 0.27 DQuartzipsamments 225.6 0.54 DSamsula 62.8 0.15 DSellers 1217.7 2.92 DSmyrna 525.8 1.26 DSparr 1527.9 3.66 CSt. Johns 106.3 0.25 DTavares 555.4 1.33 ATomoka 98.3 0.24 DVero 841.5 2.01 DWabasso 117.9 0.28 DWinder 1446.7 3.46 DZephyr 1746 4.18 DZolfo 35.9 0.09 C<strong>Water</strong> 271 0.65 NA
WNSN.T.S.ESource:Derived fromSWFWMD GISsoil coveragesand SCS soilsurveysLegendNorthwestern Tributaries Region BoundaryRegional Hydrologic Soil GroupACD<strong>Hillsborough</strong> River <strong>Water</strong>shed Management PlanHydrologic Soil Groups in theNorthwestern Tributaries RegionFigure2.3.8
Table 2.3.5 Soil Coverage <strong>of</strong> the<strong>Hillsborough</strong> River RegionSoil Description Area (Ac.) Percent Area Hydrologic Soil GroupAdamsville 36.9 0.09 CArchbold 9.9 0.02 AArents 655 1.48 DArredondo 253.8 0.57 ABasinger 2722.7 6.17 DBlichton 16.9 0.04 DBroward-Urban land 44.2 0.1 CCandler 2795.9 6.33 ACandler-Urban land 3016.9 6.83 ACassia 0.2 0 CChobee 10371.5 23.49 DDelray 46.2 0.1 DEaton 7.1 0.02 DEauGallie 104.6 0.24 DElectra variant 498.4 1.13 CFelda 500.8 1.14 DFlemington Variant 16.9 0.04 DFort Meade 7.1 0.02 AImmokalee 827.7 1.87 DKanapaha 9.4 0.02 DKendrick 45 0.11 ALake-soil 18.3 0.04 ALochloosa 76.6 0.17 CLochloosa-Micanopy 48.5 0.11 CMalabar 881.6 2 DMillhopper 493.9 1.12 AMillhopper-Urban land 22.6 0.05 AMyakka 6758.7 15.3 DMyakka-Urban land 314.4 0.71 DNarcoossee 78.9 0.18 CNewnan 90.5 0.2 CNobleton 62.8 0.14 COna 14 0.03 DOrsino 0.2 0 APaisley 540.9 1.23 DPalmetto-Zephyr-Sellers 348.7 0.79 DPomello 125.7 0.28 CPomello-Urban land 22.7 0.05 CPomona 839.9 1.9 DPompano 2.7 0.01 DQuartzipsamments 1 0 DSeffner 1.1 0 CSellers 2 0 DSmyrna 0.5 0 DSparr 220.7 0.5 CSt. Augustine 43 0.1 CSt. Augustine-Urban land 136.6 0.31 CSt. Johns 167.5 0.38 D
Table 2.3.5 Soil Coverage <strong>of</strong> the<strong>Hillsborough</strong> River RegionSoil Description Area (Ac.) Percent Area Hydrologic Soil GroupTavares 886.1 2.01 ATavares-Millhopper 1917.5 4.34 ATavares-Urban land 221.6 0.51 AUrban land 344.9 0.78 DVero 160.7 0.36 DWabasso 825.6 1.87 DWinder 4534.5 10.27 DZephyr 160.3 0.36 DZolfo 1186.9 2.69 C<strong>Water</strong> 104.9 0.23 NA
NWESN.T.S.Source:Derived fromSWFWMD GISsoil coveragesand SCS soilsurveysLegend<strong>Hillsborough</strong> River Region BoundaryRegional Hydrologic Soil GroupACD<strong>Hillsborough</strong> River <strong>Water</strong>shed Management PlanHydrologic Soil Groups in the <strong>Hillsborough</strong> River RegionFigure2.3.10
WNSN.T.S.ESource: Derived from SWFWMD GISsoil coverages and SCS soil surveysLegendTBC and TributariesRegion BoundaryRegional Soil TypesAdamsvilleArchboldArentsBasingerBroward-Urban landCandlerCandler-Urban landChobeeEatonFeldaFloridanaFort MeadeGainesvilleGypsum landHaplaquentsImmokaleeKendrickLakeLochloosa-MicanopyMalabarMyakkaMyakka-Urban landOnaOrlandoOrsinoPaisleyPinellasPomelloPomello-Urban landSeffnerSmyrnaSt. Augustine-Urban landSt. JohnsTavares-MillhopperTavares-Urban landUrban landWabassoWabasso-Urban land<strong>Water</strong>WinderZolfoNOTE: Soil Surveys for differentcounties use different soil descriptions.<strong>Hillsborough</strong> River <strong>Water</strong>shed Management PlanSoil Types in theTBC and Tributaries RegionFigure2.3.11
Table 2.3.6 Soil Coverage <strong>of</strong> theTBC and Tributaries RegionSoil Description Area (Ac.) Percent Area Hydrologic Soil GroupAdamsville 35.1 0.12 CArchbold 30.4 0.1 AArents 520.2 1.75 DBasinger 2041.2 6.86 DBroward-Urban land 3.4 0.01 CCandler 6755.8 22.69 ACandler-Urban land 792.4 2.66 AChobee 1977.3 6.63 DEaton 162.4 0.55 DFelda 1013.2 3.4 DFloridana 212.1 0.71 DFort Meade 747.5 2.51 AGainesville 436.9 1.47 AGypsum land 44.6 0.15 DHaplaquents 28.2 0.09 DImmokalee 96.3 0.32 DKendrick 151.7 0.51 ALake-soil 2032 6.83 ALochloosa-Micanopy 186.8 0.63 CMalabar 894.5 3 DMyakka 3778.2 12.69 DMyakka-Urban land 992.2 3.33 DOna 37.4 0.13 DOrlando 184.9 0.62 AOrsino 13.1 0.04 APaisley 13.3 0.04 DPinellas 0 0 DPomello 209.8 0.7 CPomello-Urban land 79.1 0.27 CSeffner 231 0.78 CSmyrna 41 0.14 DSt. Augustine-Urban land 4.8 0.02 CSt. Johns 1185 3.98 DTavares-Millhopper 1992.7 6.69 ATavares-Urban land 0.1 0 AUrban land 34.4 0.12 DWabasso 29.7 0.1 DWabasso-Urban land 3.5 0.01 DWinder 705.5 2.37 DZolfo 1347.8 4.53 C<strong>Water</strong> 305.6 1.03 NA
NWESN.T.S.Source:Derived fromSWFWMD GISsoil coveragesand SCS soilsurveysLegendTBC and Tributaries Region BoundaryRegional Hydrologic Soil GroupACD<strong>Hillsborough</strong> River <strong>Water</strong>shed Management PlanHydrologic Soil Groups in the TBC and Tributaries RegionFigure2.3.12
GENERAL DESCRIPTION(FLUCCS). The information in this database was used during the course <strong>of</strong> investigating existingconditions. Data in the SWFWMD FLUCCS coverage indicates that the HRW is fairly rural.Generalized land use/coverage descriptions have been developed in order to summarize thedistributions within the HRW and by region.Only 25% <strong>of</strong> the land in the overall HRW is considered Developed. Classifications included in thiscategory are: Residential, Commercial, Industrial, Institutional, Recreational, and Transportationcoverages. Approximately 33% <strong>of</strong> the watershed is comprised <strong>of</strong> Agricultural Lands. Classificationsincluded in this category are: Open Land, Cropland and Pastureland, Row Crops, Tree Crops,Feeding Operations, Nurseries, Specialty Farms, Tropical Fish Farms, and Other Open Lands(Rural). About 19% <strong>of</strong> the watershed is Upland Wooded areas, while approximately 23% <strong>of</strong> thearea is classified as <strong>Water</strong> Bodies or Wetlands or other water retaining systems. Themiscellaneous Other Coverages such as Communication and Utilities, account for less than 1% <strong>of</strong>the HRW.2.4.1 Crystal SpringsFigure 2.4.1 illustrates the land use/coverage for this region. Predominate land coverages withinthis very rural region are Cropland and Pastureland (23%), Shrub and Bushland (14%), andStream and Lake Swamp (Bottomland) (13%). A distribution <strong>of</strong> the remaining coverages can beseen in Table 2.4.1. Considering generalized land classifications as described above, the region iscomprised <strong>of</strong> the following: 22% Developed, 30% Agricultural, 25% Upland Woods, 23% <strong>Water</strong>Bodies and Wetlands, and < 1% Other Coverages.2.4.2 Blackwater CreekThis region is also very rural. The largest land coverage is Cropland and Pastureland that accountsfor approximately 37% <strong>of</strong> the area. This can be seen in Figure 2.4.2. A distribution <strong>of</strong> the remainingcoverages can be seen in Table 2.4.2. The generalized land distribution for this region is asfollows: 23% Developed, 46% Agricultural, 12% Upland Woods, 19% <strong>Water</strong> Bodies and Wetlands,and < 1% Other Coverages.2.4.3 Central TributariesCrop and Pastureland and Residential Low Density are the predominate coverages in this region at36% and 18%, respectively. The remaining coverage percentages can be found in Table 2.4.3.Figure 2.4.3 illustrates the land use / coverage for this region. The generalized land distribution forthis region is as follows: 19% Developed, 47% Agricultural, 17% Upland Woods, 17% <strong>Water</strong>Bodies and Wetlands, and < 1% Other Coverages.2.4.4 Northwestern TributariesA large portion <strong>of</strong> this region is rural according to the 1995 Land Use/Coverage. The predominatecoverages at that time were Cropland and Pastureland at 30% and Shrub and Brush at 17%. Thiscan be seen in Figure 2.4.4. However, the Trout Creek and Clay Gully West subwatersheds in this2-32 <strong>Hillsborough</strong> River <strong>Water</strong>shed Management Plan
WNSESource:Derived fromSWFWMD GISland usecoveragesCrystal Springs Region BoundaryRegional Land UseBay SwampsCommercial and ServicesCommunicationCropland and PasturelandCypressEmergent Aquatic VegetationExtractiveFeeding OperationsFreshwater MarshesHardwood Conifer MixedHerbaceousIndustrialInstitutionalIntermittent PondsLakesLongleaf Pine - Xeric OakNurseries and VineyardsOpen LandOther Open Lands (Rural)Pine FlatwoodsLegendRecreationalReservoirsResidential High DensityResidential LOW Density 5 DRow CropsShrub and BrushlandSpecialty FarmsStream and Lake Swamps (BottomTransportationTree CropsTree PlantationsTropical Fish FarmsUpland Coniferous ForestUtilitiesWet PrariesWetland Confierous ForestsWetland Forests Mixed<strong>Hillsborough</strong> River <strong>Water</strong>shed Management PlanLand Use for the Crystal Springs RegionFigure2.4.1
Table 2.4.1 1995 Land Use Distributionin the Crystal Springs RegionLand Use CategoryFLUCCS/DesignationArea(Ac.)Percentage(%)Residential LOW Density
NWESSource:Derived fromSWFWMD GISland usecoveragesLegendBlackwater Creek Region BoundaryRegional Land UseCommercial and ServicesCommunicationCropland and PasturelandCypressDisturbed LandEmergent Aquatic VegetationExtractiveFeeding OperationsFreshwater MarshesHardwood Conifer MixedIndustrialInstitutionalIntermittent PondsLakesMixed RangelandNurseries and VineyardsOpen LandOther Open Lands (Rural)Pine FlatwoodsRecreationalReservoirsResidential High DensityResidential LOW Density 5 DRow CropsShrub and BrushlandSpecialty FarmsStream and Lake Swamps (BottomStreams and <strong>Water</strong>waysTransportationTree CropsTree PlantationsTropical Fish FarmsUpland Coniferous ForestUpland Hardwood Forests - PartUtilitiesWet PrariesWetland Confierous ForestsWetland Forests Mixed<strong>Hillsborough</strong> River <strong>Water</strong>shed Management PlanLand Use for the Blackwater Creek RegionFigure2.4.2
Table 2.4.2 1995 Land Use Distributionin the Blackwater Creek RegionLand Use CategoryFLUCCS/DesignationArea(Ac.)Percentage(%)Residential LOW Density
LegendNCentral Tribbutaries Region BoundaryRegional Land UseCommercial and ServicesCropland and PasturelandCypressEmergent Aquatic VegetationFeeding OperationsFreshwater MarshesHardwood Conifer MixedIndustrialInstitutionalLakesNurseries and VineyardsOpen LandOther Open Lands (Rural)Pine FlatwoodsRecreationalReservoirsResidential High DensityResidential LOW Density 5 DRow CropsShrub and BrushlandSpecialty FarmsStream and Lake Swamps (BottomTransportationTree CropsTree PlantationsTropical Fish FarmsUpland Coniferous ForestWet PrariesWetland Confierous ForestsWetland Forests MixedWESSource:Derived fromSWFWMD GISland usecoverages<strong>Hillsborough</strong> River <strong>Water</strong>shed Management PlanLand Use for the Central Tributaries RegionFigure2.4.3
Table 2.4.3 1995 Land Use Distributionin the Central Tributaries RegionLand Use CategoryFLUCCS/DesignationArea(Ac.)Percentage(%)Residential LOW Density
WNSESource:Derived from SWFWMD GISland use coveragesLegendNorthwestern Tributaries Region BoundaryRegional Land UseBay SwampsCommercial and ServicesCommunicationCropland and PasturelandCypressDisturbed LandEmergent Aquatic VegetationExtractiveFeeding OperationsFreshwater MarshesHardwood Conifer MixedIndustrialInstitutionalIntermittent PondsLakesLongleaf Pine - Xeric OakMangrove SwampsMixed RangelandOpen LandOther Open Lands (Rural)Pine FlatwoodsRecreationalReservoirsResidential High DensityResidential LOW Density 5 DRow CropsShrub and BrushlandSpecialty FarmsStream and Lake Swamps (BottomStreams and <strong>Water</strong>waysTransportationTree CropsTree PlantationsTropical Fish FarmsUpland Coniferous ForestUtilitiesVegetated non-Forested WetlandWet PrariesWetland Confierous ForestsWetland Forests Mixed<strong>Hillsborough</strong> River <strong>Water</strong>shed Management PlanLand Use for the Northwestern Tributaries RegionFigure2.4.4
GENERAL DESCRIPTIONregion have seen the most development in recent years. Several subdivisions, retail complexes,and business centers have been constructed. This development will affect the distributionscontained in Table 2.4.4 during the next analysis by SWFWMD. The 1995 generalized landdistribution for this region is as follows: 11% Developed, 36% Agricultural, 28% Upland Woods,25% <strong>Water</strong> Bodies and Wetlands, and < 1% Other Coverages.2.4.5 <strong>Hillsborough</strong> RiverThe river and portions <strong>of</strong> its flood plain dominate land coverage in this region, accounting forapproximately 25% <strong>of</strong> the total as the Stream and Lake Swamp (Bottomland) classification. Thecombined Residential land uses account for an additional 19% as the river flows through the cities<strong>of</strong> Temple Terrace and <strong>Tampa</strong> (Figure 2.4.5). Table 2.4.5 lists the other land coverages containedwithin this region and their accompanying percentages. The generalized land distribution for thisregion is as follows: 28% Developed, 13% Agricultural, 21% Upland Woods, 37% <strong>Water</strong> Bodiesand Wetlands, and < 1% Other Coverages.2.4.6 TBC and TributariesThis region is the most heavily developed <strong>of</strong> the six with the three Residential land uses accountingfor approximately 31% <strong>of</strong> the region. This, and the lack <strong>of</strong> large wetland areas can be seen inFigure 2.4.6. Table 2.4.6 provides a distribution <strong>of</strong> all coverages within the region by percent. Thegeneralized land distribution for this region is as follows: 28% Developed, 13% Agricultural, 21%Upland Woods, 37% <strong>Water</strong> Bodies and Wetlands, and < 1% other Coverages.2.4.7 Future Land Uses within the <strong>Hillsborough</strong> River <strong>Water</strong>shedLand uses within the watershed are not expected to drastically change in the near future, however,future land use plans for the region depict large areas that are zoned for future development. Theregion most likely to experience significant change is the Northwestern Tributaries Region with thecontinued development <strong>of</strong> the New <strong>Tampa</strong> area. No major future development is expected in the<strong>Hillsborough</strong> River Region since much <strong>of</strong> this area is in public ownership (e.g., as the Lower<strong>Hillsborough</strong> River Flood Detention Area). The TBC area has already undergone significantdevelopment and is not expected to change significantly. The Blackwater Creek, CentralTributaries, and Crystal Springs Regions could see isolated changes as large privately ownedtracts are developed for residential housing.2.5 Physiography and HydrologyThe HRW lies within the Polk Upland physiographic unit as defined by William A. White (FloridaBureau <strong>of</strong> Geologies, Bulletin 51, Geomorphology: the Florida Peninsula, 1970). This unit lieswithin the Central or Mid-Peninsular zone. This zone is characterized by discontinuous highlandsformed by sub-parallel ridges. Broad valleys typically separate these ridges.Land elevations within the HRW range from about 225 feet NGVD in the eastern part <strong>of</strong> thewatershed to about 5.0 feet NVGD at the downstream extents <strong>of</strong> the <strong>Tampa</strong> Bypass Canal. Theseelevations can be seen by region in Figures 2.2.1 through 2.2.6. The HRW has over 20 majorsubwatersheds above the <strong>Tampa</strong> Dam. Some <strong>of</strong> these subwatersheds are tributaries to the2-40 <strong>Hillsborough</strong> River <strong>Water</strong>shed Management Plan
Table 2.4.4 1995 Land Use Distributionin the Northwest Tributaries RegionLand Use CategoryFLUCCS/DesignationArea(Ac.)Percentage(%)Residential LOW Density
LegendWNSESource:Derived fromSWFWMD GISland usecoverages<strong>Hillsborough</strong> River Region BoundaryRegional Land UseBays and EstuariesCommercial and ServicesCommunicationCropland and PasturelandCypressDisturbed LandEmergent Aquatic VegetationExtractiveFeeding OperationsFreshwater MarshesHardwood Conifer MixedIndustrialInstitutionalIntermittent PondsLakesLongleaf Pine - Xeric OakMixed RangelandNurseries and VineyardsOpen LandOther Open Lands (Rural)Pine FlatwoodsRecreationalReservoirsResidential High DensityResidential LOW Density 5 DShrub and BrushlandStream and Lake Swamps (BottomStreams and <strong>Water</strong>waysTransportationTree CropsTree PlantationsTropical Fish FarmsUpland Coniferous ForestUtilitiesWet PrariesWetland Confierous ForestsWetland Forests Mixed<strong>Hillsborough</strong> River <strong>Water</strong>shed Management PlanLand Use for the <strong>Hillsborough</strong> River RegionFigure2.4.5
Table 2.4.5 1995 Land Use Distributionin the <strong>Hillsborough</strong> River RegionLand Use CategoryFLUCCS/DesignationArea(Ac.)Percentage(%)Residential LOW Density
TBC and Tributaries Region BoundaryRegional Land UseCommercial and ServicesCommunicationCropland and PasturelandCypressDisturbed LandEmergent Aquatic VegetationExtractiveFeeding OperationsFreshwater MarshesHardwood Conifer MixedIndustrialInstitutionalIntermittent PondsLakesMixed RangelandNurseries and VineyardsOpen LandOther Open Lands (Rural)RecreationalReservoirsResidential High DensityResidential LOW Density 5 DRow CropsShrub and BrushlandSpecialty FarmsStream and Lake Swamps (BottomStreams and <strong>Water</strong>waysTransportationTree CropsTree PlantationsTropical Fish FarmsUpland Coniferous ForestUpland Hardwood Forests - PartUtilitiesWet PrariesWetland Confierous ForestsWetland Forests MixedWetland Hardwood ForestsWNSESource:Derived from SWFWMD GISland use coverages<strong>Hillsborough</strong> River <strong>Water</strong>shed Management PlanLand Use for the TBC and Tributaries RegionFigure2.4.6
Table 2.4.6 1995 Land Use Distributionin the TBC and Tributaries RegionLand Use CategoryFLUCCS/DesignationArea(Ac.)Percentage(%)Residential LOW Density
GENERAL DESCRIPTION<strong>Hillsborough</strong> River while others are not. Those that are include Blackwater Creek,Itchepackesassa Creek, East Canal, Tiger Creek, Two Hole Branch, Clay Gully East, HollomansBranch, Flint Creek, Indian Creek, New River, Basset Branch, Clay Gully West, Trout Creek, andCypress Creek. Those subwatersheds that discharge to the TBC are the Vandenberg, Williams,Mango, and Falkenburg Areas. Chapter 3 provides a more complete description <strong>of</strong> thesubwatersheds and tributaries within the HRW.There are many swamps, wetlands, and depressions within the watershed. Several sinkholes,associated with the dissolution <strong>of</strong> the underlying limestone formations, can be found to the east <strong>of</strong>the TBC. The only named lake within the HRW is Lake Mango, which is located in the southeastportion <strong>of</strong> the watershed.Surface flows within the HRW vary by region. Flow is generally to the west and north within theBlackwater Creek and Central Tributaries Regions. All <strong>of</strong> the subwatersheds within theNorthwestern Tributaries Region flow north to south from Pasco <strong>County</strong> to <strong>Hillsborough</strong> <strong>County</strong>. Inthe Crystal Springs and <strong>Hillsborough</strong> River Regions surface flows are generally towards thesouthwest. Within the TBC and Tributaries Region surface flows in the main canal are to the south,while in the tributaries flow is predominately to the west. Hydrologically, surface flows within theregions originate for the most part through stormwater run<strong>of</strong>f and wetland/ swamp discharge.There is some influence on surface flows from groundwater flows in portions <strong>of</strong> the HRW.2.6 HydrogeologyThe HRW is underlain by undifferentiated superficial deposits <strong>of</strong> silt, sand, and clay that vary inthickness. The lower parts <strong>of</strong> these deposits contain clay and clayey-sand materials that act as aconfining layer over the Floridan aquifer throughout most <strong>of</strong> the watershed. The Floridan aquiferconsists <strong>of</strong> limestone and dolomite and is divided into the Upper Floridan Aquifer, the MiddleConfining Unit, and the Lower Floridan Aquifer. The relationship <strong>of</strong> these layers to one another canbe seen in Figure 2.6.1. The stratified formations that make up this system are the <strong>Tampa</strong>,Suwanee, Ocala, Avon Park, and Oldsmar, and Cedar Key Limestone formations.The hydrogeologic flow system <strong>of</strong> the <strong>Tampa</strong> Bay region is comprised <strong>of</strong> the unconfined surficialand the semi-confined Upper Floridan aquifers. The surficial aquifer is comprised predominately <strong>of</strong>fine-grained sand deposits. Due to the geology <strong>of</strong> the region the thickness <strong>of</strong> these sand depositsis highly variable. The direction <strong>of</strong> groundwater flow within this aquifer varies locally and is greatlyinfluenced by topography. The freshwater Upper Floridan aquifer is separated from the brinesaturatedLower Floridan aquifer by the Middle Confining layer. The direction <strong>of</strong> groundwater flowwithin the Upper Floridan aquifer is generally towards the south and west.2-46 <strong>Hillsborough</strong> River <strong>Water</strong>shed Management Plan
Pasco <strong>County</strong><strong>Hillsborough</strong> <strong>County</strong>Surficial AquiferLower Floridan AquiferUpper Floridan AquiferIntermediate AquiferConfining BedMiddle Confining AquiferSub-Floridan Aquifer<strong>Hillsborough</strong> River <strong>Water</strong>shed Management PlanHydrogeologic Cross-Section (Source: SWFWMD)Figure2.6.1
CHAPTER 3WATERSHED DESCRIPTION3.1 IntroductionAs mentioned in Chapter 2, the overall <strong>Hillsborough</strong> River <strong>Water</strong>shed (HRW) was divided into sixregions. The watershed descriptions <strong>of</strong> the <strong>Hillsborough</strong> River will be divided into these sixregions. These regions share geographic, physical, and hydraulic similarities and are comprised <strong>of</strong>subwatersheds. The subwatersheds represent tributaries to the river and the <strong>Tampa</strong> BypassCanal (TBC). Plots <strong>of</strong> the hydraulic link-node diagrams for those subwatersheds included in theSWMM model are presented in Appendix A.3.2 Crystal Springs RegionThis region is comprised <strong>of</strong> the <strong>Hillsborough</strong> River above Crystal Springs, Big Ditch, and IndianCreek subwatersheds. These subwatersheds are located in the northeastern part <strong>of</strong> the watershedand generally lie outside <strong>of</strong> <strong>Hillsborough</strong> <strong>County</strong>. No link-node diagrams are provided for thisregion which lies nearly entirely outside <strong>of</strong> <strong>Hillsborough</strong> <strong>County</strong>.3.2.1 <strong>Hillsborough</strong> above Crystal SpringsThis subwatershed is approximately 75 square miles in size and is located near the headwaters <strong>of</strong>the <strong>Hillsborough</strong> River. This large expanse <strong>of</strong> wetlands and agricultural lands is located outside <strong>of</strong>the county. It is bounded by Crystal Springs to the west, the Withlacoochee overflow to the east,Big Ditch to the south, and Zephyrhills to the north. This area receives flow from severalidentifiable sources such as the Withlacoochee overflow, Zephyrhills Drain, and Port Lonesomeand Fish Hatchery Drains.The Withlacoochee overflow contributes flow to this subwatershed through two bridges locatedalong U.S. 98 and S.R. 54. The amount <strong>of</strong> flow contributed to the <strong>Hillsborough</strong> River is highlydependent on the hydrologic conditions <strong>of</strong> the Green Swamp area and the hydraulic conditions <strong>of</strong>the Withlacoochee River. This river is the largest water conveyance <strong>of</strong> the five rivers that originatein or near the Green Swamp. When stages in the Withlacoochee River exceed approximately 77.5feet NVGD, overflow to the <strong>Hillsborough</strong> River occurs through a natural saddle.The Zephyrhills Drain originates approximately 3.5 miles northwest <strong>of</strong> the city <strong>of</strong> Zephyrhills. Thewaterway flows southward for almost 2.0 miles before turning towards the southeast. The drainflows through the city receiving stormwater run<strong>of</strong>f before turning to flow southwards again towardsthe county line. The Zephyrhills Drain confluence is located approximately 0.1 miles upstream <strong>of</strong>the Central Avenue crossing <strong>of</strong> the <strong>Hillsborough</strong> River and 0.25 miles upstream <strong>of</strong> Crystal Springs.3-1 <strong>Hillsborough</strong> River <strong>Water</strong>shed Management Plan
WATERSHED DESCRIPTIONThe Fish Hatchery Drain and Port Lonesome Ditches area includes many minor tributaries to the<strong>Hillsborough</strong> River. These tributaries originate in swamps located in the area <strong>of</strong> the borderbetween eastern Paso <strong>County</strong> and western Polk <strong>County</strong>. These tributaries run generally in anorthwesterly direction before intersecting the <strong>Hillsborough</strong> River at various locations from 0.25miles upstream <strong>of</strong> Crystal Springs to approximately 1.0 mile north <strong>of</strong> S.R. 54, near the boundarybetween the <strong>Hillsborough</strong> River and the Withlacoochee River in Pasco <strong>County</strong>.3.2.2 Big DitchThis subwatershed originates in swamps located in the area <strong>of</strong> the border between northeastern<strong>Hillsborough</strong> <strong>County</strong> and Polk <strong>County</strong>. The ditch runs in a westerly direction past a large miningoperation and under S.R. 39. Big Ditch continues to flow westward to the south <strong>of</strong> the <strong>City</strong> <strong>of</strong>Crystal Springs before intersecting the <strong>Hillsborough</strong> River approximately 1.25 miles downstream <strong>of</strong>Crystal Springs.3.2.3 Indian CreekThis subwatershed’s headwaters are located approximately 2.0 miles west <strong>of</strong> the <strong>City</strong> <strong>of</strong>Zephyrhills near S.R. 54. The creek meanders southward through several large wetlands in Pasco<strong>County</strong> and into <strong>Hillsborough</strong> <strong>County</strong>. The entire extent <strong>of</strong> the subwatershed within <strong>Hillsborough</strong><strong>County</strong> is located on one privately owned ranch. The confluence <strong>of</strong> this creek and the <strong>Hillsborough</strong>River is located approximately 0.5 miles downstream from the river’s crossing <strong>of</strong> U.S. 301.3.3 Blackwater Creek RegionThe Blackwater Creek Region incorporates three major named tributaries: Tiger Creek, EastCanal, and Itchepackesassa Creek. Approximately half <strong>of</strong> this region is located within <strong>Hillsborough</strong><strong>County</strong> and extends east from S.R. 39 to the county line and north <strong>of</strong> Interstate 4. The remainderis located in Polk <strong>County</strong>. The region is generally bounded by the <strong>City</strong> <strong>of</strong> Lakeland to the east, theAlafia River <strong>Water</strong>shed to the south, Big Ditch to the north, and the Central Tributary Region andPemberton Creek areas to the west.3.3.1 Blackwater CreekThe Blackwater Creek subwatershed includes Blackwater Creek and several minor tributaries. Thecreek originates in Lakeland and receives a portion <strong>of</strong> the city’s run<strong>of</strong>f west <strong>of</strong> Florida Avenue. Themain creek flows in a northwesterly direction from the city limits towards the county line. The minortributaries <strong>of</strong> the creek drain wetlands in portions <strong>of</strong> western Polk <strong>County</strong> and the northeastern part<strong>of</strong> <strong>Hillsborough</strong> <strong>County</strong>. The creek turns toward the west approximately 3.5 miles upstream <strong>of</strong> itscrossing <strong>of</strong> S.R. 39. This portion <strong>of</strong> Blackwater Creek receives the discharge from the three majortributaries. After crossing S.R. 39 the creek continues to flow westward before crossing U.S. 301and discharging into the <strong>Hillsborough</strong> River just upstream <strong>of</strong> the river’s State Park.3-2 <strong>Hillsborough</strong> River <strong>Water</strong>shed Management Plan
CHAPTER 33.3.2 Itchepackesassa CreekThis subwatershed’s headwaters are located in Polk <strong>County</strong>. The creek flows towards thenorthwest receiving additional inflow from several large wetlands. Itchepackesassa Creek and theEast Canal converge approximately 1.75 miles north <strong>of</strong> the intersection <strong>of</strong> Knights-Griffin Road andBailey Road. This combined waterway flows northwards for approximately 2.5 miles before joiningBlackwater Creek 2.0 miles upstream <strong>of</strong> Blackwater Creek’s crossing <strong>of</strong> S.R. 39.3.3.3 East CanalEast Canal originates within the city limits <strong>of</strong> Plant <strong>City</strong> where it receives stormwater run<strong>of</strong>f from thepart <strong>of</strong> the city that is east <strong>of</strong> S.R. 39. The canal flows north from the city limits under Interstate 4and receives additional inflow from wetlands located to the east <strong>of</strong> the main waterway. East Canalcontinues to flow northwards for approximately 2.5 miles crossing Knights-Griffin and Sam-AllenRoads before joining Itchepackesassa Creek.3.3.4 Tiger CreekFlow for this subwatershed originates in the wetland areas located in the vicinity <strong>of</strong> S.R. 39 andKnights-Griffin Road. The water in this area drains to the east for a short distance beforedischarging under S.R. 39 and an adjacent railroad structure. The creek system then turns to thenorth to flow almost 3.5 miles due north through the county’s Cone Ranch property. Theconfluence <strong>of</strong> Tiger and Blackwater Creeks is located approximately 1.25 miles upstream <strong>of</strong> S.R.39. A recent hydrologic restoration project in this area created significant changes to the flowregime <strong>of</strong> the creek. The intent <strong>of</strong> this project was to restore the creek from a man-made ditchsystem to its natural state with the purpose <strong>of</strong> increasing groundwater recharge, improving habitat,and enhancing water quality.3.4 Central Tributaries RegionThis region is comprised <strong>of</strong> three distinct stream systems, which flow towards the northwest andhave separate outfalls to the <strong>Hillsborough</strong> River. The region lies generally to the east <strong>of</strong> U.S. 301,west <strong>of</strong> S.R. 39, north <strong>of</strong> the Pemberton-Baker creek areas, and to the southwest <strong>of</strong> BlackwaterCreek. The subwatersheds modeled in this region are Two Hole Branch, Clay Gully East, andHollomans Branch. The Lake Thonotosassa / Flint Creek system also discharges to the<strong>Hillsborough</strong> River in this vicinity. <strong>Hillsborough</strong> <strong>County</strong> staff previously developed a StormwaterMaster Plan for this area. Results from this study were used in the evaluation <strong>of</strong> the <strong>Hillsborough</strong>River <strong>Water</strong>shed.3.4.1 Two Hole BranchThe Two Hole Branch subwatershed is located directly south <strong>of</strong> the Blackwater Creek area andextends westward from S.R. 39. The two branches <strong>of</strong> this creek flow towards the northwest andconsist <strong>of</strong> both well-defined waterways and inter-connected wetlands. The branches meandertowards the northwest for approximately 4.2 miles before converging. These branches crossBruton Road and pass near Justin Lane.3-3 <strong>Hillsborough</strong> River <strong>Water</strong>shed Management Plan
WATERSHED DESCRIPTIONAfter converging, the stream turns toward the west and flows for approximately 2.5 miles beforecrossing U.S. 301. This crossing is located 0.75 miles south <strong>of</strong> the <strong>Hillsborough</strong> River State Park.Two Hole Branch then discharges into the <strong>Hillsborough</strong> River approximately 1.75 miles due west <strong>of</strong>this crossing.3.4.2 Clay Gully EastThis subwatershed is located south <strong>of</strong> Two Hole Branch and consists <strong>of</strong> several tributary ditchsystems. The main ditch system originates in the area <strong>of</strong> Dormany Loop Road and flows westwardthrough a series <strong>of</strong> connected wetlands on private farms. The main ditch system becomeschannelized approximately 0.4 miles upstream <strong>of</strong> Five Acres Road and receives additional inflowfrom a second ditch that collects run<strong>of</strong>f from roadway ditches along Five Acres Road. The mainditch turns to flow in a northwesterly direction through agricultural lands before crossing St. FrancisLane. It is in the area west and north <strong>of</strong> St. Francis Lane that two systems from the south, and onefrom the north, join the main ditch. The longest southern ditch system originates at Five AcresRoad to the south <strong>of</strong> the main crossing and flows to the northwest before crossing St. FrancisLane. The shorter southern ditch system originates in the vicinity <strong>of</strong> Back Road and flowsnorthward to discharge under St. Francis Lane. The northern tributary to Clay Gully East has it’sheadwaters in several wetlands located on a large private farm. This tributary flows to the westbefore turning southwards to join the main ditch. The combined waterway flows westward andcrosses U.S. 301 approximately 1.0 miles south <strong>of</strong> the Two Hole Branch crossing. Clay Gullycontinues to flow westward for an additional 2.0 miles before joining the <strong>Hillsborough</strong> River.3.4.3 Hollomans BranchThis subwatershed is located to the south <strong>of</strong> Clay Gully East and extends from S.R. 39 near Plant<strong>City</strong> to U.S. 301. The main stream receives inflow from two areas located to the east <strong>of</strong> KeeneRoad and originates in the wetlands located to the south <strong>of</strong> Knights-Griffin Road, which dischargesunder Knights-Griffin Road 2.0 miles west <strong>of</strong> S.R. 39. The main stream flows approximately 2.3miles from this crossing in a northwesterly direction to Dormany Road. Downstream <strong>of</strong> theDormany Road crossing the stream turns towards the west and flows approximately 0.75 milesbefore being joined by a secondary ditch system.This small ditch system drains the area east <strong>of</strong> Mount Pless Road and south <strong>of</strong> Pless OrangeGroves. The ditch becomes well defined in the orange field and converges with the main streamapproximately 0.25 miles upstream <strong>of</strong> its crossing <strong>of</strong> Mount Pless Road. The main streamcontinues to flow westward for 0.4 miles before it crosses Five Acres Road north <strong>of</strong> LoghouseRoad. Approximately 900 feet downstream <strong>of</strong> this crossing, the main stream is joined by anotherwell-defined stream system.This tributary system originates in wetlands located south <strong>of</strong> Knights-Griffin Road and east <strong>of</strong> PlattRoad. The tributary flows to the northwest crossing Platt, Peeples, Knights-Griffin, and KapinsonRoads before turning to the west. Approximately 1.2 miles further downstream, this tributarycrosses Mount Pless Road and immediately turns to the northwest. The stream next passes underFive Acres Road near its intersection with Four Pines Road before converging with the main3-4 <strong>Hillsborough</strong> River <strong>Water</strong>shed Management Plan
CHAPTER 3stream. The main stream flows westward from this point approximately 0.5 miles before beingjoined by another tributary.This tributary originates in the wetlands located to the east <strong>of</strong> Stanley Road and south <strong>of</strong> Knights-Griffin Road. It flows towards the northwest crossing Cooper and Kinard Roads before crossingKnights-Griffin Road approximately 1900 feet west <strong>of</strong> Five Acres Road. This tributary continues t<strong>of</strong>low north and west until it converges with the main stream approximately 1600 feet upstream <strong>of</strong>the Ike Smith Road crossing. Downstream <strong>of</strong> Ike Smith Road, Hollomans Branch flows almost duewestward to the McIntosh Road Bridge. After McIntosh Road, the channel again turns to thenorthwest and crosses U.S. 301 approximately 1.75 miles south <strong>of</strong> the Clay Gully East crossing.Hollomans Branch discharges into the <strong>Hillsborough</strong> River approximately 1.0 miles downstream <strong>of</strong>the U.S. 301 crossing.3.5 Northwest Tributaries RegionThis region is comprised <strong>of</strong> four distinct waterways that originate in Pasco <strong>County</strong> and drainsouthwards to the <strong>Hillsborough</strong> River. They are generally bounded by Interstate 75 to the west,Indian Creek to the east, and the <strong>Hillsborough</strong> River to the south. The four subwatershedsincluded in this region are New River, Basset Branch, Clay Gully West, and Trout Creek.The Cypress Creek watershed, located to the west <strong>of</strong> Trout Creek, also drains southward to the<strong>Hillsborough</strong> River from Pasco <strong>County</strong>. The Cypress Creek <strong>Water</strong>shed Management Plan wasrecently developed for <strong>Hillsborough</strong> <strong>County</strong> by URS Greiner. Relevant data from that study havebeen incorporated into this watershed analysis.3.5.1 New RiverThis subwatershed‘s headwaters are located in a series <strong>of</strong> interconnected wetlands and unnamedswamps located north <strong>of</strong> S.R. 54 and east <strong>of</strong> C.R. 577 in Pasco <strong>County</strong>. The waterway becomeschannelized downstream <strong>of</strong> the Barnes Road area and meanders southwards. The river crossesS.R. 54, Chancey Road, and Creek Road before entering <strong>Hillsborough</strong> <strong>County</strong>. New Rivercontinues to flow southward and crosses Morris Bridge Road approximately 2.5 miles northeast <strong>of</strong>Branchton. The river then discharges into the river within the <strong>Hillsborough</strong> River State Parkboundary.3.5.2 Basset BranchThe Basset Branch subwatershed is located to the west <strong>of</strong> New River. It’s headwaters are a series<strong>of</strong> wetlands located to the south <strong>of</strong> S.R. 54 in Pasco <strong>County</strong>. The stream meanders southwardfrom these wetlands for approximately 3.9 miles before entering <strong>Hillsborough</strong> <strong>County</strong>. BassetBranch crosses Morris Bridge Rd 2.2 miles downstream <strong>of</strong> the county line before discharging to theriver approximately 1.2 miles further downstream.3-5 <strong>Hillsborough</strong> River <strong>Water</strong>shed Management Plan
WATERSHED DESCRIPTION3.5.3 Clay Gully WestThis subwatershed originates in several wetlands located to the east <strong>of</strong> Bruce B. Downs Boulevardand south <strong>of</strong> S.R. 54. Clay Gully West is situated between Trout Creek to the west and BassetBranch to the east. It does not have a well-defined watercourse in Pasco <strong>County</strong>, but flows southfrom the county line. At the county line, the waterway turns to flow more towards the southwest.Approximately 1.3 miles downstream <strong>of</strong> where Clay Gully West crosses the county boundary, itflows into the Pebble Creek subdivision. Within the subdivision it crosses Cypress Brook Road andcontinues to flow towards the southwest. The gully crosses Cross Creek Boulevard 0.5 milesdownstream <strong>of</strong> this roadway and enters the Hunter’s Green subdivision. The gully flows for anadditional 1.1 miles, turning to the southeast before crossing Hunter’s Green Drive. Downstream<strong>of</strong> this roadway, Clay Gully West flows into the Flatwoods Park recreational area. The waterwayreceives additional inflow from wetlands within the park while meandering southwards. A few trailsand access roads cross the stream before it discharges through a control structure under a pavedbike path to the Lower <strong>Hillsborough</strong> Flood Detention Area (LHFDA).3.5.4 Trout CreekTrout Creek’s headwaters are located in Pasco <strong>County</strong> to the east <strong>of</strong> S.R. 54. This area is knownas Cabbage Swamp, which is also at the headwaters <strong>of</strong> Cypress Creek. Trout Creek flows to thesoutheast and crosses Interstate 75 approximately 1.3 miles downstream <strong>of</strong> S.R. 54. The creekcontinues to flow towards the southeast for 2.1 miles before receiving inflow from a tributary to thenorth. This tributary is the outfall for a series <strong>of</strong> interconnected wetlands and prairie lands coveringapproximately 12.5 square miles in Pasco <strong>County</strong>. At this convergence, the creek turns and flowstowards the south for 0.5 miles before reaching the county line.Approximately 1.1 miles downstream <strong>of</strong> the county boundary, the creek enters the <strong>City</strong> <strong>of</strong> <strong>Tampa</strong>limits. Trout Creek continues to meander southward for approximately 2.4 miles before crossingBruce B. Downs Boulevard. These portions <strong>of</strong> the creek receive additional inflow from basinslocated to the east <strong>of</strong> Bruce B. Downs Boulevard. South <strong>of</strong> this roadway the creek re-entersunincorporated <strong>Hillsborough</strong> <strong>County</strong> as it flows into the Flatwoods Park recreational area. Thecreek continues to meander southwards for approximately 4.3 miles before it discharges to theLHFDA just upstream <strong>of</strong> control structure S-155.3.6 <strong>Hillsborough</strong> RiverThis region is comprised <strong>of</strong> the river above and below control structure S-155. This area alsoincludes the surrounding basins that contribute run<strong>of</strong>f to the river and Cow House Creek. The rivercan readily be divided into two sections separated by SWFWMD’s control structure S-155 (seeSection 5.3.4 for a more detailed description <strong>of</strong> S-155).3-6 <strong>Hillsborough</strong> River <strong>Water</strong>shed Management Plan
CHAPTER 33.6.1 <strong>Hillsborough</strong> River Above S-155This part <strong>of</strong> the river is bounded to the northeast by the Crystal Springs area, to the east by theBlackwater Creek and Central Tributaries Regions, and to the south by the Lake Thonotosassa /Flint Creek area and the <strong>Tampa</strong> Bypass Canal (TBC). This part <strong>of</strong> the river is characterized byrelatively narrow channel widths, a steeply sloped bottom, and flow to the southwest. The riverflows southwest from the Crystal Springs area for approximately 3.0 miles to the Blackwater Creekconvergence. This area receives inflows from the southwestern part <strong>of</strong> the <strong>City</strong> <strong>of</strong> Zephyrhills andBig Ditch. At this point the river widens out and turns towards the west to enter the <strong>Hillsborough</strong>River State Park approximately 2000 feet downstream <strong>of</strong> the Blackwater convergence. At about1600 feet downstream <strong>of</strong> this boundary, the river crosses U.S. 301 as it continues to flow towardsthe west. Indian Creek discharges into the wetlands <strong>of</strong> the river’s floodplain about 2000 feet furtherdownstream. The river continues to meander through the park in a southwesterly direction for 1.8miles before turning to flow more towards the south. Over the course <strong>of</strong> the next 5.2 miles, the<strong>Hillsborough</strong> River’s floodplain receives the discharge <strong>of</strong> New River, Basset Branch, Two Hole,Clay Gully East, Hollomans Branch, and Flint Creek. At the river’s confluence with Flint Creek, itturns to flow in a more westerly direction for approximately 1.9 miles before reaching Cow HouseCreek.At the Cow House Creek diversion the main river turns towards the north and flows forapproximately 1.6 miles before crossing Morris Bridge Road. After flowing under this roadway, theriver meanders towards the southwest for another 3.2 miles before reaching S-155. Thesesections <strong>of</strong> the river are within the LHFDA. A second diversionary waterway, the TBC Floodway,exists in this area to divert flow down the TBC when elevations in the LHFDA reach an elevation <strong>of</strong>26.0 feet.3.6.2 <strong>Hillsborough</strong> River Below S-155This part <strong>of</strong> the river is bounded on the north by S-155 and Cypress Creek and to the south by the<strong>Tampa</strong> Dam. Almost immediately downstream <strong>of</strong> S-155 the river flows under Interstate 75.Approximately 1.6 miles further southwest the river reaches Lettuce Lake Park and the University<strong>of</strong> South Florida’s Riverside Park. The river is joined by Cypress Creek in this area and turnstowards the south to flow under Fletcher Avenue approximately 1.0 miles further downstream. Theriver continues to meander towards the south and then east through the <strong>City</strong> <strong>of</strong> Temple Terrace for2 miles before being re-joined by Cow House Creek just upstream <strong>of</strong> the Fowler Avenue crossing.Another 2.3 miles further downstream, the river crosses Bullard Parkway. Approximately 1.2 milesdownstream <strong>of</strong> this roadway, the river encounters the Harney Canal diversion. The section <strong>of</strong> theriver downstream <strong>of</strong> Bullard Parkway is where the river begins to widen due to the <strong>Tampa</strong> Dam.Downstream <strong>of</strong> this roadway, the direction <strong>of</strong> the river changes from south to west and then northto form a 3.2-mile horseshoe bend around a peninsula in Temple Terrace. The river then crosses56 th Street North as it turns to the west and flows for approximately 1.0 miles before forminganother horseshoe bend. This 2.6-mile bend wraps around a portion <strong>of</strong> the <strong>City</strong> <strong>of</strong> <strong>Tampa</strong>. Justdownstream <strong>of</strong> this bend, the <strong>Hillsborough</strong> River reaches the <strong>Tampa</strong> Dam, which was used as aboundary in the analysis <strong>of</strong> the HRW.3-7 <strong>Hillsborough</strong> River <strong>Water</strong>shed Management Plan
WATERSHED DESCRIPTION3.7 TBC and TributariesThe Southwest Florida <strong>Water</strong> Management District (SWFWMD) manages a large portion <strong>of</strong> the<strong>Hillsborough</strong> River and its associated floodplain as the LHFDA for the purposes <strong>of</strong> flood control.The <strong>Tampa</strong> Bypass Canal (TBC) is a man-made canal system with several flow control structuresthat was built to provide diversionary flow from this area. The canal receives inflow from upperCow House Creek, the Floodway, and Harney Canal. The TBC also has approximately 80 riserstructures, which allow run<strong>of</strong>f from surrounding areas to reach the canal. Several <strong>of</strong> these risersare the outlets for the four main tributaries <strong>of</strong> the TBC. These subwatershed tributaries are theVandenberg, Williams, Mango and Falkenburg Areas.The TBC originates in the LHFDA as a trapezoidal channel that flows southward for approximately3000 feet and crosses Morris Bridge Road before being joined by flow from upper Cow HouseCreek. This portion <strong>of</strong> the canal has three, relatively flat sections but rapidly drops between themfrom elevation 26.0 feet to 20.0 feet and then to elevation 16.0 feet using two riprap lined sections.Control structure S-163, located on the west bank <strong>of</strong> the canal, allows for flow down the lowerportion <strong>of</strong> Cow House Creek during low flow conditions. The TBC then flows under Fowler Avenueand U.S. 301 approximately 1.2 and 1.9 miles downstream <strong>of</strong> this structure, respectively.Approximately 2000 feet downstream <strong>of</strong> U.S. 301, the canal flows through the Upper S-159 controlstructure. The canal then flows through the Middle S-159 control structure 1000 feet furtherdownstream. Harney Road intersects the canal between Middle S-159 and Lower S-159, located2000 feet further downstream.The TBC continues to flow southward for approximately 2200 feet before crossing Interstate 75.Located immediately upstream <strong>of</strong> I-75 is where the risers for the Vandenberg Area introduce flowto the canal. About 1800 feet south <strong>of</strong> I-75, the canal turns to the southwest for 4000 feet beforeturning again to the south. Immediately downstream <strong>of</strong> this bend is where the Harney Canal joinsthe TBC. The canal then flows southward past Vandenberg Airport and receives inflow from thisarea. Approximately 1.1 miles downstream <strong>of</strong> the Harney Canal confluence, the TBC flows underInterstate 4 and U.S. 92. The canal flows south for approximately 4000 feet before turning to thesouthwest. It is in this section that the TBC receives inflow from the Williams Area. Justdownstream <strong>of</strong> the bend, the canal flows through control structure S-162. Structure S-162 islocated 1000 feet upstream <strong>of</strong> the Martin Luther King Boulevard (MLK) crossing. The canalcrosses U.S. 301 for the second time 2500 feet southwest <strong>of</strong> MLK. There are risers located in thisstretch <strong>of</strong> the TBC that allow the Mango Area to discharge to the canal. Almost 1.0 miledownstream <strong>of</strong> U.S. 301, the canal crosses Broadway Boulevard and then the first <strong>of</strong> two railroadcrossings. After approximately 3500 feet, the TBC flows through the final control structure S-160.Downstream <strong>of</strong> S-160 the canal flows under a second railroad crossing, S.R. 60, and the CrossTown Expressway. The TBC then discharges in the Palm River approximately 2.5 miles upstream<strong>of</strong> the river’s mouth at McKay Bay.3-8 <strong>Hillsborough</strong> River <strong>Water</strong>shed Management Plan
CHAPTER 33.7.1 Vandenberg AreaThe Vandenberg Area originates in wetlands to the east <strong>of</strong> Interstate 75. After flowing under I-75,the ditches in this system converge to flow westward through the Vandenberg Airport property.Risers located just upstream <strong>of</strong> where the TBC crosses I-75 provide an outfall for this main ditch.Risers at two other locations along the TBC allow for the discharge <strong>of</strong> additional areas within thissubwatershed.3.7.2 Williams AreaThe headwaters <strong>of</strong> the Williams subwatershed are located in wetlands to the east <strong>of</strong> WilliamsRoad. <strong>Water</strong> discharges southward from the wetland and is joined by a branch that flowsnorthward. This branch originates south <strong>of</strong> Old <strong>Hillsborough</strong> Avenue and flows northward underU.S. 92 and I-4 before turning to the northwest and joining the main system. Approximately 600feet downstream <strong>of</strong> this confluence, the main ditch crosses Williams Road and flows towards thewest. The main ditch is joined by a second branch 2300 feet further downstream just before itflows under I-75. This branch originates south <strong>of</strong> U.S. 92 on both sides <strong>of</strong> I-75 and drainsnorthwards crossing U.S. 92, I-4, several ramps, and Sligh Avenue. This system then outfalls tothe main ditch just upstream <strong>of</strong> I-75. The main ditch continues to flow west downstream <strong>of</strong> I-75and crosses Falkenburg Road north <strong>of</strong> Sligh Avenue after approximately 950 feet <strong>of</strong> travel.Immediately upstream <strong>of</strong> the Falkenburg Road crossing, the main ditch is joined by flow fromanother small system that flows northwards from the I-4 area. The main system then crossesEureka and Wilkins roads approximately 0.65 and 0.7 miles further to the southwest, respectively.The risers for this system are located another 1000 feet downstream <strong>of</strong> the Wilkins Road crossing.3.7.3 Mango AreaThe Mango subwatershed originates in the area <strong>of</strong> Lake Mango and receives discharge from areasas far south as the intersection <strong>of</strong> Parsons Avenue and the railroad. The discharge from LakeMango flows under Lakewood Drive and to the west for approximately 2000 feet before turning tothe northwest and crossing Mango Avenue 600 feet further downstream. Approximately 500 feetfurther, the main system crosses a railroad and Broadway Avenue before turning more towards thewest and crossing several private drives including the access road to a large car dealership. 600feet downstream <strong>of</strong> this crossing, the ditch flows under I-75 and turns to the northwest again as itflows through the Sabal Business Park. The ditch then crosses Queen Palm Drive before goingunder Falkenburg Road. Downstream <strong>of</strong> this roadway, the ditch receives inflow from two smalltributaries and crosses Craigmont, Riga, and Sugar Palm Drives all within Sabal Park.Approximately 1000 feet downstream <strong>of</strong> the Sugar Palm crossing, the system reaches severalrisers and outfalls to the TBC.3.7.4 Falkenburg AreaThe Falkenburg Area system originates to the east <strong>of</strong> I-75 and drains westward under theinterstate. Approximately 900 feet to the west <strong>of</strong> I-75, the ditch crosses Hobbs Road before turningto the south and crossing Fisher Road 750 feet further downstream. The ditch continues to flowsouthwards for approximately 570 feet before tuning to the west and crossing Falkenburg Road1300 feet further downstream. The ditch continues to flow westward for approximately 4500 feet3-9 <strong>Hillsborough</strong> River <strong>Water</strong>shed Management Plan
WATERSHED DESCRIPTIONbefore crossing an apparently abandoned railroad spur. The system then crosses U.S. 301 andflows through part <strong>of</strong> the <strong>Tampa</strong> East Industrial Park before turning southwards and crossing arailroad track. After this crossing the ditch turns to the west and flows towards a private accessroad for the railroad and it’s outfall to the TBC.3-10 <strong>Hillsborough</strong> River <strong>Water</strong>shed Management Plan
CHAPTER 4HYDROLOGIC/HYDRAULIC MODELMETHODOLOGYGeneral Hydrology/Hydrologic Model DevelopmentThe U.S. Soil Conservation Service (SCS) Run<strong>of</strong>f Curve Number method was used to convertstormwater rainfall excess into run<strong>of</strong>f. This method uses soil and land cover characteristics toestimate run<strong>of</strong>f. The run<strong>of</strong>f hydrographs were developed using the SCS Dimensionless UnitHydrograph Method. The <strong>Hillsborough</strong> <strong>County</strong> Stormwater Management Model (HCSWMM)utilizes an SCS-Curve Number (CN) method to generate run<strong>of</strong>f hydrographs.The generated run<strong>of</strong>f hydrographs are assigned to the hydraulic model at specified, unique,junction locations. HCSWMM was utilized to route these inflows through the hydraulic system via amodified version <strong>of</strong> the Environmental Protection Agency (EPA) Stormwater Management Modelv.4.31a (SWMM) Extended Transport Block (EXTRAN). Output from the model consists <strong>of</strong> detailedstage and discharge versus time predictions at distinct system locations.4.1 Hydrology4.1.1 Hydrologic ModelThe SCS-CN method used by HCSWMM is a widely recognized and used technique for run<strong>of</strong>fhydrograph generation. It contains a number <strong>of</strong> options for different types <strong>of</strong> run<strong>of</strong>f volumecomputation and routing. To generate individual basin run<strong>of</strong>f hydrographs, this method requiresvalues for storm duration, total rainfall depth, time <strong>of</strong> concentration, area, run<strong>of</strong>f curve number,initial abstraction, and shape factor. The formulation <strong>of</strong> each <strong>of</strong> these parameters is discussedbelow.4.1.2 Rainfall Depths and DistributionThe depths for the 2.33-, 5-, 10-, 25-, 50-, and 100-year storm events were taken from isohyetalrainfall maps in the Southwest Florida <strong>Water</strong> Management District’s (SWFWMD) 1998Environmental Resource Permitting Information Manual (ERPM). For each storm event there aremultiple isohyetal contours within the <strong>Hillsborough</strong> River <strong>Water</strong>shed boundaries that represent adiscrete rainfall depth (Figures 4.1.1 through 4.1.6). To account for this variation, the isohyetalmaps were digitized and overlaid on the basin delineations. By interpolating (visually), each basinwas assigned a particular rainfall depth, based upon its proximity to the individual isohyetalcontour.The storm events were distributed over time with the SCS Florida Modified Type II rainfalldistribution. The distribution was also taken from the SWFWMD ERPM.4-1 <strong>Hillsborough</strong> River <strong>Water</strong>shed Management Plan
PASCO CO.HILLSBOROUGH CO.12.011.511.012.010.511.5HILLSBOROUGH CO.POLK CO.10.011.010.510.0
ASCO CO.LLSBOROUGH CO.2.01.511.012.010.511.5HILLSBOROUGH CO.POLK CO.10.011.010.510.0
PASCO CO.HILLSBOROUGH CO.12.011.511.012.010.511.5HILLSBOROUGH CO.POLK CO.10.011.010.510.0
PASCO CO.HILLSBOROUGH CO.12.011.511.012.010.511.5HILLSBOROUGH CO.POLK CO.10.011.01010.0
PASCO CO.HILLSBOROUGH CO.12.011.511.012.010.511.5HILLSBOROUGH CO.POLK CO.10.011.0
PASCO CO.HILLSBOROUGH CO.12.011.511.012.010.511.5HILLSBOROUGH CO.POLK CO.10.011.010.510.0
HYDROLOGIC/HYDRAULIC MODEL METHODOLOGY4.1.3 Time-<strong>of</strong>-Concentration (TOC)The TOC for a basin is defined as the time to equilibrium <strong>of</strong> the basin under a steady rainfallexcess, or the travel time <strong>of</strong> a wave to move from the hydraulically most distant point in the basin tothe outlet. Simply stated, this is the time when the outlet “feels” the inflow from every portion <strong>of</strong> thebasin.The TOC can be calculated in a variety <strong>of</strong> methods. The <strong>Hillsborough</strong> <strong>County</strong> StormwaterTechnical Manual specifies breaking the flow path into its three main components: Overland flow,Shallow Concentrated Flow, and Channel / Pipe Flow. Overland Flow is calculated via thekinematic wave equation, shallow concentrated flow by the SCS equations relating velocity towatercourse slope for paved and unpaved areas, and channel / pipe flow by assuming a constantvelocity over the length <strong>of</strong> flow. The TOC is thus calculated by summing all <strong>of</strong> the required flowregimes in any given combination for a specific basin.The SWFWMD topographic aerials and USGS Quadrangle maps were utilized to delineate flowpaths for the respective components in each basin. These flow paths were then measured forlength and the respective calculations performed to obtain time-<strong>of</strong>-concentration values.4.1.4 Basin DelineationsThe determination <strong>of</strong> the basin boundaries within the watershed were made on the basis <strong>of</strong> theexisting physical features such as the topography, storage areas, and conveyance elements(pipes, channels, etc.) which describe the hydraulic system. Numerous sources were used todefine the individual basins, based upon this system. The main sources were the SWFWMDone-foot contour topographic aerial maps (1”=200’ scale), SWFWMD two-foot contour topographicaerial maps (1”=1000’), and the United States Geological Survey (USGS) Quadrangle maps(1”=2000’ scale). The SWFWMD mapping used in the development <strong>of</strong> the basin delineations forthe <strong>Hillsborough</strong> River <strong>Water</strong>shed Management Plan (HRWMP) range in date from 1978 to 1981.This information was used to delineate the majority <strong>of</strong> the basin boundaries, within <strong>Hillsborough</strong><strong>County</strong>, and the overland connections between them.Considering the dates <strong>of</strong> the topographic information, it is obvious that additional development hasoccurred within the watershed since the aerial mapping. This development sometimes resulted inthe modification <strong>of</strong> the flow patterns, as determined from the aerial topography. To account forthese alterations, where significant, additional data was collected to assist in the development <strong>of</strong>the basin boundaries.<strong>Hillsborough</strong> <strong>County</strong> aerial photographs (dated 1997) were reviewed to identify areas <strong>of</strong> potentialchange to the basin delineations. Construction plans, when obtainable, for State and <strong>County</strong>roadways, and residential and commercial developments, were utilized to determine the basinboundaries. Additionally, limited field inspections were utilized to resolve conflicting informationfrom the collected information.4-8 <strong>Hillsborough</strong> River <strong>Water</strong>shed Management Plan
CHAPTER 4The resulting basin delineations were digitized utilizing Autocad Map 2000 and were subsequentlyimported into ArcInfo (ESRI Version 7.0) for subsequent usage in run<strong>of</strong>f curve numberdeterminations. Each basin was assigned a unique six digit identifier as specified by the<strong>Hillsborough</strong> <strong>County</strong> Stormwater Management Master Plan Hydrologic and Hydraulic Model Set-upStandard, (<strong>Hillsborough</strong> <strong>County</strong> Stormwater Management Section, Engineering Division, PublicWorks Department, February 1999). Table 4.1.1 shows the methodology as applied to the<strong>Hillsborough</strong> River <strong>Water</strong>shed. All GIS data has been prepared in compliance with the GIS dataformat outlined by the Southwest Florida <strong>Water</strong> Management District <strong>Water</strong>shed DataManagement System for Engineering, (SWFWMD Engineering and GIS Section, May 1999).These basin delineations were presented to <strong>Hillsborough</strong> <strong>County</strong>, on a subwatershed basis, forreview and approval, prior to commencing the hydrologic and hydraulic modeling efforts.It should be noted that the basin delineations presented in this report were developed to a level <strong>of</strong>detail required for master planning purposes. Site specific, or individual development evaluations,if necessary, may require additional detail.4.1.5 Run<strong>of</strong>f Curve NumbersThe SCS Run<strong>of</strong>f Curve Number (CN) method was used to generate run<strong>of</strong>f from rainfall. Themethod estimates the run<strong>of</strong>f from soil and land cover characteristics. Run<strong>of</strong>f Curve numbers areassigned based upon the land use and hydrologic soil group.4.1.5.1 SoilsThe SWFWMD GIS data provided a soil coverage, which contains polygons with a unique mapunit identifier (MUID) for each soil type. The SCS Soil Surveys <strong>of</strong> <strong>Hillsborough</strong>, Pasco, and PolkCounties were consulted to determine the descriptions <strong>of</strong> these soil types and theircorresponding hydrologic soil grouping. Table 4.1.2 contains the MUID, description, andhydrologic soil groupings for the soils within the respective counties.4.1.5.2 Land Use1995 land use coverage was also provided by SWFWMD, containing polygons with a uniqueidentifier based upon the Florida Land Use Cover and Classification System (FLUCCS). Table4.1.3 contains the FLUCCS codes and corresponding land use categories.4.1.5.3 Curve Number GenerationUtilizing ARCInfo, the land use and soil coverages were intersected with each other to generatepolygons consisting <strong>of</strong> a single land cover and soil type. These resulting polygons were thenintersected with the basin delineations, further subdividing the polygons. This procedure resultsin the generation <strong>of</strong> unique polygons consisting <strong>of</strong> a single basin number, land use, and soil type.Table 4.1.4 contains the lookup table, provided by <strong>Hillsborough</strong> <strong>County</strong>, utilized to assign a run<strong>of</strong>fcurve number to each unique polygon. These resulting curve numbers were then area weightedto develop individual basin curve number for use in the hydrologic modeling.4-9 <strong>Hillsborough</strong> River <strong>Water</strong>shed Management Plan
Table 4.1.1 Basin Numbering SchemeBasin Numbering<strong>Water</strong>shed Sub-<strong>Water</strong>shedBranch First 3 - 4 digits<strong>Hillsborough</strong> River Below S-155 600<strong>Hillsborough</strong> River Above S-155 605610Falkenburg 612<strong>Tampa</strong> By-Pass CanalMango 614Williams 616Vanbenburg 6175Cypress Creek na 620<strong>Hillsborough</strong>RiverDescription630Trout CreekClay Gulley West 635Lake Thonotosassa / Flint Creek na 6406501 652Holloman's Branch2 6543 6564 6586601 661Clay Gulley East2 6623 6634 6646651 666Two Hole Branch2 6673 6684 669Basset Branch 670New River 673Indian Creek 6766801 68052 68103 68156821 6825Tiger Creek2 6833 6835Blackwater Creek6841 68452 6853 6855Itchepackesassa6861 6865East Canal2 6873 6875Big Ditch 688Crystal Springs 689
Table 4.1.2 Hydrologic Soil Group Determination TableMuid <strong>County</strong> Soil Type/Description Soil Group57002 <strong>Hillsborough</strong> Adamsville fine sand C57003 <strong>Hillsborough</strong> Archbold fine sand A57004 <strong>Hillsborough</strong> Arents, nearly level D57005 <strong>Hillsborough</strong> Basinger, Holopaw and Samsula soils, depressional D57006 <strong>Hillsborough</strong> Broward-Urban land complex D57007 <strong>Hillsborough</strong> Candler fine sand, 0 to 5 percent slopes C57008 <strong>Hillsborough</strong> Candler fine sand, 5 to 12 percent slopes A57009 <strong>Hillsborough</strong> Candler-Urban land complex, 0 to 5 percent slopes A57010 <strong>Hillsborough</strong> Chobee loamy fine sand B/D57011 <strong>Hillsborough</strong> Chobee muck, depressional D57012 <strong>Hillsborough</strong> Chobee sandy loam, frequently flooded B/D57013 <strong>Hillsborough</strong> Eaton fine sand D57014 <strong>Hillsborough</strong> Eaton mucky sand, depressional D57015 <strong>Hillsborough</strong> Felda fine sand B/D57016 <strong>Hillsborough</strong> Felda fine sand, occasionally flooded B/D57017 <strong>Hillsborough</strong> Floridana fine sand B/D57018 <strong>Hillsborough</strong> Fort Meade loamy fine sand, 0 to 5 percent slopes A57019 <strong>Hillsborough</strong> Gainesville loamy fine sand, 0 to 5 percent slopes A57020 <strong>Hillsborough</strong> Gypsum land B/D57021 <strong>Hillsborough</strong> Immokalee fine sand B/D57022 <strong>Hillsborough</strong> Immokalee-Urban land complex A57023 <strong>Hillsborough</strong> Kendrick fine sand 2 to 5 percent slopes D57024 <strong>Hillsborough</strong> Kesson muck, frequently flooded A57025 <strong>Hillsborough</strong> Lake fine sand, 0 to 5 percent slopes C57026 <strong>Hillsborough</strong> Lochloosa-Micanopy fine sands, 0 to 5 percent slopes C57027 <strong>Hillsborough</strong> Malabar fine sand B/D57028 <strong>Hillsborough</strong> Millhopper-Urban land complex, 0 to 5 percent slopes A57029 <strong>Hillsborough</strong> Myakka fine sand B/D57030 <strong>Hillsborough</strong> Myakka fine sand, frequently flooded D57032 <strong>Hillsborough</strong> Myakka-Urban land complex B/D57033 <strong>Hillsborough</strong> Ona fine sand B/D57034 <strong>Hillsborough</strong> Ona-Urban land complex B/D57035 <strong>Hillsborough</strong> Orlando fine sand, 0 to 5 percent slopes A57036 <strong>Hillsborough</strong> Orsino fine sand, 0 to 5 percent slopes A57037 <strong>Hillsborough</strong> Paisley fine sand, depressional D57038 <strong>Hillsborough</strong> Pinellas fine sand B/D57039 <strong>Hillsborough</strong> Arents, very steep C57041 <strong>Hillsborough</strong> Pomello fine sand, 0 to 5 percent slopes C57042 <strong>Hillsborough</strong> Pomello-Urban land complex, 0 to 5 percent slopes C57043 <strong>Hillsborough</strong> Quartzipsamments, nearly level B57044 <strong>Hillsborough</strong> St. Augustine fine sand C57045 <strong>Hillsborough</strong> St. Augustine-Urban land complex C57046 <strong>Hillsborough</strong> St. Johns fine sand B/D57047 <strong>Hillsborough</strong> Seffner fine sand C57050 <strong>Hillsborough</strong> Slickens D57051 <strong>Hillsborough</strong> Haplaquents, clayey D57052 <strong>Hillsborough</strong> Smyrna fine sand B/D57053 <strong>Hillsborough</strong> Tavares-Millhopper fine sands, 0 to 5 percent slopes A57054 <strong>Hillsborough</strong> Tavares-Millhopper fine sands, 5 to 8 percent slopes A
Table 4.1.2 Hydrologic Soil Group Determination TableMuid <strong>County</strong> Soil Type/Description Soil Group57055 <strong>Hillsborough</strong> Tavares-Urban land complex, 0 to 5 percent slopes A57056 <strong>Hillsborough</strong> Urban land B/D57057 <strong>Hillsborough</strong> Wabasso fine sand B/D57058 <strong>Hillsborough</strong> Wabasso-Urban land complex B/D57059 <strong>Hillsborough</strong> Winder fine sand B/D57060 <strong>Hillsborough</strong> Winder fine sand, frequently flooded B/D57061 <strong>Hillsborough</strong> Zolfo fine sand C57099 <strong>Hillsborough</strong> <strong>Water</strong> W101001 Pasco Wachula fine snad, 0 to 5 percent slopes B/D101002 Pasco Pomona fine sand B/D101003 Pasco Pineda fine sand B/D101004 Pasco Felda fine sand B/D101005 Pasco Myakka fine sand B/D101006 Pasco Tavares sand, 0 to 5 percent slopes A101007 Pasco Sparr fine sand, 0 to 5 percent slopes C101008 Pasco Sellers mucky loamy fine sand B/D101009 Pasco Ona fine sand B/D101010 Pasco Vero fine sand B/D101011 Pasco Adamsville fine sand C101012 Pasco Astatula fine sand, 0 to 5 percent slopes A101013 Pasco Candler fine sand, 0 to 5 percent slopes A101014 Pasco Candler fine sand, 5 to 8 percent slopes A101015 Pasco Tavares-Urban land complex, 0 to 5 percent slopes A101016 Pasco Zephyr muck D101017 Pasco Immokalee fine sand B/D101018 Pasco Electra Variant fine sand, 0 to 5 percent slopes C101019 Pasco Paola fine sand, 0 to 8 percent slopes A101020 Pasco Aripeka fine sand C101021 Pasco Smyrna fine sand A/D101022 Pasco Basinger fine sand A/D101023 Pasco Basinger fine sand, depressional B/D101024 Pasco Quartzipsamments, shaped, 0 to 5 percent slopes B101025 Pasco Jonesville fine sand, 0 to 5 percent slopes B101026 Pasco Narcoossee fine sand C101027 Pasco Anclote fine sand D101028 Pasco Pits D101029 Pasco Lacoochee complex D101030 Pasco Okeelanta-Terra Ceia association B/D101031 Pasco Udalfic Arents-Urban land complex B/D101032 Pasco Lake fine sand, 0 to 5 percent slopes A101034 Pasco Pompano fine sand B/D101035 Pasco EauGallie fine sand B/D101036 Pasco Candler-Urban land complex, 0 to 8 percent slopes A101037 Pasco Paola-Urban land complex, 0 to 8 percent slopes A101038 Pasco Urban land B/D101039 Pasco Chobee soils, frequently flooded B/D101040 Pasco Paisley fine sand D101041 Pasco Pits-Dumps complex D101042 Pasco Pomello fine sand, 0 to 5 percent slopes C
Table 4.1.2 Hydrologic Soil Group Determination TableMuid <strong>County</strong> Soil Type/Description Soil Group101043 Pasco Arredondo fine sand, 0 to 5 percent slopes A101044 Pasco Arredondo fine sand, 5 to 8 percent slopes A101045 Pasco Kendrick fine sand, 0 to 5 percent slopes A101046 Pasco Cassia fine sand, 0 to 5 percent slopes C101047 Pasco Weekiwachee muck D101048 Pasco Lochloosa fine sand, 0 to 5 percent slopes C101049 Pasco Blichton fine sand, 0 to 2 percent slopes D101050 Pasco Blichton fine sand, 2 to 5 percent slopes D101051 Pasco Blichton fine sand, 5 to 8 percent slopes D101052 Pasco Samsula muck B/D101053 Pasco Sparr fine sand, 5 to 8 percent slopes C101054 Pasco Flemington Variant fine sand, 2 to 5 percent slopes D101055 Pasco Homosassa mucky fine sandy loam D101056 Pasco EauGallie-Urban land complex B/D101057 Pasco Vero Variant fine sand B/D101058 Pasco Tomoka muck A/D101059 Pasco Newnan fine sand, 0 to 5 percent slopes C101060 Pasco Palmetto-Zephyr-Sellers complex D101061 Pasco Pompano fine sand, frequently flooded D101062 Pasco Kendrick fine sand, 5 to 8 percent slopes A101063 Pasco Delray mucky fine sand D101064 Pasco Nobelton fine sand, 0 to 5 percent slopes C101065 Pasco Gainesville loamy fine sand, 0 to 5 percent slopes A101066 Pasco Micanopy fine sand, 2 to 5 percent slopes C101067 Pasco Kanapaha fine sand, 0 to 5 percent slopes A/D101068 Pasco Lake fine sand, 5 to 8 percent slopes A101069 Pasco Millhopper fine sand, 0 to 5 percent slopes A101070 Pasco Placid fine sand B/D101071 Pasco Anclote-Tavares-Pomello association, flooded D101072 Pasco Orlando fine sand, 0 to 5 percent slopes A101073 Pasco Zolfo fine sand C101074 Pasco Candler Variant fine sand, 0 to 5 percent slopes A101075 Pasco Beaches A101076 Pasco Bessie muck D101099 Pasco <strong>Water</strong> W105002 Polk Apopka fine sand, 0 to 5 percent slopes A105003 Polk Candler sand, 0 to 5 percent slopes A105004 Polk Candler sand, 5 to 8 percent slopes A105005 Polk EauGallie fine sand B/D105006 Polk Eaton mucky fine sand D105007 Polk Pomona fine sand B/D105008 Polk Hydraquents, clayey D105009 Polk Lynne sand B/D105010 Polk Malabar fine sand B/D105011 Polk Arents-<strong>Water</strong> complex D105012 Polk Neilhurst sand, 1 to 5 percent slopes A105013 Polk Samsula muck B/D105014 Polk Sparr fine sand, 0 to 5 percent slopes C105015 Polk Tavares fine sand, 0 to 5 percent slopes A
Table 4.1.2 Hydrologic Soil Group Determination TableMuid <strong>County</strong> Soil Type/Description Soil Group105016 Polk Urban land B/D105017 Polk Smyrna and Myakka fine sands B/D105019 Polk Floridana mucky fine sand, depressional D105020 Polk Fort Meade sand, 0 to 5 percent slopes A105021 Polk Immokalee sand B/D105022 Polk Pomello fine sand C105023 Polk Ona fine sand B/D105024 Polk Nittaw sandy clay loam, frequently flooded D105025 Polk Placid and Myakka fine sands, depressional D105026 Polk Lochloosa fine sand C105027 Polk Kendrick fine sand, 0 to 5 percent slopes A105029 Polk St. Lucie fine sand, 0 to 5 percent slopes A105030 Polk Pompano fine sand B/D105031 Polk Adamsville fine sand C105032 Polk Kaliga muck B/D105033 Polk Holopaw fine sand, depressional D105034 Polk Anclote mucky fine sand, depressional D105035 Polk Hontoon muck B/D105036 Polk Basinger mucky fine sand, depressional D105037 Polk Placid fine sand, frequently flooded D105038 Polk Electra fine sand C105039 Polk Arents, clayey substratum B/D105040 Polk Wachula fine sand B/D105041 Polk St. Johns sand B/D105042 Polk Felda fine sand B/D105043 Polk Oldsmar fine sand B/D105044 Polk Paisley fine sand D105046 Polk Astatula sand, 0 to 8 percent slopes A105047 Polk Zolfo fine sand C105048 Polk Chobee fine sandy loam, depressional D105049 Polk Adamsville-Urban land complex C105050 Polk Candler-Urban land complex, 0 to 5 percent slopes A105051 Polk Pomona-Urban land complex B/D105053 Polk Myakka-Immokalee-Urban land complex B/D105054 Polk Pomello-Urban land complex C105055 Polk Sparr-Urban land complex, 0 to 5 percent slopes C105057 Polk Haplaquents, clayey D105058 Polk Udorthents, excavated D105059 Polk Arents-Urban land complex, 0 to 5 percent slopes C105060 Polk Arents, sandy C105061 Polk Arents, organic substratum-Urban land complex B105062 Polk Wabasso fine sand B/D105063 Polk Tavares-Urban land complex, 0 to 5 percent slopes A105064 Polk Neilhurst-Urban land complex, 1 to 5 percent slopes A105066 Polk Fort Meade-Urban land complex, 0 to 5 percent slopes A105067 Polk Bradenton fine sand B/D105068 Polk Arents, 0 to 5 percent slopes C105070 Polk Duette fine sand A105072 Polk Bradenton-Felda-Chobee association, frequently flooded D
Table 4.1.2 Hydrologic Soil Group Determination TableMuid <strong>County</strong> Soil Type/Description Soil Group105073 Polk Gypsum land D105074 Polk Narcoossee sand C105075 Polk Valkaria sand B/D105076 Polk Millhopper fine sand, 0 to 5 percent slopes A105077 Polk Satellite sand C105078 Polk Paisley fine sand, stony subsurface D105080 Polk Chobee fine sandy loam, frequently flooded B/D105081 Polk St. Augustine sand C105082 Polk Felda fine sand, frequently flooded B/D105083 Polk Archbold sand, 0 to 5 percent slopes A105085 Polk Winder fine sand, depressional D105086 Polk Felda fine sand, depressional D105087 Polk Basinger fine sand B/D105099 Polk <strong>Water</strong> W
Table 4.1.3 FLUCCS Code Description TableFLUCCSCode1100Land Use DescriptionResidential LOW Density 5 DUA1300 Residential High Density1400 Commercial and Services1500 Industrial1600 Extractive1700 Institutional1800 Recreational1900 Open Land2100 Cropland and Pastureland2140 Row Crops2200 Tree Crops2300 Feeding Operations2400 Nurseries and Vineyards2500 Specialty Farms2550 Tropical Fish Farms2600 Other Open Lands (Rural)3100 Herbaceous3200 Shrub and Brushland3300 Mixed Rangeland4100 Upland Coniferous Forest4110 Pine Flatwoods4120 Longleaf Pine - Xeric Oak4200 Upland Hardwood Forests - Part I4340 Hardwood Conifer Mixed4400 Tree Plantations5100 Streams and <strong>Water</strong>ways5200 Lakes5300 Reservoirs5400 Bays and Estuaries6100 Wetland Hardwood Forests6110 Bay Swamps6120 Mangrove Swamps6150 Stream and Lake Swamps (Bottomland)6200 Wetland Confierous Forests6210 Cypress6300 Wetland Forests Mixed6400 Vegetated non-Forested Wetlands6410 Freshwater Marshes6420 Saltwater Marshes6430 Wet Praries6440 Emergent Aquatic Vegetation6500 Non-Vegetated6510 Tidal Flats / Submerged Shallow Platform6520 Shorelines6530 Intermittent Ponds7100 Beaches other than Swimming Beaches7400 Disturbed Land8100 Transportation8200 Communication8300 Utilities
Table 4.1.4 Run<strong>of</strong>f Curve Number (CN) Lookup TableLand Use DescriptionFLUCCS Hydrologic Soil GroupCode A B C D A_D B_D WResidential LOW Density 5 DUA 1200 57 72 81 86 72 83.5 100Residential High Density 1300 77 85 90 92 85 91 100Commercial and Services 1400 89 92 94 95 92 94.5 100Industrial 1500 81 88 91 93 88 92 100Extractive 1600 77 86 91 94 86 92.5 100Institutional 1700 59 81 87 90 81 88.5 100Recreational 1800 49 69 79 84 84 81.5 100Open Land 1900 39 61 74 80 80 77 100Cropland and Pastureland 2100 49 69 79 84 84 81.5 100Row Crops 2140 49 69 79 84 84 81.5 100Tree Crops 2200 44 65 77 82 82 79.5 100Feeding Operations 2300 73 83 89 92 92 90.5 100Nurseries and Vineyards 2400 57 73 82 86 86 84 100Specialty Farms 2500 59 74 82 86 86 84 100Tropical Fish Farms 2550 59 74 82 86 86 84 100Other Open Lands (Rural) 2600 30 58 71 78 78 74.5 100Herbaceous 3100 63 71 81 89 89 85 100Shrub and Brushland 3200 35 56 70 77 77 73.5 100Mixed Rangeland 3300 49 69 79 84 84 81.5 100Upland Coniferous Forest 4100 45 66 77 83 83 80 100Pine Flatwoods 4110 57 73 82 86 86 84 100Longleaf Pine - Xeric Oak 4120 43 65 76 82 82 79 100Upland Hardwood Forests - Part I 4200 36 60 73 79 79 76 100Hardwood Conifer Mixed 4340 36 60 73 79 79 76 100Tree Plantations 4400 36 60 73 79 79 76 100Streams and <strong>Water</strong>ways 5100 100 100 100 100 100 100 100Lakes 5200 100 100 100 100 100 100 100Reservoirs 5300 100 100 100 100 100 100 100Bays and Estuaries 5400 100 100 100 100 100 100 100Wetland Hardwood Forests 6100 98 98 98 98 98 98 98Bay Swamps 6110 98 98 98 98 98 98 98Mangrove Swamps 6120 98 98 98 98 98 98 98Stream and Lake Swamps (Bottomland) 6150 98 98 98 98 98 98 98Wetland Confierous Forests 6200 98 98 98 98 98 98 98Cypress 6210 98 98 98 98 98 98 98Wetland Forests Mixed 6300 98 98 98 98 98 98 98Vegetated non-Forested Wetlands 6400 98 98 98 98 98 98 98Freshwater Marshes 6410 98 98 98 98 98 98 98Saltwater Marshes 6420 98 98 98 98 98 98 98Wet Praries 6430 98 98 98 98 98 98 98Emergent Aquatic Vegetation 6440 98 98 98 98 98 98 98Non-Vegetated 6500 98 98 98 98 98 98 98Tidal Flats / Submerged Shallow Platform 6510 98 98 98 98 98 98 98Shorelines 6520 98 98 98 98 98 98 98Intermittent Ponds 6530 98 98 98 98 98 98 98Beaches other than Swimming Beaches 7100 77 86 91 94 94 92.5 100Disturbed Land 7400 77 86 91 94 94 92.5 100Transportation 8100 81 88 91 93 88 92 100Communication 8200 81 88 91 93 88 92 100Utilities 8300 81 88 91 93 88 92 100
HYDROLOGIC/HYDRAULIC MODEL METHODOLOGY4.1.6 Initial AbstractionAn initial abstraction value <strong>of</strong> 0.2 is utilized throughout the study area as specified by <strong>Hillsborough</strong><strong>County</strong>. Soil storage is computed as a function <strong>of</strong> the initial abstraction and run<strong>of</strong>f curve numberaccording to SCS guidelines and literature.4.1.7 Shape FactorThe <strong>Hillsborough</strong> <strong>County</strong> Stormwater Technical Manual specifies that a shape factor <strong>of</strong> 256,instead <strong>of</strong> the 484 normally associated with the HEC-1 hydrologic computer model, be utilized forhydrologic analysis relating to areas within the <strong>County</strong> because <strong>of</strong> the flat terrain. This value wasmodified to 175, for selected basins, during the calibration / verification process as described inSection 5.3.1.4.2 HYDRAULICS4.2.1 Hydraulic ModelThe <strong>Hillsborough</strong> <strong>County</strong> Storm <strong>Water</strong> Management Model utilizes a modified version <strong>of</strong> theEnvironmental Protection Agency (EPA) Stormwater Management Model v.4.31a (SWMM)Extended Transport Block (EXTRAN). The version utilized in this study was <strong>Hillsborough</strong> <strong>County</strong>SWMM 4.31B4. EXTRAN uses a numerical method to solve the St. Venant Equations forgradually varied, unsteady flow in open channels, and computes time dependent values for flowrate and water surface elevation.Modifications within the <strong>County</strong> version, performed by <strong>County</strong> staff, include assigning entrance andexit loss coefficients, assigning reach numbers to weirs and orifices, provisions for modelingelliptical and arch pipes, and a “stretch” factor to elongate conduits that, left unaltered, would benumerically unstable. The addition <strong>of</strong> these parameters allows the preservation <strong>of</strong> the originalinput data for pipe length, geometry, and type.4.2.2 Natural ChannelsThe data for the channel geometry was derived from a variety <strong>of</strong> locations. The first, and mostprevalent, was from channel cross-section field survey data obtained by the Ayres Associatessurvey team. Additional information was obtained from previous studies <strong>of</strong> specific channelreaches, or construction plans in particular locations. Previous studies include Federal EmergencyManagement Agency (FEMA) Flood Insurance Studies (FIS), SWFWMD studies, and studiesperformed by other consultants for a variety <strong>of</strong> public clients (See Table 4.2.1). Channel geometryfrom these sources was supplemented with information taken from the SWFWMD topographicaerials for overbank detail.4-18 <strong>Hillsborough</strong> River <strong>Water</strong>shed Management Plan
Table 4.2.1 Historical Studies <strong>of</strong> Channel Systems in the <strong>Hillsborough</strong> River <strong>Water</strong>shedData Title Author/ Source Date Description RemarksTrout Creek Floodway SWFWMD 1974 FDA InvestigationFlood Pr<strong>of</strong>iles <strong>of</strong> the Lower<strong>Hillsborough</strong> River, FloridaUSGS 1974 Flood Study Pre-LHFDAFlood Pr<strong>of</strong>iles for CypressCreek; West-Central Fla.USGS 1978 Flood StudyFloodplain Information on theHills. River <strong>Water</strong>shedSWFWMD 1979 Flood StudyCross-sectional data for <strong>Hillsborough</strong> Riverand New RiverFloodplain Info. on BlackwaterCrk <strong>Water</strong>shedSWFWMD 1980 Flood StudyCross-sectional data for Blackwater andItchepackesassa Creeks, and East CanalRegulation Manual for LHFDAand TBCUSACOE 1983operations manual designhydrographsStructure Information, Gate Opening Criteria,Rating CurvesSabal Industrial Park MasterDrainage Plan<strong>Hillsborough</strong> <strong>County</strong> 1983Miscellaneous basins andpipingStructure Information, Basin BoundariesFloodplain Information onTrout CreekSWFWMD 1983 Flood Study Cross-sectional data for Trout CreekLakeview Village MasterDrainage Plan<strong>Hillsborough</strong> <strong>County</strong> 1984Miscellaneous basins andpipingStructural Information, Basin BoundariesFloodplain Information onCypress CreekSWFWMD 1986 Flood Study Report OnlyInvestigation <strong>of</strong> TBCSecondary drainage sys.SWFWMD 1987secondary drainage into TBCpeak flowBasin Boundaries, Peak DischargesMLK Drainage Maps FDOT 1989Miscellaneous basins andpipingStructural Information, Basin BoundariesTimber Pond Subd. MasterDrainage Plan<strong>Hillsborough</strong> <strong>County</strong> 1989Miscellaneous basins andpipingStructural Information, Basin BoundariesFlood insurance Study:<strong>Hillsborough</strong> <strong>County</strong>FEMA 1992 Flood Insurance Study <strong>Water</strong> Surface ElevationsPolk <strong>County</strong> Flood InsuranceStudyPolk <strong>County</strong> 1996 Flood Study ExcerptsSabal Center MasterStormwater Plan<strong>Hillsborough</strong> <strong>County</strong> 1996Miscellaneous basins andpipingStructural Information, Basin BoundariesPolk <strong>County</strong> Flood InsuranceStudy AppealPolk <strong>County</strong> 1997 Appeal for Itchepackesassa ExcerptsDigital Hydrologic andHydraulic data setsPolk <strong>County</strong> 1997 Appeal for ItchepackesassaCross-sectional data for Blackwater Creek,Itchepackesassa Creek, and East CanalTiger Creek StormwaterManagement Master PlanFlorida EngineeringEnvironmental Services1997Tiger Creek ADICPR Model &ReportReplaced by Feb-98Analysis <strong>of</strong> Flows betweenWith. and Hills. RiversSWFWMD 1998 Investigation <strong>of</strong> discharge Boundary Condition Data
Table 4.2.1 Historical Studies <strong>of</strong> Channel Systems in the <strong>Hillsborough</strong> River <strong>Water</strong>shedData Title Author/ Source Date Description RemarksI-75 Straight Line Diagram FDOT 1998 Major Drainage Structures Structural InformationI-4 Straight Line Diagram FDOT 1998 Major Drainage Structures Structural InformationTiger Creek StormwaterManagement Master PlanFlorida EngineeringEnvironmental Services1998Tiger Creek ADICPR Model &ReportStructural Information, Basin BoundariesEast Canal SurveyPr<strong>of</strong>essional EngineeringConsultants1999Drainage Structure andChannel SurveyCross-sectional data, Structural InformationS.R. 60 Straight Line Diagram FDOT 1999 Major Drainage Structures Structural InformationTBC Survey George F. Young 1999Drainage Structure andChannel SurveyCross-sectional data, Structural InformationFloodplain Analysis - UnnamedEast-Trib to TBCParsons Engineering Science /<strong>Tampa</strong> Bay <strong>Water</strong>1999ADICPR Model - 2,008 acrebasinCross-sectional data, Structural Information,Basin BoundariesI-4 Drainage Maps FDOT VariesMiscellaneous basins andpipingStructural Information, Basin BoundariesS.R. 60 Drainage Maps FDOT VariesMiscellaneous basins andpipingStructural Information, Basin BoundariesI-75 Drainage Maps FDOT VariesMiscellaneous basins andpipingStructural Information, Basin Boundaries
CHAPTER 4Manning’s roughness coefficients were evaluated from the following literature sources:1) Determination <strong>of</strong> Roughness Coefficients for Streams In West-Central Florida, US GeologicalSurvey Open-File Report 96-2262) Guide for Selecting Manning’s Roughness Coefficients for Natural Channels and Flood Plains,US Department <strong>of</strong> Transportation, Federal Highway Administration Report No. FHWA-TS-84-2043) Open Channel Hydraulics, 1959, V.T. ChowThis information, combined with Ayres Associates staff’s previous experience with channelsystems throughout Florida, was utilized to set the initial values for Manning’s roughness. Thesevalues were either confirmed or adjusted during the calibration / verification phase <strong>of</strong> the study.4.2.3 ConduitsLike natural channel geometry, the data for conduits were taken from field survey information, andsupplemented with information from previous studies or construction plans, when available.The data required for the entrance, exit, and bend losses were taken from the Florida Department<strong>of</strong> Transportation (FDOT) Drainage Manual for concrete box culverts, as well as concrete andcorrugated metal pipe culverts. The “stretch” factor was set to ensure no culvert length would fallbelow 100’. The value <strong>of</strong> 100’ was based on previous experience with model instabilities, and adesire to minimize the additional system volume introduced when elongating culverts.4.2.4 Storage FacilitiesThe EXTRAN model allows the user to input a variable stage-area relationship at selectedjunctions. These relationships are used to represent the flood storage associated with lakes,wetlands, retention / detention facilities, and even out <strong>of</strong> bank storage. This storage is important inthe <strong>Hillsborough</strong> River <strong>Water</strong>shed because many areas contain significant on / <strong>of</strong>f-line wetlandsthat detain run<strong>of</strong>f in the early stages <strong>of</strong> storm events and also provide storage during out <strong>of</strong> bankconditions experienced during high flow.The SWFWMD topographic aerials were used to obtain stage-area values. For practical reasons,only the storage associated with the detailed hydraulically modeled portions <strong>of</strong> the system wereincluded in the model. Storage in areas that were far removed from the modeled system washandled by adjustments to the hydrologic parameters during the calibration / verification process,as discussed in Chapter 5.4.2.5 WeirsControl structures, roadway overtoppings, and overland flow basin transfers were simulated withbroad crested weirs. Weir overflow elevations were obtained from field surveys, previous studies,construction plans, and SWFWMD topographic aerials. Weir widths were also scaled from theSWFWMD topographic aerials. The initial values for basin transfers and roadway overtoppings4-21 <strong>Hillsborough</strong> River <strong>Water</strong>shed Management Plan
HYDROLOGIC/HYDRAULIC MODEL METHODOLOGYwere adjusted during calibration and verification to provide more realistic results. Questionableresults at roadway crossings were compared to values calculated by the Federal HighwayAdministration Culvert Analysis Program (HY-8).4.2.6 OrificesThe use <strong>of</strong> orifices to model flow conditions in a master planning level study is generally notpractical. The normally small amounts <strong>of</strong> flow conveyed through the orifices in control structuresare not significant enough to affect the peak stages and discharges predicted for the design stormevents.The tainter gates located in the Lower <strong>Hillsborough</strong> Flood Detention Area and in the <strong>Tampa</strong>Bypass Canal are the only exception in this study. These structures are wide and are able tosignificantly affect the flow characteristics <strong>of</strong> the surrounding area. Since the operation <strong>of</strong> thegates is variable, modeling <strong>of</strong> these structures was accomplished through the use <strong>of</strong> time-variableorifices. Sections 5.3.4 and 5.3.5 provide a more detailed description <strong>of</strong> the application <strong>of</strong> theseorifices.4.2.7 Initial <strong>Water</strong> Surface ElevationsThe initial water surface elevations were estimated by evaluating the invert elevations <strong>of</strong> thechannel bottom and conduit inverts. For design storm simulations, it was assumed that the startingwater surface elevation was equal to the highest invert <strong>of</strong> the channels / conduits / controlstructures downstream <strong>of</strong> the junction. This procedure provided static water surface elevationswithin the hydraulic system that provided zero flow at the beginning <strong>of</strong> the design storm simulation,and allowed for discharge immediately upon introduction from the run<strong>of</strong>f hydrographs. Chapter 5describes the variations in this approach, which were utilized for calibration and verification events.4.2.8 Dummy Junctions and ConduitsDummy junctions and conduits are used in EXTRAN for several reasons. One is to eliminatewarnings within the EXTRAN output for a conduit whose invert is perched above the junctioninvert. A second reason is for a conduit whose crown is lower than the connecting conduit invert.Additional reasons for using dummy junctions and conduits include providing a means to introduceflow from an <strong>of</strong>fline basin whose hydraulic connection is not being modeled in detail, and to allowfor only one conduit to connect to an outfall junction. Dummy junctions and conduits are noted assuch within the EXTRAN input data files through the use <strong>of</strong> comment lines.4.2.9 Boundary ConditionsAppropriate boundary conditions are required in order to provide adequate results from thehydraulic simulations <strong>of</strong> the <strong>Hillsborough</strong> River <strong>Water</strong>shed. Considering the limits <strong>of</strong> the detailedstudy <strong>of</strong> the county boundaries, and exclusion <strong>of</strong> the Cypress Creek and Lake Thonotosassa / FlintCreek <strong>Water</strong>sheds, it was necessary to develop adequate inflow hydrographs for the detailedhydraulic model.4-22 <strong>Hillsborough</strong> River <strong>Water</strong>shed Management Plan
CHAPTER 4The areas outside <strong>of</strong> <strong>Hillsborough</strong> <strong>County</strong>, above Crystal Springs, and within Blackwater Creek,were calibrated to historical gage information as described in Chapter 5. The Withlacoochee Riveralso contributes flow to the Crystal Springs area, as described in Chapter 3. The amount <strong>of</strong> flowcontributed to the <strong>Hillsborough</strong> River is highly dependent on the hydrologic conditions <strong>of</strong> the GreenSwamp area and the hydraulic conditions <strong>of</strong> the Withlacoochee River.To determine the inflows to the <strong>Hillsborough</strong> River from the Withlacoochee River, the U.S.Geological Survey (USGS) program peakfq (Version 2.4, Apr 1998), following Bulletin 17-Bguidelines, was executed on the gage records from the Withlacoochee-<strong>Hillsborough</strong> River overflowgage near Richland. This program provides peak discharge estimates for specific exceedanceprobabilities (return periods), based upon the entire period <strong>of</strong> record for a gage. Triangular inflowhydrographs were generated from the results <strong>of</strong> this program. Care was taken to ensure aconservative result by making the peak flow rate coincide with the time <strong>of</strong> peak run<strong>of</strong>f from theneighboring basin.Cypress Creek and the Lake Thonotosassa / Flint Creek <strong>Water</strong>sheds were separate master plansprepared for/by <strong>Hillsborough</strong> <strong>County</strong>. Their respective master plan models were utilized togenerate inflow hydrographs to the <strong>Hillsborough</strong> River model at their corresponding junctionlocations.Additional boundary conditions were the selection <strong>of</strong> tailwater elevations for the respectivesubwatershed models. For each <strong>of</strong> the subwatershed models, which simulated tributaries to the<strong>Hillsborough</strong> River, or Blackwater Creek, the respective FEMA FIS reports were consulted andtriangular stage boundary conditions were applied by placing the predicted peak water surfaceelevation at the time <strong>of</strong> peak flow rate at the outfall. For the tributaries to the <strong>Tampa</strong> BypassCanal, the tailwater was selected as a constant water surface set to the design high waterelevation reported in the Regulation Manual for Lower <strong>Hillsborough</strong> Flood Detention Area and<strong>Tampa</strong> Bypass Canal. Tailwater elevations at the downstream extents <strong>of</strong> the <strong>Hillsborough</strong> Rivermodel were set to 22.5 feet NGVD, which corresponds to the maintained water surface elevation atthe <strong>Tampa</strong> Dam.4.2.10 Numeric InstabilityIn EXTRAN, the solution to the unsteady flow equations can be solved with an implicit or explicitnumerical technique. These techniques inherently introduce numerical instabilities and eliminatingthem <strong>of</strong>ten requires the user to adjust the models’ input parameters.Adjustments can include varying the simulation time step, “stretching” conduits, modifying storagerelationships, adjusting conduit slopes, changing weir lengths, and adjusting starting water surfaceelevations. Ayres Associates staff applied these techniques to achieve model stability.4.2.11 Link-Node DiagramThe hydraulic model <strong>of</strong> the <strong>Hillsborough</strong> River <strong>Water</strong>shed consists <strong>of</strong> the primary conveyancesystems within the watershed. This includes lakes, wetlands, natural channels, pipes, bridges, andcontrol structures. The EXTRAN model uses a link-node (conduit-junction) approach to simulate4-23 <strong>Hillsborough</strong> River <strong>Water</strong>shed Management Plan
HYDROLOGIC/HYDRAULIC MODEL METHODOLOGYthe hydraulics <strong>of</strong> the network. Junctions, or nodes, represent discrete locations whereconservation <strong>of</strong> mass is maintained. Conduits, or links, represent the connections between thosejunctions. Thus, the model performs the required flow calculations for these connections tobalance the water surface elevation within specific tolerances between junctions for each timestep.Each junction and conduit was assigned a unique identifier as specified by the <strong>Hillsborough</strong> <strong>County</strong>Stormwater Management Master Plan Hydrologic and Hydraulic Model Set-up Standard,(<strong>Hillsborough</strong> <strong>County</strong> Stormwater Management Section, Engineering Division, Public WorksDepartment, February 1999). Link-Node Diagrams for each individual subwatershed can be foundin Appendix A.4-24 <strong>Hillsborough</strong> River <strong>Water</strong>shed Management Plan
CHAPTER 5HYDROLOGIC/HYDRAULIC MODELCALIBRATION AND VERIFICATIONCalibration justifies the stormwater model. Using one calibration and two verification events, the<strong>Hillsborough</strong> River Stormwater Management Model (SWMM) model was successfully calibrated toemulate observed run<strong>of</strong>f responses. Rainfall depths and distributions were obtained from over 43rain gages located in and around the watershed for calibration. These depths and distributionswere then allocated to individual subbasins using the Thiessen Polygon method. Calibration wasperformed to match computed stage, discharge, and run<strong>of</strong>f volume at 14 stream gage locations.Calibration began with subwatersheds contributing to upstream gages. Subwatersheds contributingto successively downstream gages were then added and calibrated. Calibration was primarilyaccomplished by adjusting the hydrograph shape factor and run<strong>of</strong>f curve number. Parametersrelated to channel roughness and starting water surface elevations were also adjusted to completecalibration. Table 5.1.1 summarizes <strong>Hillsborough</strong> <strong>County</strong> calibration and verification criteria. Basedon the <strong>County</strong> criteria, the <strong>Hillsborough</strong> River SWMM model is considered calibrated.Table 5.1.1 <strong>Hillsborough</strong> <strong>County</strong> Calibration CriteriaEventTolerance From ObservedSimulation Stage Flow <strong>Volume</strong>Calibration ≤ 0.5 ft 5% < X < 10% < 10 %Verification ≤ 1.0 ft 10% < X < 15% < 15 %5.1 Existing Conditions Data CollectionModel validity depended on the availability and quality <strong>of</strong> appropriate input and calibration data.5.1.1 SelectionCalibration and verification storm events were carefully selected for flood magnitude, AntecedentMoisture Condition (AMC), data availability and areal rainfall data coverage. Hourly and daily flowand stage records were obtained from U.S. Geological Survey (USGS) and Southwest Florida<strong>Water</strong> Management District (SWFWMD). Fifteen-minute, hourly and daily rainfall records wereobtained from SWFWMD and the National Oceanic and Atmospheric Administration (NOAA).Calibration to large magnitude storms was desired since the design storm events used fordetermining level <strong>of</strong> service and the flood plain are 25-year and 100-year events, respectively.Therefore, by sorting daily records for flows <strong>of</strong> large magnitude, potential events were initiallyidentified. For the initially identified storms, daily rainfall records were then examined for correlationbetween rainfall and run<strong>of</strong>f magnitude and uniformity <strong>of</strong> areal rainfall distribution and AMC. Table5.1.2 summarizes initially selected storm characteristics.5-1 <strong>Hillsborough</strong> River <strong>Water</strong>shed Management Plan
HYDROLOGIC/HYDRAULIC MODEL CALIBRATION AND VERIFICATIONTable 5.1.2 Storms Potentially Suitable for Calibration and VerificationRainfallStream Gage:Rainfall DescriptionAntecedent MoistureEventPeak Flow, Est. FrequencyConditionSeptember<strong>Hillsborough</strong> River:6 day durationVery wet season. 7 to5-10, 19884,870 cfs, 10 year18 inches rain betweenBlackwater Creek :Total depth varies from8/1/88 to 9/4/88.2,870 cfs, 25 year7 to 13 inches.September<strong>Hillsborough</strong> River:5 day durationAbove average23-28, 19974,150 cfs, 5 - 10 yearseasonal wetnessBlackwater Creek:Total depth varies fromNo significant rain2,560 cfs, 10 - 25 year4 to 16 inches.previous 5 daysDecember<strong>Hillsborough</strong> River:Two larger storms 3 toVery wet season9-30, 19976,900 cfs, 25 year6 day long in 21 days.Blackwater Creek:Total depth varies from1 to 3.5 inches rain in2,580 cfs, 10 - 25 year8 to 18 inches.previous 5 daysMarch<strong>Hillsborough</strong> River:3 day durationVery wet season18-20, 19983,520 cfs, 5 yearBlackwater Creek:Total depth varies fromNo significant rain1,600 cfs, 5 year4 to 6 inches.previous 5 daysSeptember 1988 and March 1998 were not selected for general model calibration or verificationdue to less than adequate data availability and exclusion from other model studies (Cypress Creekand Lake Thonotosassa / Flint Creek Basin Master Plans). However, September 1988 was usedfor hydrologic calibration <strong>of</strong> the Crystal Springs Region. September 1997 was selected forcalibration because <strong>of</strong> data availability, inclusion in other model studies and because its rainfalldepth, distribution, and AMC most closely resemble that <strong>of</strong> standard design storms. December1997 contained two larger storms and was selected for verification not only for having two separatelarger events, but also to provide a long-term simulation to gage the models response toconsecutive storms.5.1.2 Antecedent Moisture Condition (AMC)AMC refers to the existing wetness <strong>of</strong> the basin prior to an event. Since AMC impacts basinstorage, soil storage potential, and run<strong>of</strong>f response, it is an important consideration. AMC isgenerally classified on a scale <strong>of</strong> 1 to 3, which are summarized by Table 5.1.3. Design stormevents generally assume AMC-2.5-2 <strong>Hillsborough</strong> River <strong>Water</strong>shed Management Plan
CHAPTER 5Table 5.1.3 Antecedent Moisture ConditionsAMC ClassDescription5-Day Antecedent Rainfall CriteriaDormant Season Growing SeasonAMC-1 Low run<strong>of</strong>f potential. Dry soils. Less than 0.5" Less than 1.4"AMC-2 Average run<strong>of</strong>f and soil moisture. 0.5" to 1.1" 1.4" to 2.1"AMC-3 High run<strong>of</strong>f potential. Saturated soils. Greater than 1.1" Greater than 2.1"Much <strong>of</strong> the <strong>Hillsborough</strong> River Basin is characterized by relatively flat topography and high groundwater table. Consequently, rainfall depths less than those presented by Table 5.1.3 may result inrun<strong>of</strong>f response similar to a higher AMC. The September 1997 calibration event was classified asAMC-1, while the December 1997 verification events were classified as AMC-3.Run<strong>of</strong>f Curve Numbers (CN) require adjustment for AMC's other than normal AMC-2. Theseadjustments are typically made using lookup tables such as Table 5.1.4. In practice, intermediateCN and AMC values are interpolated.Table 5.1.4 AMC Curve Number Lookup TableAMC-2 AMC-1 AMC-3 AMC-2 AMC-1 AMC-30 0 0 60 40 785 2 13 62 42 7910 4 22 64 44 8115 6 30 66 46 8220 9 37 68 48 8425 12 43 70 51 8530 15 50 72 53 8632 16 52 74 55 8834 18 54 76 58 8936 19 56 78 60 9038 21 58 80 63 9140 22 60 82 66 9242 24 62 84 68 9344 25 64 86 72 9446 27 66 88 75 9548 29 68 90 78 9650 31 70 92 81 9752 32 71 94 85 9854 34 73 96 89 9956 36 75 98 94 9958 38 76 100 100 100(1985) SCS National Engineering Handbook, Section 4: Hydrology5-3 <strong>Hillsborough</strong> River <strong>Water</strong>shed Management Plan
HYDROLOGIC/HYDRAULIC MODEL CALIBRATION AND VERIFICATION5.1.3 Precipitation DataSuccessful model calibration begins with accurate assignment <strong>of</strong> rainfall depth over time to theindividual subbasins. Precipitation data from the 43 rainfall gage stations plotted in Figure 5.1.1was available for this analysis. For the selected calibration events, gage coverage within thewatershed was generally good, although coverage for portions <strong>of</strong> the Blackwater Creeksubwatershed was marginal.Before assigning rainfall to the subbasins, the available rainfall data was thoroughly reviewed forreliability and consistency. Gage records with data missing at times other than that <strong>of</strong> principalrainfall were repaired by assuming the same precipitation depths reported at the nearest workinggage. This allowed use <strong>of</strong> the most site-specific information without reliance on questionable data.Several gage records were simply deemed too unreliable or incomplete for use.Calibration rainfall depths were obtained by summing the measured rainfalls at selected fifteenminute,hourly, and daily rain gages. Areal assignment <strong>of</strong> rainfall depth from the gages to theindividual subbasins was accomplished using the Thiessen Polygon method. Connecting lineswere drawn between adjacent rain gage stations on a map. Perpendicular bisectors were thendrawn to form polygons around each gage. Subbasins mostly within a rain gage polygon wereassigned the rainfall depth from that gage. Figures 5.1.2 and 5.1.3 present the Thiessen Polygonsubbasin maps for depth from the September and December 1997 calibration events.Calibration rainfall distributions were obtained from fifteen-minute and hourly rain gages.Incremental rainfall depths were then accumulated on an hourly basis to develop cumulativerainfall distributions. Finally, these distributions were divided by total rainfall depth to createdimensionless distributions for model input.The Thiessen Polygon method was also used to assign rainfall distributions to the individualsubbasins. Figures 5.1.4 and 5.1.5 present the Thiessen rainfall distribution polygons for theSeptember and December 1997 calibration events.5.1.4 Surface <strong>Water</strong> DataSurface water data used in this analysis included records from 14 stream gage sites and gateoperation logs from flow control structures. Gage and control structure locations are plotted inFigure 5.1.6.Stream gage records were used to benchmark model calibration and to define the boundarycondition between the <strong>Hillsborough</strong> and Withlacoochee River basins. Available data includedcontinuous and peak condition measurements <strong>of</strong> stage and flow. Model calibration was mostlybased on fifteen-minute data from continuous gage stations. Daily and peak data was alsoconsulted in lieu <strong>of</strong> unavailable fifteen-minute data. Flow and stage hydrographs were created fromtext files containing gage data.5-4 <strong>Hillsborough</strong> River <strong>Water</strong>shed Management Plan
CHAPTER 5Operation logs from various control structures located on the lower <strong>Hillsborough</strong> River and <strong>Tampa</strong>Bypass Canal were another required surface water data. Tainter gates at these structures controlwater levels. Operation logs provide a record <strong>of</strong> adjustments made in the gate openings. Thegates are simulated as time variable orifice openings in the stormwater model. <strong>Water</strong> levels weremonitored at many <strong>of</strong> the structures, thus providing additional verification <strong>of</strong> gate operations.Direct run<strong>of</strong>f and groundwater base flows are components <strong>of</strong> the stream gage hydrograph. Forstormwater model input and comparison <strong>of</strong> measured and computed calibration hydrographs, itwas necessary to separate and quantify the base flow component. Referring to Figure 5.1.7, thiswas accomplished by first identifying the time <strong>of</strong> initial run<strong>of</strong>f. Second, the time <strong>of</strong> rise (T r ) wasdetermined as the time difference between the time <strong>of</strong> peak (T p ), and time <strong>of</strong> initial response. Third,a second point, occurring four times the time <strong>of</strong> rise after the time <strong>of</strong> initial run<strong>of</strong>f response, wasidentified on the hydrograph. Finally, a straight line was drawn between the two points on thehydrograph. Base flow volume was estimated as the hydrograph volume under the straight line.Once quantified the base flow component was removed from the gaged flow records for all volumecomparisons for the calibration or verification event.5.2 Calibration Parameters and MethodologyThe <strong>Hillsborough</strong> <strong>County</strong> Storm <strong>Water</strong> Management Model (HCSWMM) included hydrologic(RUNOFF) and hydraulic (EXTRAN) computational blocks. The overall HCSWMM model wasmethodically assembled from individual subwatershed models calibrated to emulate real floodevents.5.2.1 Hydrologic ParametersHCSWMM’s HEC-1 routine transforms rainfall into run<strong>of</strong>f and may be used for simple flow routing.In general, HCSWMM was calibrated to match stormwater volume, peak flow rate and flowhydrograph shape. Calibration parameters within the hydrologic portion <strong>of</strong> HCSWMM include:• Time <strong>of</strong> Concentration (TOC): Effects start time <strong>of</strong> run<strong>of</strong>f response and hydrograph shape.Accounts for the travel time <strong>of</strong> unconcentrated flow.• Run<strong>of</strong>f Curve Number, CN: Effects total run<strong>of</strong>f volume. Accounts for soil, land use, andAntecedent Moisture Condition characteristics.• Unit Hydrograph Peaking (Shape) Factor, P f : Effects hydrograph shape. Accounts for basinattenuation.• Initial Abstraction, I a : Effects initial run<strong>of</strong>f response and total run<strong>of</strong>f volume. In the <strong>Hillsborough</strong><strong>County</strong> SWMM, I a is not adjustable. Accounts for interception storage, evaporation, andevapotranspiration processes that reduce rainfall available for transform into run<strong>of</strong>f.5-5 <strong>Hillsborough</strong> River <strong>Water</strong>shed Management Plan
HYDROLOGIC/HYDRAULIC MODEL CALIBRATION AND VERIFICATION5.2.2 Hydraulic ParametersThe HCSWMM EXTRAN Block performs complex flow routing through channels, culverts, andreservoirs. Like the hydrologic portion, EXTRAN was calibrated to match peak flow rate, run<strong>of</strong>fvolume (at a particular location), and flow hydrograph shape. In addition, EXTRAN was calibratedto match observed stages. Calibration parameters within the EXTRAN Block include:• Manning Friction Coefficient, n: Effects flow rate and stage. Accounts for roughness,irregularities, and obstructions within the conveyance system.• Starting <strong>Water</strong> Surface Elevation: Effects stage and run<strong>of</strong>f volume. Accounts for surfacestorage not included in the fixed initial abstraction parameter described above. Examples <strong>of</strong>this surface storage are those wetlands, lakes, and ponds that have capacity to accept run<strong>of</strong>fprior to discharging into the main conveyance system.5.2.3 Calibration MethodThe <strong>Hillsborough</strong> River SWMM model was systematically assembled and calibrated according to<strong>County</strong> calibration criteria (See Table 5.1.1). Calibration was performed according to the followingsimplified procedure:1. Calibrate headwater subwatersheds to upstream gages.2. Determine global calibration parameter adjustments and apply to all subwatersheds.3. In downstream direction, calibrate additional subwatersheds contributing to next stream gage.Adjustments should be relatively minor and physically justifiable. If not, revise global calibrationparameter adjustments.4. Following calibration to downstream gage, verify calibration to upstream gages. If newcalibration unacceptably affects upstream gage calibration, revise global calibration parameteradjustments. Otherwise, repeat steps until entire watershed is calibrated.Make GlobalAdjustmentsnonoPerformHeadwaterCalibrationSimulationsMeetCalibrationCriteriayesApply tonextdownstreamsubwatershedPerformCalibrationSimulationsMeetCalibrationCriteriayesAnyRemainingSub-<strong>Water</strong>shedsnoCalibrationCompleteyesExample <strong>of</strong> Calibration Procedure5-6 <strong>Hillsborough</strong> River <strong>Water</strong>shed Management Plan
CHAPTER 5In order to save computation time, this process was performed upon the individual watershedmodels. The resulting outflow hydrographs were then saved and utilized as user inputhydrographs for subsequent downstream models. Following the calibration procedure and thecompletion <strong>of</strong> the existing conditions modeling, two combined models were prepared. Onecontaining the <strong>Hillsborough</strong> River and its tributaries upstream <strong>of</strong> control structure S-155 and theother containing the <strong>Tampa</strong> Bypass Canal and its tributaries. The historical storms were then runon these combined models to verify the predictive capabilities <strong>of</strong> the combined model. The figurescontained within this Chapter include the results <strong>of</strong> both the individual watershed model calibrationand the combined model calibration. The data reported in those figures is from the combinedmodel output.5.3 Existing Conditions Model Calibration5.3.1 Headwater Basin CalibrationFigure 5.3.1 depicts the areas for which Steps 1 and 2 <strong>of</strong> the calibration method were completed.Stabilized models for Blackwater Creek (including East Canal, Tiger Creek and ItchepackesassaCreek) and Trout Creek were prepared. These models were then run for the September 23 rd -28 th ,1997 historical storm event. The predicted results at their respective gage locations were plottedversus the historical gage records and compared. Results depicted high volumes and peak flowrates.Starting water surface elevations for the detailed hydraulic storage areas were adjusted for theAMC I design event as a first option to attaining the appropriate volume <strong>of</strong> discharge. Afterlowering those elevations to their minimum value, there remained a significant discrepancy in thedischarge volume, as well as in the peak flow rate, requiring additional adjustments.Considering that the detailed hydraulic modeling only includes the main channel <strong>of</strong> eachsubwatershed, numerous subbasins <strong>of</strong> these subwatersheds contain significant amounts <strong>of</strong>isolated / cascading wetlands that can hold substantial volumes <strong>of</strong> water and provide attenuation tothe peak flow rates. For these reasons, a procedure was established to adjust the computedRUNOFF parameters to better simulate the effect <strong>of</strong> these areas.A listing was compiled <strong>of</strong> all the subwatersheds delineated for the <strong>Hillsborough</strong> River <strong>Water</strong>shedfor the purposes <strong>of</strong> determining where to make the needed adjustments. This list was divided intobasins that had storage associated with them in the hydraulic (EXTRAN) model and those without.Additional adjustments to this list were made by the selection <strong>of</strong> those basins without storage,which were less than 200 acres in area. Basins <strong>of</strong> this size had been investigated to the pointwhere if additional storage had existed, it would have been included in the hydraulic model.Conversely, those basins with hydraulic storage, greater than 640 acres (one square mile) in areahad not been detailed enough to have sufficient storage to account for the isolated / cascadingwetlands. This procedure resulted in a list <strong>of</strong> basins for which global modifications to hydrologicparameters would be made.5-7 <strong>Hillsborough</strong> River <strong>Water</strong>shed Management Plan
HYDROLOGIC/HYDRAULIC MODEL CALIBRATION AND VERIFICATIONOver 60% <strong>of</strong> the area <strong>of</strong> basins to be modified lies outside <strong>of</strong> <strong>Hillsborough</strong> <strong>County</strong>. An additional25-30% is contained within the Two Rivers Ranch property, where survey access was denied, orwithin large flat wetland areas like <strong>Hillsborough</strong> River State Park and the Lower <strong>Hillsborough</strong> FloodDetention Area. The remaining areas are within the incorporated cities <strong>of</strong> <strong>Tampa</strong> and TempleTerrace, which, while not containing the isolated / cascading wetland systems, do have stormwatercontrol systems that function in a similar manner.Revisiting the historical gage information, it was determined that a 25% reduction in the curvenumber for the aforementioned basins, within both Blackwater Creek and Trout Creek wouldsuffice in bringing the volume <strong>of</strong> discharge within acceptable limits. Review <strong>of</strong> the resultingcomparisons still showed a significant over-prediction in peak flow rates.Shape factor and TOC were both considered for attaining the desired flow rate. It is known that thelarger a watershed area, the more error that is introduced into the computation <strong>of</strong> a TOC basedupon the SCS methodology, more specifically the channel flow time calculation. Additionally, theapplication <strong>of</strong> a shape factor <strong>of</strong> 256 for all watersheds has been disputed in numerous publications.The publication Advances in Modeling the Management <strong>of</strong> Stormwater Impacts (copyright 1996,published by Computational Hydraulics International, Guelph, Ontario, Canada, and edited byWilliam James <strong>of</strong> the University <strong>of</strong> Guelph) containing the proceedings <strong>of</strong> the Stormwater and<strong>Water</strong> Quality Management Modeling Conference (Toronto, Canada, March 2-3, 1995), wasconsulted. In Chapter Four <strong>of</strong> this publication, a procedure was developed for estimating the peakrate factor for watersheds in Southwest Florida. Equation 4.9 was utilized to adjust the peak ratefactors for the basins to be modified.Application <strong>of</strong> the equation is as follows:PRF=60(Imp 0.28 /A 0.15 ) where: A = <strong>Water</strong>shed area in square milesImp = Imperviousness <strong>of</strong> the watershedPRF = Peak Rate (shape) FactorThis equation adjusts the shape factor based upon area and percent imperviousness. Accepting ashape factor <strong>of</strong> 256 for the subwatersheds that were detailed in hydraulic description, andassuming the average percent impervious <strong>of</strong> the subwatersheds delineated with detailed storage isequal to that for the subwatersheds without, results in the following equation.PRF a =256(A i /A o ) 0.15 where: PRF a = Adjusted peak rate (shape) factorA I = Average area detailed basinsA o = Average area non-detailed basins5-8 <strong>Hillsborough</strong> River <strong>Water</strong>shed Management Plan
CHAPTER 5Detailed basins averaged approximately 117 acres in size while non-detailed basins averagedapproximately 1500 acres in size. Substituting these values into the above equation resulted in theselection <strong>of</strong> a shape factor <strong>of</strong> 175 for those non-detailed basins.Following additional comparisons <strong>of</strong> the resulting predicted hydrographs with the historical data,TOC values for those non-detailed basins were modified until the model matched the historicalinformation. The stage and flow plots for Blackwater and Trout Creeks for the September 23 rd -28 th ,1997 historical storm event are depicted in Figures 5.3.2 through 5.3.5.For verification, a model for the December 9 th -30 th , 1997 historical event containing two largestorms was prepared. RUNOFF curve numbers and starting water surface elevations wereadjusted to reflect the AMC III conditions. The stage and flow results <strong>of</strong> these simulations arepresented in Figures 5.3.6 through 5.3.9 for the Blackwater Creek and Trout Creek subwatersheds.It is interesting to note that the response, in Blackwater Creek, to the second storm in December,1997 indicates a more severe response than the actual. This phenomenon is most likely attributedto the fact that no rain gages were located within the large Blackwater Creek watershed and thatthere was a substantial variability in the rainfall across the watershed, from 9.35” to 16.7”,according to the gage data reviewed for the month <strong>of</strong> December. Deviations in the actual rainfallpatterns <strong>of</strong> one to two inches from the applied rainfall taken from the Thiessen Polygon methodcould easily cause this discrepancy.The following is a summary <strong>of</strong> the model calibration modifications to the hydrologic parameters.These modifications were applied to all calibration, verification, and subsequent design stormsimulations.Table 5.3.1 Global Adjustments to Non-Detailed <strong>Water</strong>shedsParameterAdjustmentCN25% ReductionShape Factor Modify to 175TOC50% IncreaseThese modifications were then applied to the <strong>Hillsborough</strong> River above Crystal Springs.Calibration at this location was hindered by several factors. First, the area is entirely outside<strong>Hillsborough</strong> <strong>County</strong> and encompasses approximately 110 square miles. Secondly, gageinformation is limited in its availability. Only one rainfall recorder was sufficiently close for rainfalldistribution determinations and only one daily total rainfall gage exists within the drainage basin.Thirdly, the stage recorder being utilized has been inoperable for significant periods <strong>of</strong> time. Datasupplied was described to be in the form <strong>of</strong> observer records and are suspect during the December1997 events. Fourth, the overflow from the Withlacoochee River into the <strong>Hillsborough</strong> River ishighly variable, and dependent upon the hydrologic conditions <strong>of</strong> the Withlacoochee River drainagebasin.5-9 <strong>Hillsborough</strong> River <strong>Water</strong>shed Management Plan
HYDROLOGIC/HYDRAULIC MODEL CALIBRATION AND VERIFICATIONComparisons <strong>of</strong> the predicted values with historical values at the Crystal Springs gage was limitedto the September 1997 storm for the aforementioned calibration events, and supplemented withthe September 1988 event. The results <strong>of</strong> these simulations are contained in Figures 5.3.10 and5.3.11, respectively. Following review <strong>of</strong> the results the headwater basins were deemedcalibrated.5.3.2 State Park Gage CalibrationThe U.S. Geological Survey (USGS) maintains the first gage on the <strong>Hillsborough</strong> River,downstream from the Crystal Springs gage. This gage is located at <strong>Hillsborough</strong> State Park.Figure 5.3.12 depicts the subwatershed areas that contribute flow to this location. The globalmodifications described in Table 5.3.1 above were applied to these areas and their respectivemodels combined to generate predicted stage and flow data at the State Park gage location.Considering the proximity <strong>of</strong> this gage location to the headwater gage locations, and the minoramount <strong>of</strong> additional contributing area, no modifications to the model parameters was necessary.The simulation results for stage and flow during the calibration and verification events are shown inFigures 5.3.13 through 5.3.16.5.3.3 Morris Bridge Gage CalibrationThe next downstream gage from the <strong>Hillsborough</strong> State Park is located at Morris Bridge Road andis also maintained by USGS. Figure 5.3.17 depicts the contributing flow areas to this gagelocation. As before, the global modifications were applied to these areas and their respectivemodels combined to generate predictive capabilities at this location.Initial simulations resulted in significant discrepancies between the predicted and measuredresults. Review <strong>of</strong> the input data showed a substantial difference between the cross-sectionssupplied by the Federal Emergency Management Agency (FEMA) Flood Insurance Study, and thecross-sections utilized by USGS for their rating curve determinations. As the FEMA cross-sectionswere approximately 20 years old and the USGS data was less than two years old, the USGScross-sections were substituted into the model and simulations rerun. The results <strong>of</strong> thesesimulations provided an acceptable match for stage, but still depicted unacceptable differences inflow and volume. Further review <strong>of</strong> the rating curve data showed a lower peak flow rate andvolume at this gage location than at the upstream gage location (<strong>Hillsborough</strong> River State Park).This implied that this volume difference, added to the additional run<strong>of</strong>f volume from the contributingarea between the respective gages, would need to be retained and not allowed to pass through thedownstream gage. This total volume would account for approximately 1 foot <strong>of</strong> water over theentire additional contributing area. This amount was deemed unreasonable and the rating curvetransformation for flow at the Morris Bridge Road gage was removed from further consideration.Figures 5.3.18 and 5.3.19 show the results <strong>of</strong> the calibration and verification storm events for theMorris Bridge gage.5-10 <strong>Hillsborough</strong> River <strong>Water</strong>shed Management Plan
CHAPTER 55.3.4 S-155 Gage CalibrationThe next downstream gage is located at ControlStructure S-155 in the Lower <strong>Hillsborough</strong> FloodDetention Area (LHFDA) and is maintained by theSouthwest Florida <strong>Water</strong> Management District(SWFWMD). S-155 is a reinforced concrete, U-shaped,gated, two-bay (30-foot bay width) spillway with anogee weir (crest elevation 15.2). Reported gageinformation is in the form <strong>of</strong> average daily stage. Thegates are simulated as time variable orifice openings inthe stormwater model. Operation logs provide a recordControl Structure S-155<strong>of</strong> adjustments made in the gate openings. Additionally, upstream from S-155, both Cow HouseCreek and the floodway convey water from the LHFDA to the <strong>Tampa</strong> Bypass Canal. Gage recordsat Control Structure S-163, also maintained by SWFWMD, were utilized as tailwater elevations forthe downstream end <strong>of</strong> the floodway and Cow House Creek.The Regulation Manual for Lower <strong>Hillsborough</strong> Flood Detention Area and <strong>Tampa</strong> Bypass Canalwas consulted for expected discharges at S-155 for specific gate openings. Initial simulations <strong>of</strong>the time variable orifices resulted in discrepancies between the expected and computed results fordischarge, when using a constant orifice coefficient. The expected discharges and gate openingswere plotted and compared to the orifice equation. A power function was curve fit to the requiredorifice coefficients to allow for computations <strong>of</strong> the model input values for each gate opening. Thisprocedure was then utilized for all subsequent gate-opening calculations.Figure 5.3.20 depicts the contributing flow areas to the S-155 gage location. As before, the globalmodifications were applied to these areas and their respective models combined to generatepredictive capabilities at this location. Figures 5.3.21 and 5.3.22 present the final results <strong>of</strong>calibration and verification for the S-155 gage (note the existence <strong>of</strong> a gap in the recorded dataduring the first December event).5.3.5 Fowler Avenue Gage CalibrationThe last gage used for calibration on the <strong>Hillsborough</strong> River is located at Fowler Avenue and ismaintained by USGS. Tailwater elevations were taken from the gage located at the <strong>Tampa</strong> Damand at Control Structure S-161 on the Harney Canal. Figure 5.3.23 depicts the contributing flowareas to this gage location. As before, the global modifications were applied to these areas andtheir respective models combined to generate predictive capabilities at this location.Initial simulations resulted in significant discrepancies between the predicted and measuredresults. Review <strong>of</strong> the operation logs for S-155 and the reported gage heights depicted periodswhere substantial changes occurred in the reported gage heights, but no gate operations were5-11 <strong>Hillsborough</strong> River <strong>Water</strong>shed Management Plan
HYDROLOGIC/HYDRAULIC MODEL CALIBRATION AND VERIFICATIONrecorded. Additionally, descriptions <strong>of</strong> numerous gate openings presented the possibilities <strong>of</strong>unrecorded operations when subsequent descriptions were compared.Sufficient detail was not available to determine exact operations for the missing data. The resultsfrom the September 1997 storm, presented in Figure 5.3.24, were determined to be acceptable forthe purposes <strong>of</strong> calibration, and no additions were made to the operation logs. The December 9 th -30 th , 1997 storms, however, presented more difficulty. Two periods, <strong>of</strong> approximately six dayseach, were noted in the operation logs as having no gate operations. The gage heights at theFowler Avenue gage showed multiple gate operations during that period. Two distinct times wereidentified for each period <strong>of</strong> missing data, and an assumption was made as to the adjusted gateopening, based upon the reported gage heights and the previous gate operations. The results <strong>of</strong>this simulation are presented in Figure 5.3.25. Due to the unreliable operations information, thecombined modeling results were not reproduced for this gage.The Level <strong>of</strong> Service determinations for this area are based upon high water elevations at the<strong>Tampa</strong> Dam and gate operations from the Regulation Manual for the Lower <strong>Hillsborough</strong> FloodDetention Area and <strong>Tampa</strong> Bypass Canal. Determinations <strong>of</strong> the specific details <strong>of</strong> the missinggate operations are impractical. For these reasons, the results <strong>of</strong> this simulation were acceptedand the <strong>Hillsborough</strong> River model deemed calibrated and verified for the purpose <strong>of</strong> design stormsimulations.5.3.6 <strong>Tampa</strong> Bypass Canal CalibrationThe <strong>Tampa</strong> Bypass Canal is controlled by numerous structures, and operated and maintained bythe Southwest Florida <strong>Water</strong> Management District (SWFWMD). These structures are S-163,S-159 (upper, middle, and lower), S-162, S-161, and S-160.• Structure S-163 is a gated, one-barrel (84 inch diameter) CMP culvert located upstream <strong>of</strong>structure S-159 used to pass low flow down Cow House Creek through Levee 112(S).• Structure S-159 is a composite <strong>of</strong> three structures:1. S-159 upper, a gated, three-bay (29-foot baywidth) spillway with an ogee weir (crest elevation24.3)2. S-159 middle, an ungated (125-foot width) ogeespillway (crest elevation 20.4)Control Structure S-159 Upper3. S-159 lower, an ungated (125-foot width) ogee spillway (crest elevation 13.6). S-159 islocated in the <strong>Tampa</strong> Bypass Canal and is used to regulate flow from the floodway andCow House Creek down the canal5-12 <strong>Hillsborough</strong> River <strong>Water</strong>shed Management Plan
Control Structure S-160CHAPTER 5Control Structure S-161• Structure S-161 is a gated, two-bay(18-foot bay width) spillway with an ogee weir(crest elevation 11.3) located in the Harney Canal.S-161 is used to regulate the diversion <strong>of</strong> floodflows from the <strong>Hillsborough</strong> River that are inexcess <strong>of</strong> the capacity <strong>of</strong> the river channel belowthe <strong>Hillsborough</strong> River Reservoir Dam.• Structure S-162 is a gated, seven-bay (28-footbay width) spillway with an ogee weir (crestelevation 4.2). S-162 is located in the <strong>Tampa</strong>Bypass Canal, just upstream <strong>of</strong> Martin LutherKing Boulevard.Control Structure S-162Control Structure S-160• Structure S-160 is a gated, six-bay (28-footbay width) spillway with an ogee weir (crest elevation–0.7). S-160 is located in the <strong>Tampa</strong> Bypass Canalabout 1500 feet north <strong>of</strong> S.R. 60 and is used tomaintain water control and prevent saltwater intrusionin the canal.Figure 5.3.26 depicts the flow areas that contribute direct run<strong>of</strong>f to the <strong>Tampa</strong> Bypass Canal. Asbefore, the global modifications were applied to these areas and their respective models combinedto generate predictive capabilities at this location.Simulations <strong>of</strong> the calibration and verification events show fair predictions <strong>of</strong> the stage in theupstream extent <strong>of</strong> the <strong>Tampa</strong> Bypass Canal only to the point when gate operations begin.Discrepancies in the operation logs, for all structures, can be identified in the historical records forthese events.The Level <strong>of</strong> Service determinations for this area are based upon the design high water elevationsat the respective structures. Considering the close proximity <strong>of</strong> five gated structures, whoseoperations were managed with multiple adjustments during these historical events, determinations<strong>of</strong> the specific details <strong>of</strong> the missing gate operations are for all practical purposes, impossible. Theresults <strong>of</strong> the calibration and verification storm event simulations were only verified with theinformation provided by <strong>County</strong> maintenance units for flooding problem areas. With thisverification, the <strong>Tampa</strong> Bypass Canal model was deemed suitable for the purpose <strong>of</strong> design stormsimulations.5-13 <strong>Hillsborough</strong> River <strong>Water</strong>shed Management Plan
TpTr3TrFlowFlow HydrographBaseFlowTime<strong>Hillsborough</strong> River <strong>Water</strong>shed Management PlanHydrograph SeparationFigure5.1.7
818079GageIndividual ModelCombined Model7877Stage (ft)767574737271709/23 9/24 9/25 9/26 9/27 9/28 9/29 9/30 10/1 10/2 10/3Peak Stage Diff. = 0.33' (Sep 28)Date<strong>Hillsborough</strong> River <strong>Water</strong>shed Management PlanBlackwater Creek September 1997 Gage vs. Model StageFigure5.3.2
35003000GageIndividual ModelCombined Model2500Flow (cfs)20001500100050009/22 9/27 10/2 10/7 10/12 10/17 10/22 10/27Peak Flow Diff. = 7.83% (Sep 28)<strong>Volume</strong> Diff. = -0.40%Peak Stage Diff. = 0.33' (Sep 28)Date<strong>Hillsborough</strong> River <strong>Water</strong>shed Management PlanBlackwater Creek September 1997 Gage vs. Model FlowFigure5.3.3
42414039Stage (ft)38373635GageIndividual ModelCombined Model349/25 9/26 9/27 9/28 9/29 9/30Peak Stage Diff: = -0.12 ftDate<strong>Hillsborough</strong> River <strong>Water</strong>shed Management PlanSeptember 1997 Trout Creek Gage vs. Model StageFigure5.3.4
1000900800GageIndividual ModelCombined Model700600Flow (cfs)50040030020010009/25 9/26 9/27 9/28 9/29 9/30 10/1Peak Flow Diff. = +2.6%<strong>Volume</strong> Diff. = +10%Date<strong>Hillsborough</strong> River <strong>Water</strong>shed Management PlanSeptember 1997 Trout Creek Gage vs. Model FlowFigure5.3.5
8281GageSeperate ModelsCombined ModelIndividual Model807978Stage (ft)77767574737212/6 12/11 12/16 12/21 12/26 12/31 1/5Peak Stage Diff. = +0.08' (Dec 14) & +0.36' (Dec 28)Date<strong>Hillsborough</strong> River <strong>Water</strong>shed Management PlanBlackwater Creek December 1997 Gage vs. Model StageFigure5.3.6
60005000GageSeparate ModelsCombined ModelIndividual Models4000Flow (cfs)300020001000012/6 12/11 12/16 12/21 12/26 12/31 1/5Peak Flow Diff. = 3.93% (Dec 14) & 35.7% * (Dec 28)<strong>Volume</strong> Diff. = 17.3% * (Total)Date<strong>Hillsborough</strong> River <strong>Water</strong>shed Management PlanBlackwater Creek December 1997 Gage vs. Model FlowFigure5.3.7
44GageIndividual Model42Combined Model40Stage (ft)3836343212/6 12/11 12/16 12/21 12/26 12/31 1/5Peak Stage Diff. = -0.79'(Dec9) & -0.45'(Dec25)Date<strong>Hillsborough</strong> River <strong>Water</strong>shed Management PlanDecember 1997 Trout Creek Gage vs. Model StageFigure5.3.8
16001400GageIndividual ModelCombined Model12001000Flow (cfs)800600400200012/6 12/11 12/16 12/21 12/26 12/31 1/5Peak Flow Diff. = -27% (Dec13) & +10.6% (Dec25)Date<strong>Volume</strong> Difference = 8.9%<strong>Hillsborough</strong> River <strong>Water</strong>shed Management PlanDecember 1997 Trout Creek Gage vs. Model FlowFigure5.3.9
1000900GageModelWithlacoochee800700600Flow (cfs)50040030020010009/22 9/27 10/2 10/7 10/12 10/17 10/22Date<strong>Hillsborough</strong> River <strong>Water</strong>shed Management PlanSeptember 1997 Crystal Springs Gage vs. Model FlowFigure5.3.10
2500GageModel2000Withlacoochee1500Flow (cfs)100050008/30 9/4 9/9 9/14 9/19 9/24 9/29 10/4Date<strong>Hillsborough</strong> River <strong>Water</strong>shed Management PlanSeptember 1988 Crystal Springs Gage vs. Model FlowFigure5.3.11
48Gage46Individual Model44Combined Model42Stage (ft)40383634329/23 9/25 9/27 9/29 10/1 10/3 10/5Peak Stage Diff. = 0.48'Date<strong>Hillsborough</strong> River <strong>Water</strong>shed Management PlanSeptember 1997 State Park Gage vs. Model StageFigure5.3.13
500045004000GageIndividual ModelCombined Model35003000Flow (cfs)25002000150010005000-5009/23 9/25 9/27 9/29 10/1 10/3 10/5Peak Flow Diff. = -0.7%<strong>Volume</strong> Diff. = -10.2%Date<strong>Hillsborough</strong> River <strong>Water</strong>shed Management PlanSeptember 1997 State Park Gage vs. Model FlowFigure5.3.14
5149GageIndividual ModelCombined Model4745Stage (ft)434139373512/6 12/11 12/16 12/21 12/26 12/31 1/5Peak Stage Diff. = 0.31' (DEC9) & +1.35' (DEC25)Date<strong>Hillsborough</strong> River <strong>Water</strong>shed Management PlanDecember 1997 State Park Gage vs. Model StageFigure5.3.15
90008000GageIndividual ModelCombined Model70006000Flow (cfs)50004000300020001000012/06/97 12/11/97 12/16/97 12/21/97 12/26/97 12/31/97 01/05/98Peak Flow Diff. = -9.2% (DEC9) & +9.7% (DEC25)<strong>Volume</strong> Diff. = -0.2%Date<strong>Hillsborough</strong> River <strong>Water</strong>shed Management PlanDecember 1997 State Park Gage vs. Model FlowFigure5.3.16
34GageIndividual Model32Combined Model30Stage (ft)282624229/21 9/23 9/25 9/27 9/29 10/1 10/3 10/5 10/7Peak Stage Diff. = +0.20'Date<strong>Hillsborough</strong> River <strong>Water</strong>shed Management PlanSeptember 1997 Morris Bridge Gage vs. Model StageFigure5.3.18
3635343332Stage (ft)3130292827GageIndividual ModelCombined Model2612/6 12/11 12/16 12/21 12/26 12/31 1/5Peak Stage Diff : -0.67'(Dec9) & +0.65'(Dec25)Date<strong>Hillsborough</strong> River <strong>Water</strong>shed Management PlanDecember 1997 Morris Bridge Gage vs. Model StageFigure5.3.19
32GageIndividual Model30Combined Model28Stage (ft)262422209/21 9/23 9/25 9/27 9/29 10/1 10/3 10/5 10/7Peak Stage Diff. = -0.06'Date<strong>Hillsborough</strong> River <strong>Water</strong>shed Management PlanSeptember 1997 S-155 Gage vs. Model StageFigure5.3.21
363432Stage(ft)302826Missing Gage DataGageIndividual ModelCombined Model2412/6 12/11 12/16 12/21 12/26 12/31 1/5Peak Stage Diff.= Unknown(Dec9) & +0.83'(Dec25)Date<strong>Hillsborough</strong> River <strong>Water</strong>shed Management PlanDecember 1997 S-155 Gage vs. Model StageFigure5.3.22
25.5Gage25Individual Model24.5Stage (ft)2423.52322.5229/21 9/23 9/25 9/27 9/29 10/1 10/3 10/5 10/7Peak Diff. = +0.3'Date<strong>Hillsborough</strong> River <strong>Water</strong>shed Management PlanSeptember 1997 Fowler Gage vs. Model StageFigure5.3.24
2524.5GageIndividual Model24Stage (ft)23.52322.5Adjusted Gate Operations2221.512/6 12/11 12/16 12/21 12/26 12/31 1/5 1/10Time<strong>Hillsborough</strong> River <strong>Water</strong>shed Management PlanDecember 1997 Fowler Gage vs. Model StageFigure5.3.25
CHAPTER 6EXISTING CONDITIONS LEVEL OF SERVICE6.1 Standard Design Storm Events<strong>Hillsborough</strong> <strong>County</strong> specified that six design storm events be applied to the <strong>Hillsborough</strong> River<strong>Water</strong>shed and the response <strong>of</strong> the system be evaluated. Those design storm events are asfollows:• 2.33-year, 24 hour duration (Mean Annual)• 5-year, 24 hour duration• 10-year, 24 hour duration• 25-year, 24 hour duration• 50-year, 24 hour duration• 100-year, 24 hour durationSpecific parameters for the design storm events include the use <strong>of</strong> the SCS Type II, FloridaModified rainfall distribution and Antecedent Moisture Condition II (normal). For informationregarding the selection <strong>of</strong> the rainfall depths associated with each design storm, refer to Section4.1.2.6.2 Existing Conditions Model Simulation ResultsThe hydrodynamic model calculated time varying flows and elevations for the detailed portions <strong>of</strong>the watershed, as indicated in the Link-Node diagrams presented in Appendix A. Complete,time-varying, output can be found in the electronic output files for each <strong>of</strong> the modeled designstorms. Plots <strong>of</strong> the hydraulic grade lines for these design storm events are located in Appendix B.6.3 Level <strong>of</strong> Service (LOS) AnalysisThe <strong>Hillsborough</strong> <strong>County</strong> Comprehensive Plan, Stormwater Element contains definitions for thelevel <strong>of</strong> service flood protection designations. These definitions specify that a storm return period,storm duration and a letter designation are required to define a level <strong>of</strong> flood protection. The floodlevel <strong>of</strong> service designations contained in the Comprehensive Plan are A, B, C, and D, with Arepresenting the highest service level and D the lowest. These levels are not strictly defined, andrequire a quantitative interpretation for analysis.The LOS designations in the Comprehensive Plan assume that the finished floor elevations <strong>of</strong>structures are higher than the surrounding adjacent property, which in turn are higher than theroads in the area. This assumption cannot be applied to all locations within <strong>Hillsborough</strong> <strong>County</strong>, aspecific example would be those locations that were constructed prior to the currently adopteddevelopment standards.6-1 <strong>Hillsborough</strong> River <strong>Water</strong>shed Management Plan
EXISTING CONDITIONS LEVEL OF SERVICEIt is possible to have a basin where the roads do not flood, yet the sites / structures do. Thisrequires the evaluation <strong>of</strong> the roads, sites and structures independently for the determination <strong>of</strong> thelevel <strong>of</strong> service designation.To establish the LOS for each individual drainage basin and thus the LOS for the subwatershed,landmark elevations were determined. Roadway overtopping elevations were taken from fieldsurvey or construction plans where available. The <strong>Hillsborough</strong> <strong>County</strong> (1997) (1”=200’) andSWFWMD topographic (date varies ~ 1979) (1”=200’) aerials were consulted for the site andstructure landmark elevations. The <strong>County</strong> aerials were reviewed for any structures located within1000’ on either side <strong>of</strong> the hydraulically modeled conveyance system. SWFWMD Topographicmaps were then consulted to select the lowest <strong>of</strong> the identified structures. The lowest contourclosest to the identified structure was selected as the site elevation and the finished floor elevationwas set to be one foot above that site elevation. Areas where no structures existed within thespecified range were not assigned elevations for site or structure and will be reported as LOS A.The following discussion lists the <strong>Hillsborough</strong> <strong>County</strong> Comprehensive Plan LOS Definitions andindicates the quantitative interpretation <strong>of</strong> the same:A - No Significant Floodingi) No flooding <strong>of</strong> roadwaysii) No flooding <strong>of</strong> structuresiii) 3” or less above siteB - No Major Residential Floodingi) 3” or less above road crownii) No flooding <strong>of</strong> structuresiii) 3” to 6” above siteC - No Significant Structure Floodingi) Greater than 3” above road crownii) No flooding <strong>of</strong> structuresiii) Greater than 6” above siteD - No Limitation <strong>of</strong> Floodingi) Structure Flooding6-2 <strong>Hillsborough</strong> River <strong>Water</strong>shed Management Plan
CHAPTER 6<strong>Hillsborough</strong> <strong>County</strong> has specified that the 25-year, 24 hour / Level B should be the target LOS forthis study. The following discussions base their analysis upon this specification. LOS designationswere assigned to the individual drainage basins, the subwatersheds and the regions. The LOS <strong>of</strong>a region is reflective <strong>of</strong> the worst case for each subwatershed within the region, and the LOS foreach subwatershed is reflective <strong>of</strong> the worst case for each individual basin within thesubwatershed.6.4 Level <strong>of</strong> Service (LOS) DeterminationsFor the purposes <strong>of</strong> reporting LOS determinations the six regions <strong>of</strong> the watershed described inSection 3.0 will be used. These regions are as follows:• <strong>Hillsborough</strong> River near Crystal Springs• Blackwater Creek• Central Tributaries• Northwest Tributaries• <strong>Hillsborough</strong> River• <strong>Tampa</strong> Bypass Canal (TBC) and TributariesThe following sections present the areas within these regions where the computer model indicatedinsufficient conveyance or storage capacity that resulted in flooding when associated with LOSdesignations. To further verify the results <strong>of</strong> the computer model, the documented EOC floodcomplaint areas were reviewed with the Counties maintenance units for their historicalrecollections. Correlation between the model results and those recollections is provided herein.6.4.1 <strong>Hillsborough</strong> River Near Crystal Springs (LOS not determined)Indian Creek (LOS not determined)This portion <strong>of</strong> the watershed lies primarily in Polk <strong>County</strong>. New River borders it on the west andthe <strong>Hillsborough</strong> River on the east. The <strong>Hillsborough</strong> <strong>County</strong> portion <strong>of</strong> this subwatershed iscontained within a large, privately owned tract <strong>of</strong> land in northeast <strong>Hillsborough</strong> <strong>County</strong>. Access tothis land to obtain survey information was denied. The drainage area for this subwatershed is over6,550 acres or approximately 10.2 square miles.Due to the limitations <strong>of</strong> the study area, as well as the access problem, this subwatershed wasmodeled utilizing the hydrologic portion <strong>of</strong> the model only. Since no hydraulic analyses wereperformed, no LOS designations can be provided.6-3 <strong>Hillsborough</strong> River <strong>Water</strong>shed Management Plan
EXISTING CONDITIONS LEVEL OF SERVICE<strong>Hillsborough</strong> River above Crystal Springs (LOS not determined)This portion <strong>of</strong> the watershed lies primarily in Polk and Pasco Counties and includes the portions <strong>of</strong>the <strong>Hillsborough</strong> River watershed, which contribute run<strong>of</strong>f upstream <strong>of</strong> Crystal Springs. Theseportions include Port Lonesome Ditches, Fish Hatchery Drain, and the Zephyrhills Drain. Thedrainage area for this subwatershed is over 48,000 acres or approximately 75.0 square miles.This subwatershed was modeled utilizing the hydrologic portion <strong>of</strong> the model only. Detailedhydraulic analysis was limited to the areas within <strong>Hillsborough</strong> <strong>County</strong>. Since no hydraulicanalyses were performed, no LOS designations can be provided.Big Ditch (LOS not determined)This portion <strong>of</strong> the watershed lies almost entirely within <strong>Hillsborough</strong> <strong>County</strong>. It is bounded byBlackwater Creek to the south and Fish Hatchery Drain / Port Lonesome Ditches to the north. Thedownstream portions <strong>of</strong> this subwatershed are contained within a large, privately owned tract <strong>of</strong>land in northeast <strong>Hillsborough</strong> <strong>County</strong>. Access to this land to obtain survey information was deniedand no existing survey data could be obtained. The drainage area for this subwatershed is over5,588 acres or approximately 8.7 square miles.Due to the denial <strong>of</strong> access to obtain detailed survey information, this subwatershed was modeledutilizing the hydrologic portion <strong>of</strong> the model only. Since no hydraulic analyses were performed, noLOS designations can be provided.6.4.2 Blackwater Creek (LOS D)Blackwater Creek (LOS C)The Blackwater Creek subwatershed lies within <strong>Hillsborough</strong> and Polk Counties and receives thedischarge from the tributaries <strong>of</strong> East Canal, Tiger Creek, and Itchepackesassa Creek. It isbounded to the north by Big Ditch and to the south by the aforementioned Blackwater CreekTributaries. The downstream portions <strong>of</strong> this subwatershed, below S.R. 39, are contained within alarge, privately owned tract <strong>of</strong> land in northeast <strong>Hillsborough</strong> <strong>County</strong>. Access to this land to obtainsurvey information was denied; however, previous studies by the Federal Emergency ManagementAgency (FEMA) and the Southwest Florida <strong>Water</strong> Management District (SWFWMD) containedcross-sectional information which was utilized for our modeling purposes in this area. Thedrainage area for this subwatershed is almost 33,000 acres or 51.5 square miles.6-4 <strong>Hillsborough</strong> River <strong>Water</strong>shed Management Plan
CHAPTER 6Roadway Flooding: LOS CUnnamed Dirt Road (Basin 680955) - This road lies approximately 1000’ upstream <strong>of</strong> CanaanAvenue. Overtopping <strong>of</strong> this roadway is expected starting with the 10-year event.Site Flooding during the 25-year event: LOS CJordan Boulevard Area (Basins 680860, 680925) – Residential yard flooding <strong>of</strong> privatecommunity beginning with the 10-year event. Residents reported significant site floodingduring El Nino.S.R. 39 / SCL RR Area (Basins 680350, 680400) – Site flooding in rural area downstream <strong>of</strong>crossing. Flooding near structures beginning with 25-year event.Structure Flooding during the 25-year event: LOS AJordan Boulevard Area (Basins 60860, 680925) – Community adjacent to creek may beaffected. Model results indicate no structure flooding in the 100-year event. Residentsreported significant site flooding but no home flooding during El Nino.Itchepackesassa Creek (LOS C)The Itchepackesassa Creek subwatershed lies within <strong>Hillsborough</strong> and Polk Counties and receivesthe discharge from East Canal before ultimate discharge into Blackwater Creek. It is bounded tothe north by Blackwater Creek, to the south by the Alafia River <strong>Water</strong>shed, and to the west by EastCanal. Previous studies containing cross-sectional information were utilized for our modelingpurposes in the rural areas <strong>of</strong> this subwatershed. The drainage area for this subwatershed is over26,000 acres or approximately 41.1 square miles.Roadway Flooding: LOS BDirt Road Crossing (Basin 684510) - Overtopping <strong>of</strong> the roadway is expected starting with the2.33-year event.Dirt Road Crossing (Basin 684525) - Overtopping <strong>of</strong> the roadway is expected starting with the10-year event.Maintenance personnel indicated roadway flooding concerns on North Wilder Road north <strong>of</strong>Williams Road, Charlie Taylor Road south <strong>of</strong> Knights Griffin Road, Charlie Taylor Road north <strong>of</strong>Swindell Road, the Terry Lane, Ranoy Lane, Dwayne Drive area just east <strong>of</strong> Charlie TaylorRoad and north <strong>of</strong> I-4, and the Pleasant Acre Road area east <strong>of</strong> North Wilder Road and north <strong>of</strong>U.S. 92. These locations are removed from the main conveyance system <strong>of</strong> ItchepackesassaCreek and are noted as localized problem areas.6-5 <strong>Hillsborough</strong> River <strong>Water</strong>shed Management Plan
EXISTING CONDITIONS LEVEL OF SERVICESite Flooding during the 25-year event: LOS BKnights Griffin Road Area (Basins 684525, 684550, 685010) – Site flooding in rural areabeginning with the 10-year event.Structure Flooding during the 25-year event: LOS AModeling results do not indicate any structure flooding within <strong>Hillsborough</strong> <strong>County</strong>.East Canal (LOS D)The East Canal Creek subwatershed lies within <strong>Hillsborough</strong> <strong>County</strong> and receives the dischargefrom the <strong>City</strong> <strong>of</strong> Plant <strong>City</strong>. It is bounded to the north and east by Itchepackesassa Creek, to thesouth by the Alafia River <strong>Water</strong>shed, and to the west by the Central Tributaries and the LakeThonotosassa watershed. The drainage area for this subwatershed is over 8,300 acres orapproximately 13.0 square miles.Roadway Flooding: LOS CBailey Road (Basins 686046, 686047, 686048, 686049) - Overtopping <strong>of</strong> the road crossing isexpected starting with the 25-year event.Half Mile Road extended (Basins 686045, 686100) - Overtopping <strong>of</strong> the low dirt road crossingis expected starting with the 2.33-year event. This low dirt road crossing is a parallel crossing tothe bridge over the main channel. The model does not indicate overtopping <strong>of</strong> the main bridge.Golf Cart Crossings (Basin 686480) - Overtopping <strong>of</strong> the golf cart crossings in the <strong>County</strong>Meadows Area are expected starting with the 2.33-year event.Terrace Drive (Basin 686571) Overtopping <strong>of</strong> the roadway is expected starting with the 2.33-year event.Dirt Road Crossing (Basin 687050) - Overtopping <strong>of</strong> the roadway is expected beginning withthe 25-year event.Site Flooding during the 25-year event: LOS CBailey Road Area (Basins 686046, 686047, 686048, 686049) – Site flooding in rural area isexpected starting with the 2.33-year event.Chestnut Drive Area (Basin 686460) – Site flooding in mobile home community beginning withthe 2.33-year event.6-6 <strong>Hillsborough</strong> River <strong>Water</strong>shed Management Plan
CHAPTER 6Terrace Drive Area (Basins 686571, 686620) – Site flooding beginning with the 2.33-yearevent. Area was pumped during El Nino.Dirt Road Crossing Area (Basin 687050) – Site flooding in rural area beginning with the 50-yearevent.Structure Flooding during the 25-year event: LOS DBailey Road Area (Basins 686046, 686047, 686048, 686049) – Structure flooding in rural areais expected starting with the 100-year event.Terrace Drive Area (Basin 686620) – Structure flooding beginning with the 25-year event. Areawas pumped during El Nino.Tiger Creek (LOS A)The Tiger Creek subwatershed lies within <strong>Hillsborough</strong> <strong>County</strong> and discharges through the recentlyconstructed Cone Ranch Rehydration Project before ultimate discharge into Blackwater Creek. Itis bounded to the north by Blackwater Creek, to the east by Itchepackesassa Creek and EastCanal, and to the west by the Central Tributaries. Data from the Cone Ranch Rehydration Projectwas utilized for our modeling purposes. The drainage area for this subwatershed is over 2,800acres or approximately 4.5 square miles.Roadway Flooding: LOS AModeling results do not indicate any roadway flooding within Tiger CreekSite Flooding during the 25-year event: LOS ASR 39 Area (Basin 682500) - Site flooding in rural area beginning with the 50-year event.Structure Flooding during the 25-year event: LOS AModeling results do not indicate any structure flooding within Tiger CreekTable 6.4.2 contains the regional basin numbers and their calculated LOS. For LOS results worsethan A, the corresponding elevation identifying the problem area is provided. Figure 6.4.2 depictsthe region’s LOS in graphical form.6-7 <strong>Hillsborough</strong> River <strong>Water</strong>shed Management Plan
EXISTING CONDITIONS LEVEL OF SERVICE6.4.3 Central Tributaries (LOS D)Two Hole Branch (LOS D)The Two Hole Branch subwatershed is located directly south <strong>of</strong> the Blackwater Creek Area anddischarges into the <strong>Hillsborough</strong> River approximately 0.75 miles south <strong>of</strong> the <strong>Hillsborough</strong> RiverState Park. The basin drains approximately 9.5 square miles <strong>of</strong> low-density residential areas andagricultural lands.Roadway Flooding: LOS CPrivate Road Crossing (Basin 665200) - Overtopping <strong>of</strong> this private road is expected startingwith the 50-year event.Private Road Crossing (Basin 665300) - Overtopping <strong>of</strong> this private road is expected startingwith the 50-year event.Private Road Crossing (Basin 665400) - Overtopping <strong>of</strong> this private road is expected startingwith the 50-year event.Private Road Crossing (Basins 665750, 665800) - Overtopping <strong>of</strong> this private road is expectedstarting with the 2.33-year event.Dirt Road Crossing (Basin 685850) - Overtopping <strong>of</strong> this dirt road crossing is expected startingwith the 2.33-year event.Bruton Road Crossing (Basins 665850, 665900) - Overtopping <strong>of</strong> this roadway is expectedstarting with the 25-year event. Maintenance personnel stated this area has frequent floodingproblems.Dirt Road Crossing (Basin 665925) - Overtopping <strong>of</strong> this dirt road crossing is expected startingwith the 2.33-year event.Private Road Crossing (Basins 665970, 665980) - Overtopping <strong>of</strong> this private road is expectedstarting with the 2.33-year event.Bruton Road Crossing (Basins 667600, 667700) - Overtopping <strong>of</strong> this roadway is not predicted.Maintenance personnel stated the area near Gater Ranch Road, to the east, has frequentflooding problems.Bob Smith Avenue Crossing (Basins 667800, 667900) - Overtopping <strong>of</strong> this roadway isexpected starting with the 25-year event.6-8 <strong>Hillsborough</strong> River <strong>Water</strong>shed Management Plan
CHAPTER 6Dirt Road Crossing (Basin 667900) - Overtopping <strong>of</strong> this dirt road crossing is expected startingwith the 2.33-year event.Dirt Road Crossing (Basin 667920) - Overtopping <strong>of</strong> this dirt road crossing is expected startingwith the 2.33-year event.Additional problem area noted by maintenance personnel at the intersection <strong>of</strong> Justin Lane andShoupe Road.Site Flooding during the 25-year event: LOS CBruton Road Area (Basins 665830, 665850) – Site flooding in rural area north <strong>of</strong> Bruton Road.Site flooding expected to begin during 5-year event.Bruton Road Area (Basin 665900) – Site flooding in rural area south <strong>of</strong> Bruton Road. Siteflooding expected to begin during 50-year event.Bruton Road Area (Basins 667300, 667500, 667600) – Site flooding in rural area north <strong>of</strong>Bruton Road. Site flooding expected to begin during 10-year event.Bob Smith Avenue Area (Basins 667900, 667920) – Site flooding in rural area south <strong>of</strong> BobSmith Avenue. Site flooding expected to begin during 5-year event.Structure Flooding during the 25-year event: LOS DBruton Road Area (Basin 667400) – Structure flooding upstream <strong>of</strong> Bruton Road beginning withthe 50-year event.Clay Gully East (LOS D)This subwatershed is located south <strong>of</strong> Two Hole Branch, north <strong>of</strong> Hollomans Branch, and consists<strong>of</strong> several tributary ditch systems. The drainage area for this subwatershed is over 3,100 acres orapproximately 4.8 square miles.Roadway Flooding: LOS CPrivate Farm Road Crossing (Basin 660100) - Overtopping <strong>of</strong> this private road is expectedstarting with the 2.33-year event.Private Farm Road Crossing (Basin 660300) - Overtopping <strong>of</strong> this private road is expectedstarting with the 2.33-year event.6-9 <strong>Hillsborough</strong> River <strong>Water</strong>shed Management Plan
EXISTING CONDITIONS LEVEL OF SERVICEPrivate Farm Road Crossing (Basin 660400) - Overtopping <strong>of</strong> this private road is expectedstarting with the 5-year event.Private Driveway Crossing (Basin 660400) - Overtopping <strong>of</strong> this driveway is expected startingwith the 2.33-year event.Five Acres Road Crossing (Basin 660500) - Overtopping <strong>of</strong> this roadway is expected startingwith the 2.33-year event. Maintenance personnel stated this area has frequent problems.Dormandy Loop Crossing (Basin 660700) - Overtopping <strong>of</strong> this roadway is expected startingwith the 5-year event. Maintenance personnel stated this area has problems.Dormandy Road Crossing (Basins 660840, 660850) - Overtopping <strong>of</strong> this roadway is expectedstarting with the 2.33-year event.Dormandy Loop Crossing (Basins 660985, 660990) - Overtopping <strong>of</strong> this roadway is expectedstarting with the 25-year event. Maintenance personnel stated this area has problems.Dormandy Road Crossing (Basin 660995) - Overtopping <strong>of</strong> this roadway is expected startingwith the 10-year event.St. Francis Lane Crossing (Basin 661000) - Overtopping <strong>of</strong> this roadway is expected startingwith the 2.33-year event.Private Dirt Road Crossing (Basins 661100, 661200) - Overtopping <strong>of</strong> this dirt road is expectedstarting with the 2.33-year event.Private Dirt Road Crossing (Basins 661200, 661300) - Overtopping <strong>of</strong> this dirt road is expectedstarting with the 2.33-year event.Back Road Crossing (Basins 661400, 661500) - Overtopping <strong>of</strong> this roadway is expectedstarting with the 50-year event.St. Francis Lane Crossing (Basin 662000) - Overtopping <strong>of</strong> this roadway is expected startingwith the 5-year event.Hollomans Branch Road Crossing (Basins 662300, 662350) - Overtopping <strong>of</strong> this roadway isexpected starting with the 10-year event.Private Dirt Road Crossing (Basin 662400) - Overtopping <strong>of</strong> this dirt road is expected startingwith the 2.33-year event.6-10 <strong>Hillsborough</strong> River <strong>Water</strong>shed Management Plan
CHAPTER 6Private Dirt Road Crossing (Basin 662500) - Overtopping <strong>of</strong> this dirt road is expected startingwith the 2.33-year event.Private Dirt Road Crossing (Basin 663000) - Overtopping <strong>of</strong> this roadway is expected startingwith the 2.33-year event.Private Dirt Road Crossing (Basin 663100) - Overtopping <strong>of</strong> this roadway is expected startingwith the 100-year event.Private Farm Road Crossing (Basins 663500, 663600) - Overtopping <strong>of</strong> this private road isexpected starting with the 2.33-year event.Barn Access Road Crossing (Basin 663600) - Overtopping <strong>of</strong> this roadway is expected startingduring the 2.33-year event.Five Acres Road Crossing (Basin 663700) - Overtopping <strong>of</strong> this roadway is expected startingwith the 25-year event.Private Dirt Road Crossing (Basin 663800) - Overtopping <strong>of</strong> this roadway is expected startingwith the 2.33-year event.Five Acres Road Crossing (Basin 664000) - Overtopping <strong>of</strong> this roadway is expected startingwith the 10-year event.Site Flooding during the 25-year event: LOS CPrivate Farm Road Area (Basin 660100) – Rural site flooding in this area starting with the 100-year event.Private Driveway Area (Basin 660400) – Rural site flooding in this area starting with the 100-year event.Five Acres Road Area (Basin 660500) - Rural site flooding upstream <strong>of</strong> Five Acres Roadbeginning with the 2.33-year event. Maintenance personnel stated this area has frequentflooding problems.Dormandy Loop Area (Basin 660700) - Rural site flooding downstream <strong>of</strong> Dormandy Loopbeginning with the 2.33-year event.Dormandy Road Area (Basin 660840) - Rural site flooding downstream <strong>of</strong> Dormandy Roadbeginning with the 2.33-year event.6-11 <strong>Hillsborough</strong> River <strong>Water</strong>shed Management Plan
EXISTING CONDITIONS LEVEL OF SERVICEBob Smith Road Area (Basin 660860) - Rural site flooding upstream <strong>of</strong> Bob Smith Roadbeginning with the 5-year event.Dormandy Road Area (Basin 660995) - Rural site flooding upstream <strong>of</strong> Dormandy Roadbeginning with the 10-year event.Private Dirt Road Area (Basin 661100) - Rural site flooding in this area beginning with the 2.33-year event.Private Dirt Road Area (Basin 661400) - Rural site flooding beginning with the 2.33-year event.Back Road Area (Basin 661500) - Rural site flooding beginning with the 10-year event.Five Acres Road Area (Basins 662300, 662350) - Rural site flooding in this area beginning withthe 2.33-year event.Hollomans Branch Road Area (Basins 662300, 662350) - Rural site flooding in this areabeginning with the 2.33-year event.Structure Flooding during the 25-year event: LOS DFive Acres Road Area (Basin 660500) - Rural structure flooding upstream <strong>of</strong> Five Acres Roadbeginning with the 50-year event.Dormandy Loop Area (Basin 660700) - Rural structure flooding downstream <strong>of</strong> Dormandy Loopbeginning with the 2.33-year event.Private Dirt Road Area (Basin 661100) - Rural structure flooding beginning with the 10-yearevent.Five Acres Road / Hollomans Branch Road Area (Basin 662350) - Rural structure flooding inthis area beginning with the 100-year event.Hollomans Branch (LOS D)The Hollomans Branch subwatershed is bounded to the north by Clay Gully East, to the south bythe Lake Thonotosassa / Flint Creek watershed, and to the west by East Canal. Previous studiescontaining cross-sectional information were utilized for our modeling purposes in the rural areas <strong>of</strong>this subwatershed. The drainage area for this subwatershed is over 8,300 acres or approximately13.0 square miles.6-12 <strong>Hillsborough</strong> River <strong>Water</strong>shed Management Plan
CHAPTER 6Roadway Flooding: LOS CMcIntosh Road Crossing (Basins 650135, 650150) - Overtopping <strong>of</strong> this roadway is expectedstarting with the 50-year event.Private Road Crossing (Basin 650300) - Overtopping <strong>of</strong> this private road is expected startingwith the 2.33-year event.Five Acres Road Crossing (Basin 650460) - Overtopping <strong>of</strong> this roadway is expected startingwith the 10-year event.Private Road Crossing (Basin 650550). - Overtopping <strong>of</strong> this private road is expected startingwith the 5-year event.Dormandy Road Crossing (Basin 650600) - Overtopping <strong>of</strong> this roadway is expected startingwith the 5-year event. Maintenance personnel stated this area has frequent flooding problems.Private Road Crossing (Basin 650700) - Overtopping <strong>of</strong> this private road is expected startingwith the 2.33-year event.Groom Road Crossing (Basin 652000) – Overtopping <strong>of</strong> this roadway is expected starting withthe 2.33-year event.McIntosh Road Crossing (Basin 652100) – Overtopping <strong>of</strong> this roadway is expected startingwith the 10-year event.Private Road Crossing (Basin 652120) - Overtopping <strong>of</strong> this private road is expected startingwith the 10-year event.Franklin Road Crossing (Basins 653050, 653075) - Overtopping <strong>of</strong> this roadway is expectedstarting with the 25-year event.Private Road Crossing (Basin 653050) - Overtopping <strong>of</strong> this private road is expected startingwith the 2.33-year event.Gallager Road Crossing (Basin 653080) - Overtopping <strong>of</strong> this roadway is expected starting withthe 5-year event.Private Road Crossing (Basins 653150, 653200) - Overtopping <strong>of</strong> this private road is expectedstarting with the 2.33-year event.6-13 <strong>Hillsborough</strong> River <strong>Water</strong>shed Management Plan
EXISTING CONDITIONS LEVEL OF SERVICEKnights Griffin Road Crossings (Basin 650300, 653380, 653385) - Overtopping <strong>of</strong> theseroadways are expected starting with the 5-year event.Private Road Crossing (Basin 653399) - Overtopping <strong>of</strong> this private road is expected startingwith the 10-year event.Private Road Crossing (Basin 653550) - Overtopping <strong>of</strong> this private road is expected startingwith the 25-year event.Staruss Road Crossing (Basin 653650) - Overtopping <strong>of</strong> this road is expected starting with the25-year event.Pless Road Crossing (Basin 654105) - Overtopping <strong>of</strong> this roadway is expected starting withthe 10-year event.Private Road Crossing (Basin 654110) - Overtopping <strong>of</strong> this private road is expected startingwith the 2.33-year event.North Pole Road Crossing (Basins 654110, 654150, 654290) - Overtopping <strong>of</strong> this roadway isexpected starting with the 2.33-year event.Kapinson Road Crossing (Basin 654220) - Overtopping <strong>of</strong> this roadway is expected startingwith the 5-year eventPeeples Road Crossing (Basins 654290, 654250, 654310) - Overtopping <strong>of</strong> this roadway isexpected starting with the 2.33-year eventPrivate Wooden Bridge Crossing (Basin 654310) - Overtopping <strong>of</strong> this private wooden bridge isexpected starting with the 50-year event.Fraizer Road Crossing (Basin 654350) - Overtopping <strong>of</strong> this private wooden bridge is expectedstarting with the 5-year event.Platt Road Crossing (Basin 654400) - Overtopping <strong>of</strong> this private wooden bridge is expectedstarting with the 10-year event.Cork Road Crossing (Basin 654420) - Overtopping <strong>of</strong> this private road is expected starting withthe 25-year event.Burnt Barn Ave Crossing (Basin 655025) - Overtopping <strong>of</strong> this roadway is expected startingwith the 50-year event.Dormandy Road Crossing (Basin 655026) - Overtopping <strong>of</strong> this roadway is expected startingwith the 50-year event.6-14 <strong>Hillsborough</strong> River <strong>Water</strong>shed Management Plan
CHAPTER 6Private Road Crossing (Basin 655100) - Overtopping <strong>of</strong> this private road is expected startingwith the 5-year event.Private Road Crossing (Basin 655240) - Overtopping <strong>of</strong> this private road is expected startingwith the 2.33-year event.Dormandy Road Crossing (Basin 655300) - Overtopping <strong>of</strong> this roadway is expected startingwith the 2.33-year event. Maintenance personnel stated this area has frequent floodingproblems.Site Flooding during the 25-year event: LOS CMcIntosh Road Area (Basins 650135, 650150) - Rural site flooding upstream and downstream<strong>of</strong> McIntosh Road beginning with the 10-year event. Maintenance personnel stated this areahas frequent flooding problems.Ike Smith Road Area (Basins 650200, 650300) - Rural site flooding west <strong>of</strong> Ike Smith Roadbeginning with the 2.33-year event.Five Acres Road Area (Basin 650360, 650400) - Rural site flooding near the intersection <strong>of</strong>Four Pines and Five Acres Road beginning with the 2.33-year event.Five Acres Road Area (Basin 650460) - Rural site flooding near the intersection <strong>of</strong> Shorter andFive Acres Road beginning with the 50-year event.Dormandy Road Area (Basins 650550, 650650) - Rural site flooding downstream <strong>of</strong> DormandyRoad beginning with the 5-year event.Dormandy Road Area (Basin 650600) - Rural site flooding near the intersection <strong>of</strong> DormandyRoad and Hovan Road beginning with the 2.33-year event. Maintenance personnel stated thisarea has frequent flooding problems.Fish Farm Area (Basin 652110) - Site flooding <strong>of</strong> a tropical fish farm east <strong>of</strong> McIntosh Roadbeginning with the 2.33-year event. Maintenance personnel stated this area has frequentflooding problems.McIntosh Road Area (Basin 652200) - Rural site flooding east <strong>of</strong> McIntosh Road Areabeginning with the 25-year event.Franklin/Knights Griffin Road Area (Basin 652300) - Rural site flooding near the intersection <strong>of</strong>Knights Griffin and Franklin Road beginning with the 5-year event.6-15 <strong>Hillsborough</strong> River <strong>Water</strong>shed Management Plan
EXISTING CONDITIONS LEVEL OF SERVICEIke Smith Road Area (Basin 653050) - Rural site flooding upstream <strong>of</strong> Ike Smith Roadbeginning with the 50-year event.Franklin Road Area (Basin 653075) - Rural structure flooding upstream in the Franklin RoadArea beginning with the 2.33-year event.Gallager Road Area (Basin 653076) - Rural site flooding upstream <strong>of</strong> Gallager Road beginningwith the 25-year event.West Franklin Road Area (Basin 653150) - Rural site flooding near the intersection <strong>of</strong> WestFranklin Road and Five Acres Road beginning with the 2.33-year event.Gallager Road Area (Basin 653301) - Rural site flooding north <strong>of</strong> the Gallager and ElkviewRoad intersection beginning with the 2.33-year event.Knights Griffin Road (Basin 653380) - Rural structure flooding in this area beginning with the10-year event.Five Acres Road Area (Basin 654000) Rural site flooding near the intersection <strong>of</strong> Five Acresand Four Pines Road beginning with the 2.33-year event.Five Acres Road Area (Basin 654050). Rural site flooding between Five Acres and Pless Roadbeginning with the 10-year eventPless Road Area (Basin 654105) - Rural site flooding upstream <strong>of</strong> Pless Road beginning withthe 5-year event.Knights Griffin Road (Basin 654150). Rural site flooding in the Knights Griffin Road Areabeginning with the 25-year event.Knights Griffin Road Area (Basin 654220) - Rural site flooding north <strong>of</strong> Knights Griffin Roadbeginning with the 50-year event.Knights Griffin Road Area (Basin 654250) - Rural site flooding south <strong>of</strong> Knights Griffin Roadbeginning with the 5-year event.Fraizer Road Area (Basin 654290) - Rural site flooding near the intersection <strong>of</strong> Fraizer andKnights Griffin Road beginning with the 10-year event.Fraizer Road Area (Basin 654310) - Rural site flooding in the Fraizer and Knights Griffin Roadarea beginning with the 25-year event.6-16 <strong>Hillsborough</strong> River <strong>Water</strong>shed Management Plan
CHAPTER 6Fraizer Road Area (Basin 654350) - Rural site flooding in the Fraizer Road area beginning withthe 5-year event.Plat Road Area (Basin 654400) - Rural site flooding in the Plat Road area beginning with the2.33-year event.Cork Road Area (Basin 654450) - Rural site flooding in the Cork Road area beginning with the10-year event.Dormandy Road Area (Basin 655026) - Rural site flooding in the Dormandy Road areabeginning with the 10-year event.Burnt Barn Avenue Area (Basins 655100, 655240, 655300 - Rural site flooding betweenDormandy Road and Burnt Barn Avenue beginning with the 2.33-year event.Structure Flooding during the 25-year event: LOS DMcIntosh Road Area (Basin 650135) - Rural structure flooding downstream <strong>of</strong> McIntosh Roadbeginning with the 50-year event.McIntosh Road Area (Basin 650150) - Rural structure flooding upstream <strong>of</strong> McIntosh Roadbeginning with the 2.33-year event.Ike Smith Road Area (Basin 650300) - Rural structure flooding beginning with the 2.33-yearevent.Five Acres Road Area (Basin 650360) - Rural structure flooding beginning with the 100-yearevent.Dormandy Road Area (Basins 650550 650650) - Rural structure flooding downstream <strong>of</strong>Dormandy Road beginning with the 10-year event.Dormandy Road Area (Basin 650600) - Rural structure flooding near the Dormandy Road andHovan Road intersection beginning with the 2.33-year event. Maintenance personnel statedthis area has frequent flooding problems.McIntosh Road / Fish Farm Area (Basin 652110) - Rural structure flooding <strong>of</strong> tropical fish farmupstream <strong>of</strong> McIntosh Road beginning with the 2.33-year event.McIntosh Road Area (Basin 652200) - Rural structure flooding east <strong>of</strong> McIntosh Roadbeginning with the 50-year event.6-17 <strong>Hillsborough</strong> River <strong>Water</strong>shed Management Plan
EXISTING CONDITIONS LEVEL OF SERVICEFranklin Road Area (Basin 652300) - Rural structure flooding upstream in the Franklin RoadArea beginning with the 100-year event.Ike Smith Road Area (Basin 653050) - Rural structure flooding upstream <strong>of</strong> Ike Smith Roadbeginning with the 2.33-year event.Franklin Road Area (Basin 653075) - Rural structure flooding upstream in the Franklin RoadArea beginning with the 25-year event.Gallager Road Area (Basins 653075, 653080) - Rural structure flooding upstream <strong>of</strong> GallagerRoad beginning with the 50-year event.Gallagher Road Area (Basin 653301) - Rural structure flooding north <strong>of</strong> the Gallager andElkview Road intersection beginning with the 2.33-year event.Knights Griffin Road Area (Basin 653380) - Rural structure flooding in the area near KnightsGriffin Road beginning with the 25-year event.Five Acres Road Area (Basin 650400) - Rural structure flooding beginning with the 100-yearevent.Pless Road Area (Basin 654105) - Rural structure flooding upstream <strong>of</strong> Pless Road beginningwith the 50-year event.Knights Griffin Road Area (Basin 654250) - Rural structure flooding south <strong>of</strong> Knights GriffinRoad beginning with the 25-year event.Fraizer Road Area (Basin 654350) - Rural structure flooding in the Fraizer Road area beginningwith the 10-year event.Platt Road Area (Basins 654400, 654420) - Rural structure flooding in the Plat Road areabeginning with the 5-year event.Dormandy Road Area (Basin 655026) - Rural structure flooding in the Dormandy Road areabeginning with the 50-year event.Burnt Barn Avenue Area (Basins 655100, 655240) - Rural structure flooding betweenDormandy Road and Burnt Barn Avenue beginning with the 25-year event.Private Dirt Road Area (Basin 655240) - Rural structure flooding beginning with the 50-yearevent.6-18 <strong>Hillsborough</strong> River <strong>Water</strong>shed Management Plan
CHAPTER 6Table 6.4.3 contains the regional basin numbers and their calculated LOS. For LOS results worsethan A, the corresponding elevation identifying the problem area is provided. Figure 6.4.3 depictsthe region’s LOS in graphical form.6.4.4 Northwest Tributaries (LOS D)New River (LOS D)The New River subwatershed lies within <strong>Hillsborough</strong> and Polk Counties and ultimately dischargesinto the <strong>Hillsborough</strong> River. It is bounded on the west by Basset Branch, the east by the IndianCreek, and to the south by <strong>Hillsborough</strong> River. Previous studies containing cross-sectionalinformation were utilized for our modeling purposes in this subwatershed. The drainage area forthis subwatershed is over 12,159 acres or approximately 19.0 square miles.Roadway Flooding: LOS CCreek Road (Basin 673200) - Overtopping <strong>of</strong> the roadway is expected starting with the 5-yearevent.Morris Bridge Road (Basin 675200) - Overtopping <strong>of</strong> the roadway is expected starting with the5-year event.Site Flooding during the 25-year event: LOS CSouth <strong>of</strong> Morris Bridge Road (Basin 673100) - Site flooding in rural area beginning with the2.33-year event.South <strong>of</strong> Morris Bridge Road (Basin 673100) - Site flooding in rural area beginning with the100-year event.North <strong>of</strong> Morris Bridge Road (Basin 675100) - Site flooding predicted beginning with the 50-year event. Development <strong>of</strong> this area is in progress.Structure Flooding during the 25-year event: LOS DSouth <strong>of</strong> Morris Bridge Road (Basin 673100) - Structure flooding in this area beginning with the5-year event.North <strong>of</strong> Morris Bridge Road (Basin 675100) - Structural flooding in this area beginning with the100-year event.6-19 <strong>Hillsborough</strong> River <strong>Water</strong>shed Management Plan
EXISTING CONDITIONS LEVEL OF SERVICEBasset Branch (LOS D)The Basset Branch subwatershed lies within <strong>Hillsborough</strong> and Polk Counties and ultimatelydischarges into the <strong>Hillsborough</strong> River. It is bounded on the west by Clay Gully West, on the eastby New River, and to the south by the <strong>Hillsborough</strong> River. The drainage area for thissubwatershed is over 6,751 acres or approximately 10.6 square miles.Roadway Flooding: LOS CDirt farm roads (Basins 670350, 671400, 671500) - Roadway overtopping expected startingwith the 2.33-year event.Morris Bridge Road (Basin 671100, 670000) - Overtopping <strong>of</strong> the roadway is predicted for the100-year event.Site Flooding during the 25-year event: LOS CSouth <strong>of</strong> Morris Bridge Road (Basin 670000) - Site flooding in this basin begins with the 2.33-year event.North <strong>of</strong> Morris Bridge Road (Basins 670100, 671100) - Site flooding in this area beginning withthe 25-year event.Structure Flooding during the 25-year event: LOS DSouth <strong>of</strong> Morris Bridge Road (Basin 670000) - Structure flooding in this area beginning with the25-year event.North <strong>of</strong> Morris Bridge Road (Basin 670100) - Structure flooding in this area beginning with the50-year event.South <strong>of</strong> Morris Bridge Road (Basin 671100) - Structure flooding in this area beginning with the100-year event.Clay Gully West (LOS D)The Clay Gully West subwatershed lies within <strong>Hillsborough</strong> and Polk Counties and ultimatelydischarges into the <strong>Hillsborough</strong> River. It is bounded on the west by Trout Creek, on the east byCorey Lakes and New River, and to the south by the <strong>Hillsborough</strong> River. The drainage area forthis subwatershed is over 5,205 acres or approximately 8.1 square miles.6-20 <strong>Hillsborough</strong> River <strong>Water</strong>shed Management Plan
CHAPTER 6Roadway Flooding: LOS A* Modeling results do not indicate any roadway flooding within the unincorporated <strong>Hillsborough</strong><strong>County</strong> portion <strong>of</strong> Clay Gully WestSite Flooding during the 25-year event: LOS C* Southwest <strong>of</strong> Fox Chapel Road (Basin 635700) - Site flooding in this area beginning with the10-year event.Structure Flooding during the 25-year event: LOS D* Southwest <strong>of</strong> Fox Chapel Road (Basin 635700) - Structure flooding in this area before the25-year event.* Potential discrepancies between survey data and development plans exist.Trout Creek (LOS A)The southern portion <strong>of</strong> the Trout Creek subwatershed lies within <strong>Hillsborough</strong> <strong>County</strong> and theremaining portion in Pasco <strong>County</strong>. It is bounded by Cypress Creek on the north and west, ClayGully on the east and its southerly boundary is the <strong>Hillsborough</strong> River Proper. The drainage areafor this subwatershed is approximately 17,500 acres or approximately 27.3 square miles.All but approximately three square miles <strong>of</strong> the watershed is in incorporated <strong>City</strong> <strong>of</strong> <strong>Tampa</strong>, isundeveloped vacant land, or is in public ownership. Accordingly, the site and structure LOSevaluation was limited to the square mile area <strong>of</strong> unincorporated <strong>Hillsborough</strong> <strong>County</strong>. All <strong>of</strong> theBruce B. Downs crossings, whether in or out <strong>of</strong> unincorporated <strong>Hillsborough</strong> <strong>County</strong>, wereconsidered in the LOS evaluation.Roadway Flooding: LOS AModeling results do not indicate any roadway flooding within the unincorporated <strong>Hillsborough</strong><strong>County</strong> portion <strong>of</strong> Trout CreekSite Flooding during the 25-year event: LOS AModeling results do not indicate any site flooding within the unincorporated <strong>Hillsborough</strong><strong>County</strong> portion Trout Creek6-21 <strong>Hillsborough</strong> River <strong>Water</strong>shed Management Plan
EXISTING CONDITIONS LEVEL OF SERVICEStructure Flooding during the 25-year event: LOS AModeling results do not indicate any structure flooding within the unincorporated <strong>Hillsborough</strong><strong>County</strong> portion Trout CreekTable 6.4.4 contains the regional basin numbers and their calculated LOS. For LOS results worsethan A, the corresponding elevation identifying the problem area is provided. Figure 6.4.4 depictsthe region’s LOS in graphical form.6.4.5 <strong>Hillsborough</strong> River (LOS A)This region is comprised <strong>of</strong> the river above and below control structure S-155. This area alsoincludes the surrounding basins that contribute run<strong>of</strong>f to the river and Cow House Creek. The rivercan readily be divided into two sections separated by SWFWMD’s control structure S-155. Thesection above S-155 is bounded to the northeast by the Crystal Springs area, to the east by theBlackwater and Central Tributaries Regions, and to the south by the Lake Thonotosassa / FlintCreek area and the TBC. The section below S-155 is bounded on the north by S-155 and CypressCreek and to the south by the <strong>Tampa</strong> Dam. The drainage area for this subwatershed is over50,800 acres or approximately 79.4 square miles.Roadway Flooding: LOS AModeling results do not indicate any roadway flooding within the <strong>Hillsborough</strong> RiverSubwatershedSite Flooding during the 25-year event: LOS AModeling results do not indicate any site flooding within the <strong>Hillsborough</strong> River SubwatershedStructure Flooding during the 25-year event: LOS AModeling results do not indicate any structure flooding within the <strong>Hillsborough</strong> RiverSubwatershedTable 6.4.5 contains the regional basin numbers and their calculated LOS. For LOS results worsethan A, the corresponding elevation identifying the problem area is provided. Figure 6.4.5 depictsthe region’s LOS in graphical form.6-22 <strong>Hillsborough</strong> River <strong>Water</strong>shed Management Plan
CHAPTER 66.4.6 <strong>Tampa</strong> Bypass Canal and Tributaries (LOS D)Mango Area (LOS C)The Mango subwatershed originates in the area <strong>of</strong> Lake Mango and receives discharge from areasas far south as the intersection <strong>of</strong> Parsons Avenue and the railroad. The discharge from LakeMango enters the <strong>Tampa</strong> Bypass Canal downstream <strong>of</strong> S-162. The Williams subwatershedbounds it to the north, the Falkenburg Subwatershed lies to the south, and to the west is the<strong>Tampa</strong> Bypass Canal. The drainage area for this subwatershed is over 5,824 acres orapproximately 9.1 square miles.Roadway Flooding: LOS CHighview Road (Basins 614350, 614360) - Overtopping <strong>of</strong> the roadway is expected startingwith the 25-year event.Windhorst Road (Basin 614375) - Overtopping <strong>of</strong> the roadway is expected starting with the 25-year event.Broadway Avenue (Basin 615125) - Overtopping <strong>of</strong> the roadway is expected starting with the100-year event.Columbus Drive (Basin 615150) - Overtopping <strong>of</strong> the roadway is expected starting with the 10-year event.Woodberry Area (Basins 615370, 615375) - Overtopping <strong>of</strong> the roadway is expected startingwith the 10-year event. Maintenance personnel cited frequent flooding problems in this area.Site Flooding during the 25-year event: LOS ASabal Park Area (Basin 615125) - Site flooding in this area beginning with the 50-year event.* Lakewood Drive Area (Basin 615250) - Site flooding in this area beginning with the 50-yearevent.* Woodberry Area (Basin 615370) - Site flooding in this area beginning with the 50-year event.* CSX Railroad Area (Basins 615425, 615450) - Site flooding in this area beginning with the 50-year event.6-23 <strong>Hillsborough</strong> River <strong>Water</strong>shed Management Plan
EXISTING CONDITIONS LEVEL OF SERVICEStructure Flooding during the 25-year event: LOS A* CSX Railroad Area (Basins 615425, 615450) - Structure flooding in this area beginning withthe 100-year event.Maintenance personnel cited house flooding during El-Nino in the areas <strong>of</strong> Marianne Lane,Windhorst Road, and Cottageside Court all in the vicinity <strong>of</strong> Lakewood Drive and WoodberryRoad.* Areas noted have sinkholes. Actual flooding depths may vary.Vandenberg (LOS C)The Vandenberg subwatershed lies within <strong>Hillsborough</strong> <strong>County</strong> and discharges to the <strong>Tampa</strong>Bypass Canal. It is bounded to the north by the depressions area, to the east and south by theWilliams <strong>Water</strong>shed, and to the west by the <strong>Tampa</strong> Bypass Canal, field surveys and SWFWMDtopographic maps were used to develop the model for this subwatershed. The drainage area forthis subwatershed is approximately 1,300 acres or approximately 2.0 square miles.Roadway Flooding: LOS BWilliams Road (Basin 617880). Overtopping <strong>of</strong> the roadway is expected starting with the 50-year event.Dirt Farm Road (Basin 617960). Overtopping <strong>of</strong> the roadway is expected starting with the 50-year event.Williams Road (Basin 617980). Overtopping <strong>of</strong> the roadway is expected starting with the 10-year event.Site Flooding during the 25-year event: LOS AModeling results do not indicate any site flooding within the modeled portion <strong>of</strong> the Vandenbergsubwatershed.Structure Flooding during the 25-year event: LOS AModeling results do not indicate any structure flooding within the modeled portion <strong>of</strong> theVandenberg subwatershed.6-24 <strong>Hillsborough</strong> River <strong>Water</strong>shed Management Plan
CHAPTER 6Williams Area (LOS D)The headwaters <strong>of</strong> the Williams subwatershed are located in wetlands to the east <strong>of</strong> Williams Rd.The discharge from this subwatershed enters the <strong>Tampa</strong> Bypass Canal upstream <strong>of</strong> S-162. It isbounded to the north by the Vandenburg and depression areas, to the south by the Mango<strong>Water</strong>shed, and to the west by the <strong>Tampa</strong> Bypass Canal. The drainage area for this subwatershedis approximately 1,300 acres or approximately 2.0 square miles.Roadway Flooding: LOS CPrivate Driveway (Basin 616150) - Overtopping <strong>of</strong> this driveway is expected starting with the 5-year event.Private Driveway (Basin 616175) - Overtopping <strong>of</strong> this driveway is expected starting with the50-year event.* Mango Road (Basin 616275): Overtopping <strong>of</strong> this road is expected starting with the 5-yearevent.Virginia Lane (Basins 616425, 616450) - Overtopping <strong>of</strong> this roadway is expected starting withthe 100-year event.Falkenburg Road (Basin 617110) - Overtopping <strong>of</strong> the roadway is expected starting with the10-year event.Tanner Road (Basin 617350) - Overtopping <strong>of</strong> the roadway is expected starting with the 2.33-year event.Maintenance personnel cited possible problem at Tanner Road. Flooding was experiencedDuring El Nino.Site Flooding during the 25-year event: LOS CFalkenburg Road Area (Basin 616075) - Rural site flooding in this area beginning with the 50-year event.Private Drive Area (Basin 616175) - Site flooding in this area beginning with the 50-year event.* Mango Road Area (Basin 616300) - Site flooding in this area beginning with the 5-year event.Virginia Lane Area (Basins 616450, 616475) - Site flooding in this area beginning with the 25-year event. Maintenance personnel cited frequent problems in this area.6-25 <strong>Hillsborough</strong> River <strong>Water</strong>shed Management Plan
EXISTING CONDITIONS LEVEL OF SERVICESligh Avenue Area (Basin 617010) - Site flooding in this area beginning with the 10-year event.Falkenburg Road Area (Basin 617110) - Site flooding in this area beginning with the 2.33-yearevent.Tanner Road Area (Basin 617350) - Site flooding in this area beginning with the 5-year event.Maintenance personnel cited El Nino flooding in this area.* These areas contain sinkholes.Structure Flooding during the 25-year event: LOS DPrivate Drive Area (Basin 616175) - Structure flooding in this area beginning with the 50-yearevent.* Mango Road Area (Basin 616300) - Structure flooding in this area beginning with the 50-yearevent.Sligh Avenue Area (Basin 617010) - Structure flooding in this area beginning with the 25-yearevent.Falkenburg/Sligh Area (Basin 617110) - Structure flooding in this area beginning with the 50-year event.* These areas contain sinkholes.Falkenburg Area (LOS D)The Falkenberg Road subwatershed is at the most southerly extent <strong>of</strong> the <strong>Hillsborough</strong> Riverwatershed, north <strong>of</strong> the Mango subwatershed and west <strong>of</strong> the <strong>Tampa</strong> Bypass Canal. Thewatershed discharges into the <strong>Tampa</strong> Bypass Canal. It is approximately 3.5 square miles <strong>of</strong> mixedcommercial, low-density residential and agricultural lands.Roadway Flooding: LOS CFish Hatchery Access Road Crossing (Basins 612125, 612450) - Overtopping <strong>of</strong> this dirtaccess road for a fish hatchery is expected starting with the 2.33-year and 5-year events forBasins 612450 and 612125 respectively.Falkenberg Road Crossing (Basins 612185), Overtopping <strong>of</strong> this roadway is expected startingwith the 10-year event.6-26 <strong>Hillsborough</strong> River <strong>Water</strong>shed Management Plan
CHAPTER 6Site Flooding during the 25-year event: LOS CFalkenberg Road Area (Basin 612185) - Commercial site flooding between Falkenberg Roadand Lopez Lane beginning with the 2.33-year event.Structure Flooding during the 25-year event: LOS DFalkenberg Road Area (Basin 612185) - Commercial structure flooding between FalkenbergRoad and Lopez Lane beginning with the 10-year event.Table 6.4.6 contains the regional basin numbers and their calculated LOS. For LOS results worsethan A, the corresponding elevation identifying the problem area is provided. Figure 6.4.6 depictsthe region’s LOS in graphical form.6-27 <strong>Hillsborough</strong> River <strong>Water</strong>shed Management Plan
Blackwater CreekSub-<strong>Water</strong>shedTable 6.4.2 Existing Conditions Level <strong>of</strong> ServiceBlackwater Creek RegionBasin LOS Identifying Elevation 25 Year Existing LevelNumber Roadway Site Structure <strong>Water</strong> Surface <strong>of</strong> Service680000 48.05 A680050 51.93 A680100 58.04 A680150 63.03 A680200 65.07 A680250 65.40 A680300 65.92 A680350 78.54 A680400 78.40 78.85 B680450 80.42 A680500 82.37 A680520 82.79 A680550 86.55 A680600 87.34 A680650 90.69 A680700 93.63 A680750 94.02 A680800 100.77 A680860 104.51 A680925 106.48 A680955 107.10 107.77 C680970 109.69 A681000 83.54 A681100 86.30 A681500 86.18 AAyres Associates Page 1 <strong>of</strong> 3 <strong>Hillsborough</strong> River <strong>Water</strong>shed Management Plan
Sub-<strong>Water</strong>shedItcehpackesassa CreekTable 6.4.2 Existing Conditions Level <strong>of</strong> ServiceBlackwater Creek RegionBasin LOS Identifying Elevation 25 Year Existing LevelNumber Roadway Site Structure <strong>Water</strong> Surface <strong>of</strong> Service684000 90.43 A684030 92.25 A684055 95.94 A684085 97.79 A684100 98.09 A684150 103.00 A684180 104.13 A684200 106.39 A684210 107.20 A684260 110.95 A684280 111.43 A684510 101.90 102.18 B684515 102.63 A684525 104.00 104.44 B684550 105.49 A685010 108.76 A685020 110.30 A685050 110.39 A685500 111.43 A685520 111.43 A685521 111.43 A685525 111.49 A685550 116.30 A685575 116.56 A685600 116.70 A685800 114.19 A685900 110.97 AAyres Associates Page 2 <strong>of</strong> 3 <strong>Hillsborough</strong> River <strong>Water</strong>shed Management Plan
East CanalTiger CreekSub-<strong>Water</strong>shedTable 6.4.2 Existing Conditions Level <strong>of</strong> ServiceBlackwater Creek RegionBasin LOS Identifying Elevation 25 Year Existing LevelNumber Roadway Site Structure <strong>Water</strong> Surface <strong>of</strong> Service686045 100.28 101.10 C686046 102.87 C686047 103.15 C686048 103.15 A686049 105.37 A686100 100.28 101.36 C686175 101.41 A686250 102.26 A686400 102.37 A686410 102.64 A686430 102.76 A686440 102.81 A686460 104 104.01 D686470 104.01 A686480 104.01 A686570 103.4 104.60 C686571 111.48 A686620 113 113.44 D687000 101.41 A687010 103.02 A687050 103.75 A687150 105.82 A687190 105.83 A687210 106.47 A682050 87.47 A682051 87.56 A682100 88.24 A682150 89.26 A682200 89.77 A682250 93.34 A682300 94.86 A682350 95.23 A682400 97.33 A682450 99.06 A682500 100.10 A682600 100.28 A682650 101.32 A682700 102.14 A683000 94.06 A683200 95.07 A683300 95.35 A683500 99.99 A683600 101.24 AAyres Associates Page 3 <strong>of</strong> 3 <strong>Hillsborough</strong> River <strong>Water</strong>shed Management Plan
NWESN.T.S.LegendArea Outside Limits<strong>of</strong> Detailed StudyLevels <strong>of</strong> ServiceABCD<strong>Hillsborough</strong> River <strong>Water</strong>shed Management PlanLevels <strong>of</strong> Service for the Blackwater Creek RegionFigure6.4.2
Clay Gully EastSub-<strong>Water</strong>shedTable 6.4.3 Existing Conditions Level <strong>of</strong> ServiceCentral Tributaries RegionBasin LOS Identifying Elevation 25 YearNumber Roadway Site Structure <strong>Water</strong> Surface660000 43.38660100 46.75 48.58660200 48.30660300 47.50 49.26660400 56.99 58.21660500 60.00 60.88660600 66.86660650 70.77660700 73.20 73.82660800 72.12660840 73.50 73.89660850 75.03 75.93660860 77.50 77.88660900 67.21660950 72.20660985 73.75 74.06660990 74.00660995 75.00 76.05661000 46.77 48.47661100 48.20 48.53661200 48.06 48.92661300 48.89661400 49.13 49.61661500 50.00 50.35662000 47.99 48.95662100 49.03662150 55.39662160 56.03662200 61.48662300 65.60662350 59.40 60.02662400 67.51 68.58662500 53.01 55.36662700 64.50 63.76663000 46.75 48.69663100 49.50663200 55.51663300 59.12663400 62.84663401 50.06663410 50.50663500 54.80 55.40663600 54.80 55.40663700 58.83663800 57.75 58.20664000 59.87 60.17Ayres Associates Page 1 <strong>of</strong> 8 <strong>Hillsborough</strong> River <strong>Water</strong>shed Management Plan
Two Hole BranchSub-<strong>Water</strong>shedTable 6.4.3 Existing Conditions Level <strong>of</strong> ServiceCentral Tributaries RegionBasin LOS Identifying Elevation 25 YearNumber Roadway Site Structure <strong>Water</strong> Surface665050 45.40665130 55.38665200 61.33665300 64.55665400 66.12665500 69.87665600 73.31665750 76.80 77.35665800 76.80 77.44665830 83.99665850 83.60 84.65665900 85.94665925 85.43 85.99665950 89.81665960 93.33665970 95.80 96.22665980 95.80 96.27665990 101.15665995 97.62666000 50.49667000 71.38667100 72.13667150 74.94667200 74.95667300 74.96667400 74.50 75.13667500 75.54667600 76.85667700 77.41667800 78.21667900 80.73 81.81667920 83.54 84.02667925 86.51667930 92.54667935 87.13667940 93.37667950 96.66667960 97.47668000 72.38669000 81.06Ayres Associates Page 2 <strong>of</strong> 8 <strong>Hillsborough</strong> River <strong>Water</strong>shed Management Plan
Hollomans BranchSub-<strong>Water</strong>shedTable 6.4.3 Existing Conditions Level <strong>of</strong> ServiceCentral Tributaries RegionBasin LOS Identifying Elevation 25 YearNumber Roadway Site Structure <strong>Water</strong> Surface650010 35.72650050 39.89650105 43.05650115 44.86650120 43.23650135 45.00 45.95650150 45.60 46.87650200 51.03650250 54.00 54.68650300 53.00 54.85650350 59.69650360 61.40 62.11650400 65.50 66.17650460 64.42 65.10650510 70.73650550 71.80 72.11650600 75.80 76.29650650 82.00 82.73650700 86.62650800 86.70 88.09650850 91.20650910 94.11650950 95.25650955 97.65650970 105.23650982 101.56650985 102.15650987 42.30 46.02652000 44.80 46.36652001 44.80 46.36652110 45.50 46.33652120 46.37652130 47.00652200 50.53652210 56.00 56.69652300 52.98652400 57.00 57.77653050 60.80 60.85653075 61.44653076 59.98 61.40653080 57.90 58.86653150 59.36 60.10653200 60.99653250 68.89653300 63.00 65.16653301 69.80653355 70.93653370 70.00 70.07653380 71.03 71.41653385 72.60 73.11Ayres Associates Page 3 <strong>of</strong> 8 <strong>Hillsborough</strong> River <strong>Water</strong>shed Management Plan
Sub-<strong>Water</strong>shedTable 6.4.3 Existing Conditions Level <strong>of</strong> ServiceCentral Tributaries RegionBasin LOS Identifying Elevation 25 YearNumber Roadway Site Structure <strong>Water</strong> Surface653399 69.12653400 71.92653450 74.81653500 75.76653550 80.08653599 81.39653600 85.61653650 67.00 67.44654000 70.29654050 71.93 72.73654105 76.96 77.50654110 76.96 77.90654150 78.80 79.88654220 83.00 83.01654250 85.30 85.99654290 87.80 89.43654310 89.00 89.48654350 86.28654355 91.00 91.99654400 95.00 95.55654420 96.00 96.47654450 70.99655025 72.00 72.72655026 73.50 73.57655100 75.50 76.05655240 75.50 76.12655300 70.70Ayres Associates Page 4 <strong>of</strong> 8 <strong>Hillsborough</strong> River <strong>Water</strong>shed Management Plan
Existing Level<strong>of</strong> ServiceACACCCAADABCBAABABCDCACBCAAAAACCCACAAAAAACCABBAyres Associates Page 5 <strong>of</strong> 8 <strong>Hillsborough</strong> River <strong>Water</strong>shed Management Plan
Existing Level<strong>of</strong> ServiceAAAAAAACCACACAABBAAAAAAAACAAAACBAAAAAAAAAyres Associates Page 6 <strong>of</strong> 8 <strong>Hillsborough</strong> River <strong>Water</strong>shed Management Plan
Existing Level<strong>of</strong> ServiceAAAAACDACDACCCADCDACAAAAAAACDDCAAACADDACCCAADAADBCAyres Associates Page 7 <strong>of</strong> 8 <strong>Hillsborough</strong> River <strong>Water</strong>shed Management Plan
Existing Level<strong>of</strong> ServiceAAAAAAABACCCCDCCDADCBACDCCAAyres Associates Page 8 <strong>of</strong> 8 <strong>Hillsborough</strong> River <strong>Water</strong>shed Management Plan
NWESN.T.S.LegendArea Legend Legend Outside LimitsArea <strong>of</strong>AreaOutside DetailedOutsideLimits StudyLimitsLevels <strong>of</strong> Detailed Service Study<strong>of</strong> Detailed StudyLevels AA <strong>of</strong> ServiceB BAC CBD CDDLevels <strong>of</strong> Service<strong>Hillsborough</strong> River <strong>Water</strong>shed Management PlanLevels <strong>of</strong> Service for the Central Tributaries RegionFigure6.4.3
Sub-<strong>Water</strong>shedNew RiverBasset BranchClay Gully WestTrout CreekTable 6.4.4 Existing Conditions Level <strong>of</strong> ServiceNorthwest Tributaries RegionBasin LOS Identifying Elevation 25 Year Existing LevelNumber Roadway Site Structure <strong>Water</strong> Surface <strong>of</strong> Service673000 45.75 A673050 49.75 A673100 56.00 56.68 D673150 65.16 A673200 69.68 70.54 C673250 85.40 A673275 85.46 A674000 53.22 A674050 53.71 A674100 60.46 A674150 61.71 A674200 66.37 A674250 72.14 A674300 73.21 A675000 54.34 A675100 56.96 A675200 66.90 67.51 C675300 70.76 A675500 69.47 A670000 47.15 A670100 47.00 47.14 D670150 51.54 A670151 56.81 A670250 57.23 A670350 62.76 A670500 63.51 A670550 63.88 A670600 68.19 A671100 48.00 48.26 B671125 53.62 A671150 55.85 A671200 49.18 A671250 55.87 A671300 56.02 A671400 63.09 63.50 B671500 62.93 64.06 C672100 65.93 A635050 36.22 A635100 38.61 39.20 C635200 39.33 39.62 B635300 39.33 40.19 C635400 42.19 A635500 48.58 A635600 50.97 A635700 55.49 55.60 D635800 55.62 A635900 55.64 A636000 58.46 A637000 57.51 A637100 60.16 AAyres Associates Page 1 <strong>of</strong> 2 <strong>Hillsborough</strong> River <strong>Water</strong>shed Management Plan
Sub-<strong>Water</strong>shedTable 6.4.4 Existing Conditions Level <strong>of</strong> ServiceNorthwest Tributaries RegionBasin LOS Identifying Elevation 25 Year Existing LevelNumber Roadway Site Structure <strong>Water</strong> Surface <strong>of</strong> Service630000 33.53 A630025 34.73 A630050 36.54 A630070 39.16 A630100 41.29 A630125 42.75 A630150 43.53 A630175 46.01 A630200 46.98 A630225 48.19 A630275 49.13 A630285 49.13 A632000 42.28 A632050 42.97 A632500 44.10 44.41 B632550 44.72 A632600 45.27 A632650 44.81 A632750 44.71 A632800 44.39 A632850 44.49 A633000 44.49 A633050 52.62 A633100 56.34 A633150 56.26 A633500 49.98 A633550 50.33 A634000 50.83 A634100 50.84 AAyres Associates Page 2 <strong>of</strong> 2 <strong>Hillsborough</strong> River <strong>Water</strong>shed Management Plan
NWESN.T.S.LegendArea Outside Limits<strong>of</strong> Detailed StudyLevels <strong>of</strong> ServiceABCD<strong>Hillsborough</strong> River <strong>Water</strong>shed Management PlanLevels <strong>of</strong> Service for the Northwestern Tributaries RegionFigure6.4.4
Sub-<strong>Water</strong>shed<strong>Hillsborough</strong> RiverTable 6.4.5 Existing Conditions Level <strong>of</strong> Service<strong>Hillsborough</strong> River RegionBasin LOS Identifying Elevation 25 Year Existing LevelNumber Roadway Site Structure <strong>Water</strong> Surface <strong>of</strong> Service600050 22.60 A600100 44.81 A600150 22.69 A600151 22.69 A600200 22.67 A600400 22.70 A600450 22.78 A600550 22.78 A600750 22.86 A600900 22.91 A601250 23.68 A601300 23.68 A601650 27.96 A601700 27.72 A602150 50.31 A602550 32.66 A602600 28.09 A605100 32.66 A605200 32.78 A605600 34.72 A605750 40.57 A605850 40.57 A605900 46.81 A605950 45.75 A606050 47.08 A606250 47.65 A606450 51.81 A606600 54.81 A610800 31.73 A619000 28.03 A619100 31.75 A619300 31.97 A619400 32.33 A619500 32.61 A638050 45.53 A638100 61.85 A638200 63.28 A639010 44.40 44.90 D639050 45.00 45.81 C639100 44.80 45.75 C639150 46.11 A639200 47.03 AAyres Associates Page 1 <strong>of</strong> 1 <strong>Hillsborough</strong> River <strong>Water</strong>shed Management Plan
NWESN.T.S.LegendLevels <strong>of</strong> ServiceAArea Outside Limits <strong>of</strong> Detailed Study<strong>Hillsborough</strong> River <strong>Water</strong>shed Management PlanLevels <strong>of</strong> Service for the <strong>Hillsborough</strong> River RegionFigure6.4.5
FalkenburgVandenburgWilliamsSub-<strong>Water</strong>shedTable 6.4.6 Existing Conditions Level <strong>of</strong> ServiceTBC and Tributaries RegionBasin Landmark Elevations 25 YearNumber Roadway Site Structure <strong>Water</strong> Surface612010 12.03612025 15.30612050 16.88612075 17.57612100 18.33612125 28.57612150 32.63612185 37.70 38.30612200 42.89612220 43.27612250 43.31612310 23.69612325 25.89612450 28.00 28.84613000 2.50615395 N/A*617500 N/A**617750 19.42617820 15.86617840 N/A*617850 27.15617860 16.37617880 24.88617920 19.63617940 20.33617960 24.62617980 26.18 26.45616000 15.62616025 17.51616050 17.83616075 17.88616100 18.46616125 18.48616126 N/A**616150 20.20 20.71616175 22.55616200 22.55616225 22.56616250 22.64616275 38.53616300 64.50 65.23616400 18.68616425 18.68616450 19.60616475 18.78616480 18.78616485 31.59616488 31.59616490 60.67616495 73.71616500 25.99616525 35.42616550 40.22617010 20.00 20.05617075 17.50 18.06617110 20.50 21.91617128 24.46617200 21.54Ayres Associates Page 1 <strong>of</strong> 6 <strong>Hillsborough</strong> River <strong>Water</strong>shed Management Plan
MangoSub-<strong>Water</strong>shedTable 6.4.6 Existing Conditions Level <strong>of</strong> ServiceTBC and Tributaries RegionBasin Landmark Elevations 25 YearNumber Roadway Site Structure <strong>Water</strong> Surface617225 22.37617250 24.28617275 23.95617300 23.33617325 34.00617350 52.80 53.19617400 25.77617425 26.18617450 18.48617475 18.79614000 16.42614025 17.26614030 22.16614050 30.48614075 25.06614100 26.26614125 31.86614150 27.70614170 29.29614175 30.15614200 30.83614225 31.05614250 32.56614275 33.47614300 32.66614325 32.71614350 33.50 33.92614360 32.86614375 35.53614400 34.05614425 32.84614450 32.84614475 N/A*614480 N/A*614500 35.64614525 40.05614725 N/A*614730 N/A*614775 N/A*615010 17.74615025 22.19615110 32.97615120 33.60615130 35.91615140 38.32615150 39.51 40.28615200 30.67615225 31.77615250 38.91615275 33.16615300 36.94615310 48.56615345 32.89615350 34.10615360 N/A*615365 N/A*615370 35.46 36.18615375 35.65615380 35.65615385 36.26Ayres Associates Page 2 <strong>of</strong> 6 <strong>Hillsborough</strong> River <strong>Water</strong>shed Management Plan
Table 6.4.6 Existing Conditions Level <strong>of</strong> ServiceTBC and Tributaries RegionSub-<strong>Water</strong>shedBasin Landmark Elevations 25 YearNumber Roadway Site Structure <strong>Water</strong> Surface615400 40.06615425 40.78615450 40.91615475 54.24615500 44.33615610 N/A*615650 N/A*615660 N/A*615665 N/A*615670 N/A*615675 N/A*615680 N/A*615690 N/A*Depressions618025 N/A*618050 N/A*618075 N/A*618100 N/A*618125 N/A*618150 N/A*618175 37.70 41.60618185 N/A*618200 N/A*618225 N/A*618250 N/A*618275 N/A*618300 N/A*618325 N/A*<strong>Tampa</strong> Bypass Canal610000 2.50610100 5.84610200 16.91610300 17.37610400 17.42610500 17.45610600 19.08610650 25.55610700 31.45610725 34.02610750 31.64611100 17.60618000 35.52N/A* Internally Drained - <strong>Water</strong> Surface Elevation Not Predicted.N/A** No Conveyance Established - <strong>Water</strong> Surface Elevation Not Predicted.Ayres Associates Page 3 <strong>of</strong> 6 <strong>Hillsborough</strong> River <strong>Water</strong>shed Management Plan
Existing Level<strong>of</strong> ServiceAAAAAAADAAAAACAAAAAAAAAAAABAAAAAAACAAAAACAAAAAAAAAAAADCCAAAyres Associates Page 4 <strong>of</strong> 6 <strong>Hillsborough</strong> River <strong>Water</strong>shed Management Plan
Existing Level<strong>of</strong> ServiceAAAAABAAAAAAAAAAAAAAAAAAAABAAAAAAAAAAAAAAAAAACAAAAAAAAAACAAAAyres Associates Page 5 <strong>of</strong> 6 <strong>Hillsborough</strong> River <strong>Water</strong>shed Management Plan
Existing Level<strong>of</strong> ServiceAAAAAAAAAAAAAAAAAAACAAAAAAAAAAAAAAAAAAAAAyres Associates Page 6 <strong>of</strong> 6 <strong>Hillsborough</strong> River <strong>Water</strong>shed Management Plan
NWESLegendArea Outside Limits<strong>of</strong> Detailed StudyLevels <strong>of</strong> ServiceABCDN.T.S.<strong>Hillsborough</strong> River <strong>Water</strong>shed Management PlanLevels <strong>of</strong> Service for the TBC and Tributaries RegionFigure6.4.5 6.4.6