Edelweiss Fund Insight: March 2010
Edelweiss Fund Insight: March 2010
Edelweiss Fund Insight: March 2010
- No tags were found...

You also want an ePaper? Increase the reach of your titles
YUMPU automatically turns print PDFs into web optimized ePapers that Google loves.
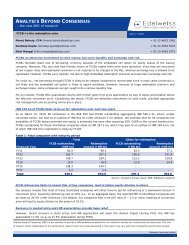
Strictly Private and Confidential<strong>Edelweiss</strong> <strong>Fund</strong> <strong>Insight</strong>: <strong>March</strong> <strong>2010</strong>Yogesh Radke+91-22-6620 3199yogesh.radke@edelcap.comSriram Velayudhan+91-22-6620 3100sriram.velayudhan@edelcap.comFebruary Retrospective
Key highlightsTotal AUM at INR 7.65 tn; assets worth INR 82 bn added in February.Equity AUM at INR 2 tn; increased by INR 8 bn (up 0.40%) M-o-M.Debt AUM at INR 5.65 tn; increased by INR 74 bn (up 1.32%) M-o-M.Inflows of INR 18.50 bn in mutual funds (net of NFOs + existing schemes – redemptions) in February.There were no NFOs in equity schemes in February.<strong>Fund</strong> flow in existing schemes was INR 54.86 bn.Amount redeemed for the month stood at INR 36.36 bn.Mutual funds were net sellers of INR 7.2 bn in equities.The ratio of large-cap AUMs to mid-cap AUMs reduced to 0.79 from 0.80 last month.Large-cap funds increased exposure to banking, oil & gas, engineering, auto and pharmaceuticals andreduced it in IT, telecom, FMCG, metals and cements.Mid-cap funds increased exposure to FMCG, banking, pharmaceuticals, metals and oil & gas and reduced itin engineering, IT, telecom and auto.DB Realty, Cairn India, Bajaj Holding & Investments, LIC Housing Finance and Mphasis were some stocksthat evinced buying interest from funds during the month.Total cash balances across AMCs is currently ~INR 123 bn (~6.70% of the total corpus).Data Sources: AMFI, ACE MF and <strong>Edelweiss</strong> research3
4Trend in AUM
Total AUM moves upwardsEquity AUM, at INR 2 tn, accounted for ~26% ofE it t f t t l tthe total AUM. It increased by ~INR 8 bn over theprevious month. Inflows into the existing schemesaided the rise in equity AUM.Overhang of the impending budget made equitymarkets tardy in February, impacting freshallocations.Debt AUM added assets worth ~INR 74 bn duringthe month. It currently stands at ~INR 5.65 tn.Advance tax outflows, slated to happen in <strong>March</strong>,couldimpactdebtAUMintheformofredemptions.Similarly, cues relating to rate hikes will be anotherkey trigger going forward.INR bn9,5008,5007,5006500 6,5005,5004,5003,5002,500Equity as a percentage of total assetsTotal AssetsAUM classificationMar- -09Apr- -09May- -09Jun- -09Jul- -09Aug- -09Sep- -09Oct- -09Nov- -09Dec- -09Jan- -10Feb- -10Equity as % of Total Assets4236302418(%)Total AUM stands at INR 7.65 tn. It increased by~82 bn over the previous month (~1% M-o-M).Ratio of large-cap AUMs to mid-cap AUMs, droppedto ~0.79 in February from ~0.80 levels in January,indicating a gradual shift in allocation towards midcaps.124145Sep/0 091084 1038 1096992747 753142 152159 162119157127 122 127 128Oct/0 09Nov/0 09Dec/0 09Jan/1 10Feb/1 101400120010008006004002000INR bnNote: Large-cap, mid-cap and diversified fund universe comprises 129 equity schemes (growth option)5Large Cap Equity <strong>Fund</strong>s Mid Cap Equity <strong>Fund</strong>s Diversified <strong>Fund</strong>s
<strong>Fund</strong> flows remain positive for the second consecutive monthAfter turning positive last month, flows into equityschemes stayed green in February as well.Redemptions in equity schemes have come downsignificantly.2,040Components of equity AUM change18.50 (10.50)Mutual funds saw an inflow of INR 18.50 bn (net ofNFOs + existing schemes – redemptions) inFebruary.INR bn2,0002,0082,016Redemptions were at INR 36.36 bn during themonth against INR 71 bn in January.Equity AUM rose by ~INR 8 bn in February. Of thecomponents of equity AUM change, net flows wereat INR 18.50 bn (inflow), while capital under Equity NFOsinvestment fell by ~INR 10.50 bn.After a rather active January, NFOs remaineddormant in February.61,960AUM as on 31-Jan-10(INR bn)Net InflowTotalamountCapitalAppreciationNo ofissuesJan-10 15.90 3Dec-09 0.01 1Nov-09 2.30 1Oct-09 0.00 0Sep-09 9.12 6Aug-09 0.82 3Jul-09 23.94 2Jun-09 0.00 1May-09 8.13 2Apr-09 0.04 1Mar-09 0.50 1Feb-09 0.02 1Jan-09 0.04 2Source: AMFIAUM as on 26-Feb-10
<strong>Fund</strong>-wise AUMTotal AUM in INR bn%Ch ChangeRankEquity AUM in INR bn%Ch ChangeRank<strong>Fund</strong> House Feb-10 Jan-10 M-o-M Change<strong>Fund</strong> House Feb-10 Jan-10 M-o-M ChangeReliance 1,158 1,172 -1 Reliance 331 327 1 HDFC 951 948 0 HDFC 253 246 3 ICICI Pru 805 784 3 UTI 228 230 -1 UTI 793 745 6 SBI 172 178 -3 Birla SL 663 626 6 Franklin Templeton 133 131 2 LIC 465 474 -2 ICICI Pru 132 138 -4 Kotak 405 369 10 DSP BR 102 102 0 SBI 361 366 -2 Birla SL 98 99 -1 Franklin Templeton 340 330 3 Sundaram BNPP 89 91 -2 IDFC 266 248 7 Tata 50 50 0 Others 1,477 1,347 10 Others 233 230 1Note: Total Corpus include Equity, Debt, GILT, Balanced, Liquid & other <strong>Fund</strong>s 1,820 1,8227,683 7,410Debt AUM in INR bn % Change RankGilt AUM in INR bn % Change Rank<strong>Fund</strong> House Feb-10 Jan-10 M-o-M Change<strong>Fund</strong> House Feb-10 Jan-10 M-o-M ChangeReliance 710 629 13 UTI 10 10 -7 HDFC 486 500 -3 HDFC 7 9 -19 UTI 476 436 9 ICICI Pru 7 18 -60 ICICI Pru 472 552 -14 Reliance 6 9 -41 Birla SL 408 362 13 SBI 4 4 9 LIC 314 299 5 Tata 2 2 6 Kotak 296 287 3 LIC 2 2 -1 IDFC 222 196 13 Birla SL 2 9 -80 Franklin Templeton 168 170 -1 IDFC 2 2 5 SBI 141 153 -8 Kotak 1 1 -20 Others 785 851 -8 Others 4 5 -21 Rank Unchanged Rank Improved Rank Declined 46 71 Sources: ACE MFNote:• Ranks are assigned on the descending order of AUM & change in rank is over the previous month.• AUM stated above are the average figures for the month7
<strong>Fund</strong> performanceBenchmark IndexM-o-MChange(%)BSE 200 0.34<strong>Fund</strong> performance: Equity schemesScheme NameM-o-MM-o-MAUM-Feb-AUM-Feb-Change inScheme NameChange in10(INR bn)10(INR bn)NAV(%)NAV(%)Reliance Growth 68.38 -0.18 Reliance Equity Oppor 18.72 0.96HDFC Top 200 64.85 1.02 UTI Equity 18.19 -0.22HDFC Equity 56.32 0.99 SBI Infrastructure-I 18.17 -0.91Reliance Diver Power Sector 54.53 -0.57 Birla SL Frontline Equity-A 17.96 -0.07SBI Magnum TaxGain'93 52.97 -0.10 010 UTI Dividend Yield 17.94 167 1.67ICICI Pru Infrastructure 39.13 -1.05 Reliance Long Term Equity 17.81 -0.49Reliance Natural Resources 38.92 -0.92 Sundaram BNPP Energy Oppor 17.77 -1.40Reliance Vision 36.82 0.20 DSPBR Equity 17.48 -1.20SBI Magnum Contra 33.01 -1.43 UTI Infrastructure 16.79 -0.88DSPBR India T.I.G.E.R-Reg 32.11 -0.62 Franklin India Prima Plus 16.72 0.62Franklin India Bluechip 27.71 1.27 Reliance Equity Adv 15.22 0.65DSPBR Top 100 Equity 25.33 0.37 HDFC Infrastructure 14.64 -0.82UTI Infrastructure Adv-1 24.83 -1.25 Birla SL Midcap-A 14.06 -1.88UTI Mastershare 22.75 1.33 HSBC Equity 13.79 0.96Reliance Reg Savings-Equity 22.59 -0.59 IDFC Premier Equity-A 13.57 -0.91Franklin India Flexi Cap 22.25 -0.21 DSPBR World Gold-Reg 13.16 2.04HDFC TaxSaver 22.02 0.84 UTI Oppor 12.93 0.88Tata Infrastructure 21.89 -0.87 HDFC Growth 12.33 -0.71Reliance Tax Saver (ELSS) 20.73 -0.31 UTI MEPUS 12.20 0.29Reliance Equity 20.70 -0.69 Birla SL Tax Relief '96 12.20 0.56Reliance Infrastructure 20.24 0.60 Sundaram BNPP Tax Saver 12.20 -15.66ICICI Pru Dynamic 19.29 032 0.32 SBI Magnum Global'94 12.1919 -0.03 003Sundaram BNPP Select Midcap 19.17 -1.05 Sundaram BNPP Select Focus 12.14 -1.01Morgan Stanley Growth 18.95 0.95 HDFC Mid-Cap Oppor 12.06 0.89Source :ACE MF, <strong>Edelweiss</strong> researchNote: Sorted in the descending order of AUM
9MF Equity Flows
Mutual funds: Net sellers for the monthMutual funds were net sellers of INR 7.2 bn in February.Mutual funds have been net sellers of ~INR 117 bn in the past six months.Daily FlowsMonthly Flows125000 5,000405,500(INR bn)04,9004,800(INR bn)200(20)(40)5,0004,5004,0003,5003000 3,000(12)1 Feb3 Feb5 Feb9 Feb11 Feb16 Feb18 Feb22 Feb24 Feb26 Feb4,700(60)Mar-09Apr-09May-09Jun-09Jul-09Aug-09Sep-09Oct-09Nov-09Dec-09Jan-10Feb-102,500Net Buy/SellS&P NiftyEquity FlowsS&P Nifty10
11Cash Levels
AMC-wise cash levels: Equity schemesINR bnAMCAUMEquityallocationCashholdingOtherinstrumentsCash as a% of AUM AMC AUMEquityallocationCashholdingOtherinstrumentsCash as a% of AUMReliance MF 352.16 322.97 27.01 2.19 7.67 Kotak MF 31.20 27.46 1.39 2.35 4.45HDFC MF 217.07 206.09 10.89 0.10 5.02 Principal Pnb MF 21.28 20.28 1.00 (0.00) 4.69UTI MF 206.27 188.77 16.75 0.75 8.12 Morgan Stanley MF 20.76 20.36 0.40 0.00 1.94SBI MF 178.07 164.97 12.17 0.94 6.83 JM MF 17.16 16.20 0.68 0.29 3.97ICICI Pru MF 137.44 121.48 15.61 035 0.35 11.36 LIC MF 11.20 10.76 044 0.44 000 0.00 395 3.95Franklin Templeton MF 130.78 125.41 5.25 0.12 4.01 JP Morgan MF 9.28 8.36 0.33 0.59 3.58DSP BR MF 123.67 97.29 5.69 20.69 4.60 Canara Robeco MF 9.10 8.51 0.38 0.21 4.15Birla SL MF 98.70 91.46 5.66 1.57 5.74 Axis MF 8.74 6.59 0.84 1.32 9.56Sundaram BNPP MF 95.49 87.85 6.41 1.23 6.71 Benchmark MF 8.69 8.66 0.02 0.00 0.29Tata MF 49.09 47.06 2.07 (0.05) 4.23 AIG MF 8.16 5.19 0.87 2.10 10.63IDFC MF 35.35 30.49 3.96 0.90 11.19 ING MF 6.16 3.56 0.28 2.32 4.50HSBC MF 31.45 28.31 2.28 0.86 7.26 Religare MF 5.66 5.00 0.54 0.12 9.50Source : ACE MF, <strong>Edelweiss</strong> researchNote: The data is sorted in descending order of AUM (Asset under management). AUM for each fund house is the total AUM of equity schemes (Growth) at the end of the month.Total cash balances across AMCs is currently ~INR 123 bn (~6.70% of the total corpus).12
Large-cap funds: Cash balances move downAbsolute cash balances with the large-cap fundsreduced by ~INR 1.7 bn over the previous month;currently at ~INR 7.95 bn against ~INR 9.68 bn inJanuary.With redemptions remaining muted, the decline in cashbalances can be attributed to fresh allocations that weremade during the month. Large-cap funds haveincreased their exposure considerably in the bankingspace over the previous month.Absolute cash balances account for ~6.2% of the totalcorpus of INR 128.50 bn.INR bn14121086Absolute cash balances and percentage cash221215191610119 916871376 10574Mar-09Apr-09May-09Jun-09Jul-09Aug-09Sep-09Oct-09Nov-09Dec-09Jan-10Feb-10Absolute Cash % Cash(%)Average cash percentage levels in the past six monthshave been ~7%.Large-cap funds currently hold ~6.20% of its corpus in cash compared with the past one-year average of 9.60%.AUM Cash & EquivalentScheme(INR bn) Feb-10 Jan-10Franklin India Bluechip 28 4% 6%DSPBR Top 100 Equity 25 7% 6%Reliance Equity-Ret 21 11% 13%Birla SL Frontline Equity-A 18 6% 13%Note: Large-cap fund universe comprises nine equity schemes (growth option)13
Mid-cap funds: Cash balances drift downCash balances with mid-cap funds reduced by ~INR 1bn over the previous month.Reduction in absolute cash balances is for the first timein the past three months.Cash balance of ~INR 13.70 bn accounts for ~8.4% ofthe mid-cap corpus of INR 162 bn .INR bn201612Absolute cash balances and percentage cash242119 17 12181298111597871289(%)86Mar-09Apr-09May-09Jun-09Jul-09Aug-09Sep-09Oct-09Nov-09Dec-09Jan-10Feb-10Absolute Cash% CashMid-cap funds currently hold 8.4% of its corpus in cash compared with the past one-year average of 10.60%.AUM Cash & EquivalentScheme(INR bn) Feb-10 Jan-10Reliance Growth-Ret 68 10% 12%Sundaram BNPP Select Midcap 19 6% 5%Birla SL Midcap-A 14 10% 14%IDFC Premier Equity-A 14 9% 7%Note: Mid-cap fund universe comprises 21 equity schemes (growth option)14
Diversified funds: Cash balances move up sharplyUnlike, the large-cap and the mid-cap funds, absolutecash balances with the diversified funds have movedup significantly. This trend has been witnessed in thediversified fund category since December, 2009.Absolute cash balances have increased by ~INR 8.25bn in February against rise of ~INR 6.80 bn lastmonth.Cash balances a with diversified d funds stood atINR 47.9 bn against INR 39.60 bn in January. TotalAUMs under diversified funds stand at ~INR 743 bn atthe end of February, <strong>2010</strong>.INR bn75706560555045403530Absolute cash balances and percentage cash14131310981077 66545 62Mar-09Apr-09May-09Jun-09Jul-09Aug-09Sep-09Oct-09Nov-09Dec-09Jan-10Feb-10Absolute Cash % Cash(%)Diversified funds currently hold 6.4% cash compared with the past one-year average of 7.75%.AUM Cash & EquivalentScheme(INR bn) Feb-10 Jan-10HDFC Top 200 65 8% 6%HDFC Equity 56 4% 3%ICICI Pru Infrastructure 39 15% 8%Reliance Vision-Ret 37 6% 7%Note: Diversified fund universe comprises of 99 equity schemes (growth option)15
16Sectoral Allocation
2016(% Allocation)Allocation changes M-o-M12Large-cap funds increased exposure to banking, oil& gas, engineering, auto and pharmaceuticals andreduced it in IT, telecom, FMCG, metals andcements.8Large-cap <strong>Fund</strong>4-OthersCASH2016llocation)128Mid-cap funds increased exposure to FMCG,banking, pharmaceuticals, metals and oil & gasand reduced it in engineering, IT, telecom andauto.Banking &FinanceOil & GasIT & TelecomEngineeringPharmaFMCGAutoMetalsCement(% AlMiscellaneousChemicalsDiversified fund allocation has remained more orless in line with the previous month.Feb-10 Jan-10Mid-cap <strong>Fund</strong>Diversified <strong>Fund</strong>24204(% Allocation)A161284--EngFMCGBanking &FinanceineeringPharmaIT & TelecomMetalsOil & GasMiscellaneousChemicalsAutoCementCASHOthersBanking &FinanceOil & GasEngineeringIT & TelecomFMCGPharmaMetalsAutoMiscellaneousCementChemicalsCASHOthersFeb-10 Jan-10Feb-10 Jan-1017
Sectoral ownershipTable below elaborates sectoral ownership of the top 10 fund houses sorted on the basis of equity AUM.Figures in green indicate over-ownership and those in red indicate under-ownership in a particular sector comparedwith the BSE 100.(%)FranklinSundaramIndustry BSE100 Birla SL DSP BR Templeton HDFC ICICI Pru Reliance SBI BNPP Tata UTIBanking & Finance 21.64 18.32 17.34 22.38 25.20 22.18 16.99 14.02 12.28 17.28 18.95Oil & Gas 15.62 10.88 17.71 14.13 12.45 16.64 14.63 14.04 13.72 11.50 16.08IT 10.87 10.64 5.83 7.29 7.52 9.25 6.85 6.10 7.43 8.95 8.89Metals 10.23 6.30 3.51 8.18 1.07 5.70 8.42 6.70 7.42 9.56 8.22Cap Goods & Engg 8.71 16.51 18.94 11.61 15.36 10.57 13.98 17.34 20.95 21.15 17.28FMCG 7.08 9.06 7.36 6.66 10.67 6.37 8.13 9.25 9.86 6.08 8.72Cement & Construction 6.87 2.59 1.81 4.40 0.11 2.04 2.05 6.15 1.90 2.44 3.27Auto 5.24 5.36 2.99 5.14 4.66 2.71 3.75 3.14 4.74 3.99 4.55Power 4.31 6.80 7.12 1.62 2.12 8.70 9.11 8.22 8.10 5.52 6.40Pharma 3.69 4.57 6.76 4.42 10.92 5.41 8.31 4.90 5.32 3.56 3.09Telecom 3.45 1.50 1.09 6.76 0.92 5.92 1.34 3.28 0.91 2.13 0.70Diversified 1.54 3.85 4.70 3.76 4.40 1.77 3.26 3.18 3.67 6.26 1.47Chemicals 0.59 1.89 2.41 2.91 1.68 2.34 2.43 2.64 2.63 1.48 1.31Cons Durables 0.16 1.73 2.43 0.74 2.93 0.39 0.77 1.04 1.07 0.10 1.06Source: ACE MF, <strong>Edelweiss</strong> researchBanking and oil & gas have been clear favourites among the domestic mutual funds. Allocations to these industrieshave increased significantly over the previous month.18
19Stock Allocation
Top holdingsLarge Cap <strong>Fund</strong>sMid Cap <strong>Fund</strong>s% Of Net Assets % Of Net AssetsRankRankCompany Name Feb-10 Jan-10 change Company Name Feb-10 Jan-10 changeReliance Inds 6.1 6.8 Lupin 3.0 3.0 ICICI Bank 4.2 3.8 Bank Of Baroda 1.9 1.9 TCS 41 4.1 39 3.9 United Spirits 18 1.8 15 1.5 Infosys 3.8 4.1 Jindal Saw 1.8 1.7 SBI 3.8 3.5 SBI 1.7 1.8 HDFC Bank 3.5 2.5 Divi'S Labs 1.7 1.6 ONGC 3.3 3.3 ICICI Bank 1.5 1.4 LT 33 3.3 29 2.9 United Phosphorush 15 1.5 15 1.5 BHEL 3.0 2.4 (new)Crompton Greaves 1.5 1.6 Bharti Airtel 2.6 3.1 Infosys Tech 1.4 1.3 (new)Diversified <strong>Fund</strong>s% Of Net Assets RankCompany Name Feb-10 Jan-10 changeICICI Bank 4.5 4.3 Reliance Inds 4.5 4.7 SBI 3.8 3.5 ONGC 3.5 3.6 Infosys Tech 3.4 3.4 Bharti Airtel 2.2 2.5 BHEL 2.1 2.0 LT 2.1 2.0 TCS 2.1 2.1 ITC 1.8 2.0 Rank Unchanged Rank Improved Rank Declined New Entrant20
New entry* INR crStock <strong>Fund</strong> House Value Stock <strong>Fund</strong> House ValueHathway Cable & Datacom DSP BR MF , Franklin Templeton MF , SBI MF , K 171.61 Mahanagar Telephone Nigam HSBC MF 7.18DB Realty Reliance MF , SBI MF 94.05 Hinduja Ventures JM MF 6.73Cairn India Reliance MF 79.04 Oil India Sundaram BNPP MF , ICICI Pru MF 6.07Bajaj Holdings & Investment ICICI Pru MF , Reliance MF 77.77 Mcnally Bharat Engg. Company HSBC MF 5.50LIC Housing Finance Kotak MF 46.61 Pantaloon Retail (India)-B-DVR Kotak MF , Tata MF 5.48Mphasis Reliance MF 39.78 Finolex Industries HSBC MF 5.41Spicejet Kotak MF , Reliance MF 37.57 Videocon Industries JM MF , HDFC MF 5.14Vascon Engineers HDFC MF , Sundaram BNPP MF 36.04 Shriram Transport Finance Company SBI MF 5.07Indian Bank Reliance MF , ICICI Pru MF 34.22 Shree Cement Franklin Templeton MF 4.82Mahindra Forgings Reliance MF 31.45 Arss Infrastructure Projects ICICI Pru MF , DSP BR MF , HDFC M 4.70JSW Energy DSP BR MF 28.87 Vardhman Textiles SBI MF 4.58GVK Power & Infrastructure Reliance MF 21.43 Pipavav Shipyard DSP BR MF 4.35IBN 18 Broadcast HDFC MF 20.72 Kotak Mahindra Bank SBI MF , HDFC MF , JM MF 3.98Everest Industries Reliance MF 19.34 Monsanto India Sundaram BNPP MF 3.95Lanco Infratech Franklin Templeton MF 18.94 Indraprastha Gas Tata MF 3.74Piramal Healthcare Kotak MF , ICICI Pru MF 14.03 Bank Of Baroda Franklin Templeton MF 3.55Bajaj j Hindusthan HDFC MF , ICICI Pru MF 13.43 Chennai Petroleum Corporation. Birla SL MF , Tata MF 3.45Adani Power Kotak MF 11.87 Mahindra Holidays & Resorts India HSBC MF 3.28Tata Chemicals ICICI Pru MF , HDFC MF , Kotak MF 11.56 Hitachi Home & Life Solutions (India) HSBC MF 3.23Sesa Goa DSP BR MF 11.32 Exide Industries Principal Pnb MF 3.22JSW Steel Sundaram BNPP MF 11.28 Strides Arcolab DSP BR MF 3.09Zuari Industries Kotak MF 9.71 Sadbhav Engineering Principal Pnb MF 3.01Man InfraConstruction Reliance MF 9.00 Balkrishna Industries HSBC MF 2.96Jubilant FoodWorks HDFC MF , Birla SL MF , Kotak MF 8.61 Fortis Healthcare ICICI Pru MF , Kotak MF 2.84Container Corpn. Of India Kotak MF 8.19 Tulip Telecom Kotak MF 2.70Coromandel Fertilizers ICICI Pru MF 8.18 Gammon Infrastructure Projects Principal Pnb MF 2.52Yes Bank ICICI Pru MF 7.35 SKF India HSBC MF 2.37Source : ACE MF, <strong>Edelweiss</strong> research21
Hot/Cold stocksTable below elaborates the top 10 stocks added and reduced over the previous month.Company NameNo of shares(Jan-10)No of shares(Feb-10)M-o-MChangeCompany NameNo of shares(Jan-10)No of shares(Feb-10)Shares in crM-o-MChangeTop 10 Hot StocksTop 10 Cold StocksNTPC 97 9.7 12.0 23 2.3 Crompton Greaves 11.0 79 7.9 -3.14 314Spicejet 3.1 5.0 1.9 ITC 11.3 10.0 -1.26Adani Power 2.7 3.8 1.1 REC 2.9 2.0 -0.96GVK Power & Infra 7.4 8.1 0.7 Bharti Airtel 10.8 9.8 -0.93Consolidated Const 0.2 0.8 0.7 Hindalco Industries 5.3 4.6 -0.75Lanco Infratech 4.4 5.0 0.6 Gujarat State Petronet 4.6 3.9 -0.70Cairn India 4.2 4.6 0.5 Jagran Prakashan 3.2 2.5 -0.66KRBL 0.1 0.5 0.4 Tata Steel 3.1 2.5 -0.56HPCL 2.9 3.3 0.4 Dabur India 1.8 1.3 -0.56Jubilant FoodWorks 0.0 0.4 0.4 NIIT 1.3 0.8 -0.55Source: ACE MF , <strong>Edelweiss</strong> researchNote: The universe comprises of equity schemes (growth option)22
DisclaimerThis document has been prepared by <strong>Edelweiss</strong> Securities Limited (<strong>Edelweiss</strong>). <strong>Edelweiss</strong>, its holding company and associate companies are a full service, integrated investment banking, portfolio management and brokerage group. Ourresearch analysts and sales persons provide important input into our investment banking activities. This document does not constitute an offer or solicitation for the purchase or sale of any financial instrument or as an official confirmation ofany transaction. The information contained herein is from publicly available data or other sources believed to be reliable, but we do not represent that it is accurate or complete and it should not be relied on as such. <strong>Edelweiss</strong> or any of itsaffiliates/ group companies shall not be in any way responsible for any loss or damage that may arise to any person from any inadvertent error in the information contained in this report. This document is provided for assistance only and isnot intended to be and must not alone be taken as the basis for an investment decision. The user assumes the entire risk of any use made of this information. Each recipient of this document should make such investigation as it deemsnecessary to arrive at an independent evaluation of an investment in the securities of companies referred to in this document (including the merits and risks involved), and should consult his own advisors to determine the merits and risksof such investment. The investment discussed or views expressed may not be suitable for all investors. We and our affiliates, group companies, officers, directors, and employees may: (a) from time to time, have long or short positions in,and buy or sell the securities thereof, of company (ies) mentioned herein or(b) be engaged in anyother transactionti involving i such securities and earn brokerage or other compensation or act as advisor or lender/borrower to such company(ies) or have other potential conflict of interest with respect to any recommendation and related information and opinions. This information is strictly confidential and is being furnished to you solely for your information. This informationshould not be reproduced or redistributed or passed on directly or indirectly in any form to any other person or published, copied, in whole or in part, for any purpose. This report is not directed or intended for distribution to, or use by, anyperson or entity who is a citizen or resident of or located in any locality, state, country or other jurisdiction, where such distribution, publication, availability or use would be contrary to law, regulation or which would subject <strong>Edelweiss</strong> andaffiliates/ group companies to any registration or licensing requirements within such jurisdiction. The distribution of this document in certain jurisdictions may be restricted by law, and persons in whose possession this document comes,should inform themselves about and observe, any such restrictions. The information given in this document is as of the date of this report and there can be no assurance that future results or events will be consistent with this information.This information is subject to change without any prior notice. <strong>Edelweiss</strong> reserves the right to make modifications and alterations to this statement as may be required from time to time. However, <strong>Edelweiss</strong> is under no obligation to updateor keep the information current. Nevertheless, <strong>Edelweiss</strong> is committed to providing independent and transparent recommendation to its client and would be happy to provide any information in response to specific client queries. Neither<strong>Edelweiss</strong> nor any of its affiliates, group companies, directors, employees, agents or representatives shall be liable for any damages whether direct, indirect, special or consequential including lost revenue or lost profits that may arise fromor in connection with the use of the information. Past performance is not necessarily a guide to future performance. The disclosures of interest statements incorporated in this document are provided solely to enhance the transparency andshould not be treated as endorsement of the views expressed in the report. <strong>Edelweiss</strong> Securities Limited generally prohibits its analysts, persons reporting to analysts and their family members from maintaining a financial interest in thesecurities or derivatives of any companies that the analysts cover. The analyst for this report certifies that all of the views expressed in this report accurately reflect his or her personal views about the subject company or companies and itsor their securities, and no part of his or her compensation was, is or will be, directly or indirectly related to specific recommendations or views expressed in this report. Copyright 2007 <strong>Edelweiss</strong> Research (<strong>Edelweiss</strong> Securities Ltd). All rightsreserved.23