GNUPLOT - A Brief Manual and Tutorial
GNUPLOT - A Brief Manual and Tutorial
GNUPLOT - A Brief Manual and Tutorial
You also want an ePaper? Increase the reach of your titles
YUMPU automatically turns print PDFs into web optimized ePapers that Google loves.
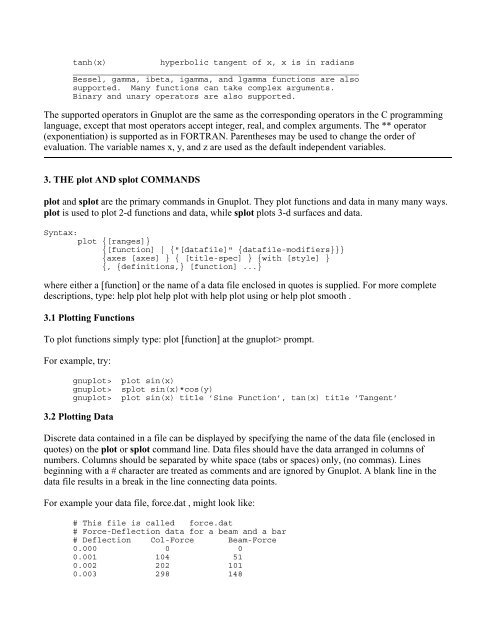
tanh(x) hyperbolic tangent of x, x is in radians___________________________________________________________Bessel, gamma, ibeta, igamma, <strong>and</strong> lgamma functions are alsosupported. Many functions can take complex arguments.Binary <strong>and</strong> unary operators are also supported.The supported operators in Gnuplot are the same as the corresponding operators in the C programminglanguage, except that most operators accept integer, real, <strong>and</strong> complex arguments. The ** operator(exponentiation) is supported as in FORTRAN. Parentheses may be used to change the order ofevaluation. The variable names x, y, <strong>and</strong> z are used as the default independent variables.3. THE plot AND splot COMMANDSplot <strong>and</strong> splot are the primary comm<strong>and</strong>s in Gnuplot. They plot functions <strong>and</strong> data in many many ways.plot is used to plot 2-d functions <strong>and</strong> data, while splot plots 3-d surfaces <strong>and</strong> data.Syntax:plot {[ranges]}{[function] | {"[datafile]" {datafile-modifiers}}}{axes [axes] } { [title-spec] } {with [style] }{, {definitions,} [function] ...}where either a [function] or the name of a data file enclosed in quotes is supplied. For more completedescriptions, type: help plot help plot with help plot using or help plot smooth .3.1 Plotting FunctionsTo plot functions simply type: plot [function] at the gnuplot> prompt.For example, try:gnuplot> plot sin(x)gnuplot> splot sin(x)*cos(y)gnuplot> plot sin(x) title ’Sine Function’, tan(x) title ’Tangent’3.2 Plotting DataDiscrete data contained in a file can be displayed by specifying the name of the data file (enclosed inquotes) on the plot or splot comm<strong>and</strong> line. Data files should have the data arranged in columns ofnumbers. Columns should be separated by white space (tabs or spaces) only, (no commas). Linesbeginning with a # character are treated as comments <strong>and</strong> are ignored by Gnuplot. A blank line in thedata file results in a break in the line connecting data points.For example your data file, force.dat , might look like:# This file is called force.dat# Force-Deflection data for a beam <strong>and</strong> a bar# Deflection Col-Force Beam-Force0.000 0 00.001 104 510.002 202 1010.003 298 148


