BUNDABERG REGIONAL COUNCIL Financial 10 Year Forecast ...
BUNDABERG REGIONAL COUNCIL Financial 10 Year Forecast ...
BUNDABERG REGIONAL COUNCIL Financial 10 Year Forecast ...

Create successful ePaper yourself
Turn your PDF publications into a flip-book with our unique Google optimized e-Paper software.
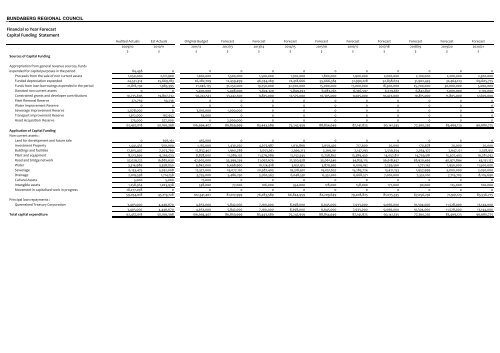
<strong>BUNDABERG</strong> <strong>REGIONAL</strong> <strong>COUNCIL</strong><strong>Financial</strong> <strong>10</strong> <strong>Year</strong> <strong>Forecast</strong>Capital Funding StatementSources of Capital FundingAudited Actuals Est Actuals Original Budget <strong>Forecast</strong> <strong>Forecast</strong> <strong>Forecast</strong> <strong>Forecast</strong> <strong>Forecast</strong> <strong>Forecast</strong> <strong>Forecast</strong> <strong>Forecast</strong> <strong>Forecast</strong>2009/<strong>10</strong> 20<strong>10</strong>/11 2011/12 2012/13 2013/14 2014/15 2015/16 2016/17 2017/18 2018/19 2019/20 2020/21$ $ $ $ $ $ $ $ $ $ $ $Appropriation from general revenue sources, fundsexpended for capital purposes in the period 84,458 0 0 0 0 0 0 0 0 0 0 0Proceeds from the sale of non current assets 1,050,000 2,121,900 1,200,000 1,500,000 1,500,000 1,700,000 1,800,000 1,900,000 2,000,000 2,<strong>10</strong>0,000 2,200,000 2,300,000Funded depreciation expended 24,531,314 25,669,183 26,282,709 12,459,499 46,744,269 22,418,666 55,666,384 51,990,228 52,838,674 31,902,445 32,464,123 69,605,775Funds from loan borrowings expended in the period 21,818,792 1,983,395 21,046,175 31,250,000 19,750,000 32,700,000 15,000,000 17,000,000 18,300,000 25,700,000 30,000,000 5,000,000Donated non-current assets 0 0 5,200,000 5,408,000 5,624,320 5,849,293 6,083,265 6,326,597 6,579,661 6,842,847 7,000,000 7,170,000Constrained grants and developer contributions <strong>10</strong>,735,695 19,807,732 50,222,523 33,242,500 9,825,000 12,575,000 <strong>10</strong>,305,000 9,925,000 <strong>10</strong>,423,000 <strong>10</strong>,815,000 11,805,000 12,605,000Fleet Renewal Reserve 271,759 39,236 0 0 0 0 0 0 0 0 0 0Water Improvement Reserve 0 0 0 0 0 0 0 0 0 0 0 0Sewerage Improvement Reserve 2,078,000 0 3,0<strong>10</strong>,000 1,000,000 0 0 0 0 0 0 0 0Transport Improvement Reserve 1,612,000 167,952 33,000 0 0 0 0 0 0 0 0 0Asset Acquisition Reserve 275,000 377,000 0 2,000,000 0 0 0 0 0 0 0 062,457,018 50,166,398 <strong>10</strong>6,994,407 86,859,999 83,443,589 75,242,959 88,854,649 87,141,825 90,141,335 77,360,292 83,469,123 96,680,775Application of Capital FundingNon current assets :Land for development and future sale 0 605,161 455,000 0 0 0 0 0 0 0 0 0Investment Property 1,441,435 500,000 1,135,000 1,430,020 4,203,987 1,631,866 2,659,426 717,600 20,000 170,678 20,000 20,000Buildings and facilities 17,615,407 7,073,760 17,837,407 1,960,288 3,053,951 2,366,213 2,269,161 2,147,193 2,539,354 2,034,327 2,647,121 2,328,931Plant and equipment 8,513,566 9,265,023 8,828,000 11,089,<strong>10</strong>2 11,579,089 12,152,545 12,758,847 13,389,430 14,057,811 14,759,581 15,507,403 16,281,032Road and bridge network 37,029,122 16,882,630 47,602,000 35,399,259 21,067,676 21,320,928 35,061,546 34,833,115 36,618,457 38,920,465 40,971,894 43,151,122Water 3,314,989 3,358,050 9,847,000 6,498,960 <strong>10</strong>,124,918 3,651,915 3,879,992 6,009,192 7,239,560 1,771,142 1,950,000 11,500,000Sewerage 6,133,475 5,292,008 12,327,000 19,077,120 20,387,405 19,318,901 19,051,657 15,285,724 13,421,153 1,957,999 3,000,000 2,050,000Drainage 2,019,538 1,714,158 3,755,000 5,486,250 5,760,563 6,048,591 6,351,020 6,668,571 7,002,000 7,352,<strong>10</strong>0 7,719,705 8,<strong>10</strong>5,690Cultural Assets 5,000 5,000 17,000 0 0 0 0 0 0 0 0 0Intangible assets 1,258,564 1,023,938 538,000 77,000 <strong>10</strong>6,000 354,000 178,000 158,000 177,000 90,000 125,000 <strong>10</strong>0,000Movement in capitalised work in progress -18,277,078 0 0 0 0 0 0 0 0 0 0 059,054,018 45,719,728 <strong>10</strong>2,341,407 81,017,999 76,283,589 66,844,959 82,209,649 79,208,825 81,075,335 67,056,292 71,941,123 83,536,775Principal loan repayments :Queensland Treasury Corporation 3,403,000 4,446,670 4,653,000 5,842,000 7,160,000 8,398,000 6,645,000 7,933,000 9,066,000 <strong>10</strong>,304,000 11,528,000 13,144,0003,403,000 4,446,670 4,653,000 5,842,000 7,160,000 8,398,000 6,645,000 7,933,000 9,066,000 <strong>10</strong>,304,000 11,528,000 13,144,000Total capital expenditure 62,457,018 50,166,398 <strong>10</strong>6,994,407 86,859,999 83,443,589 75,242,959 88,854,649 87,141,825 90,141,335 77,360,292 83,469,123 96,680,775