2011 Annual Report to the School Community - Drouin Secondary ...
2011 Annual Report to the School Community - Drouin Secondary ...
2011 Annual Report to the School Community - Drouin Secondary ...

You also want an ePaper? Increase the reach of your titles
YUMPU automatically turns print PDFs into web optimized ePapers that Google loves.
<strong>2011</strong> <strong>Annual</strong> <strong>Report</strong> <strong>to</strong><strong>the</strong> <strong>School</strong> <strong>Community</strong><strong>Drouin</strong> <strong>Secondary</strong> College<strong>School</strong> Number: 7785
Government <strong>School</strong> PerformanceSummary <strong>2011</strong>What our school is doing<strong>Drouin</strong> <strong>Secondary</strong> College<strong>Drouin</strong> <strong>Secondary</strong> College’s vision is "To ensure every student develops <strong>the</strong> knowledge, skills and behaviours needed <strong>to</strong> positivelycontribute as responsible and caring citizens of a changing, global community." The College’s daily life is linked closely <strong>to</strong> its corevalues: ACHIEVEMENT, RESPECT, COMMITMENT AND COMMUNITY.<strong>Drouin</strong> <strong>Secondary</strong> College is a steadily growing medium sized rural year 7 <strong>to</strong> 12 secondary college with 940 students. Studentsattending <strong>the</strong> College come from a large geographical area. The nature of <strong>the</strong> community is changing with steady growth in <strong>the</strong>major centres of population – <strong>Drouin</strong>, Bunyip, Garfield and Longwarry. The geography of our feeder area means that an extensivebus network is co-ordinated by <strong>the</strong> College. About 60% of our students travel <strong>to</strong> school by country or <strong>to</strong>wn service buses. Weincreasingly draw students from beyond our traditional feeder primary school with over 110 students travelling by rail on <strong>the</strong>Pakenham line. The College has 72 teaching staff including 3 Principal Class and a fur<strong>the</strong>r 41 support staff.Our Strategic Plan was finalised at <strong>the</strong> end of 2010 for <strong>the</strong> <strong>2011</strong> <strong>to</strong> 2014 period. Our goals are: 1. Maximise student learning growthacross all areas of <strong>the</strong> curriculum. 2. Develop whole school strategies for improving writing and numeracy across <strong>the</strong> school linked <strong>to</strong>learning needs identified by student data. 3. To improve student engagement and wellbeing by developing a stimulating andsupportive learning culture. 4. Improve positive post-school pathways by fur<strong>the</strong>r developing transitions in<strong>to</strong> <strong>the</strong> College and through<strong>the</strong> College.Student Learning<strong>Drouin</strong> <strong>Secondary</strong> College has beenproud of its ability <strong>to</strong> support our studentsin successfully completing <strong>the</strong>ir seniorcertificates. We have achieved improvedretention and greater uptake in VET andVCAL certificates. Our VCE results in<strong>2011</strong> were excellent with a mean studyscore of 29.2 and close <strong>to</strong> 5% over astudy score of 40.Our NAPLAN results demonstrate solidstudent learning growth between year 7and 9. This learning growth data improvedin <strong>2011</strong>. The quality of our Year 7 <strong>to</strong> 9programs and interventions havecontributed <strong>to</strong> this improved growth.Writing has been identified as requiringfur<strong>the</strong>r improvement and <strong>the</strong>re will be afocus on improving writing and numeracystandards in 2012.Teachers' work is supported by cognitivecoaches and an external numeracycoach.Staff worked in professional learningteams both in year level teams and inlearning area teams. In 2012 <strong>the</strong> PLTs willoperate in KLD groups. Teacher will usean evidence based cycle includinganalysing data and planning <strong>the</strong> next levelof student learning and reflection on <strong>the</strong>effective of <strong>the</strong>ir teaching.Students use Netbooks and online 24/7access <strong>to</strong> support <strong>the</strong>ir learning. In 2012every student in year 7 <strong>to</strong> 12 will beprovided with a netbook.Student Engagementand WellbeingAttendance rate in <strong>2011</strong> decreasedsignificantly and is an area of focus in2012. The College continues <strong>to</strong> use periodby period electronic role marking and SMSmessaging <strong>to</strong> ensure all parents arenotified immediately a student is absent.Level Teams will support students withpoor attendance rates.The College continues <strong>to</strong> focus on lowstudent motivation survey results. TheCollege introduced pas<strong>to</strong>ral care groupscalled Personal Learning Groups <strong>to</strong>ensure every class group will have asignificant teacher for support. Theprogram also provides students withimproved understanding of careerpathways and independent learning.The College has built a quality studentwellbeing team which supports <strong>the</strong>College's learning culture and studentwellbeing. The team work within a casemangement model.The College has a strong studentleadership structure which included <strong>the</strong>introduction of a buddy program in <strong>2011</strong>.In 2012 fur<strong>the</strong>r development is planned <strong>to</strong>increase student voice. We will continue <strong>to</strong>give student leaders formal training.In <strong>2011</strong> <strong>the</strong> College used ex-students astu<strong>to</strong>rs and men<strong>to</strong>rs for indigenousstudents and student at risk with lowliteracy or numeracy skills. This programwill continue in 2012.Student Pathwaysand TransitionsThe College has an Education Plan whichis underpinned by a personalised learningapproach. One element is <strong>to</strong> providerelevant pathways for our students. TheCollege has an Innovative curriculumstructure that allows vertical moment for allstudents in year 8 <strong>to</strong> 12. Over 20% ofstudents access units at least one yearahead of <strong>the</strong>ir normal year level. Thisinitaitive is supported by a comprehensivecareers and course selection process. Atyear 10 close <strong>to</strong> 100% of students willcomplete a year 11 VCE or VET unit.Our exit destination at year 10 <strong>to</strong> 12 waspositive but university applications andentry has declined. Although <strong>the</strong> Collegehad some of <strong>the</strong> best VCE results inGippsland it had a lower Universityapplication percentage. In 2012 <strong>the</strong>careers and pathways team will focus onincreasing <strong>the</strong> number of student applyingfor university placements.A strong program supports students withdisabilities <strong>to</strong> achieve <strong>the</strong>ir individual goals.In 2012 <strong>the</strong> College will introduce a newlife skills unit <strong>to</strong> support in <strong>the</strong> PSDprogram.The College has strong relationships withour feeder primary schools and has astrong focus on ensuring a smooth andseamless transition for our students. In2012 <strong>the</strong> College will look <strong>to</strong> fur<strong>the</strong>rdevelop links with our main feeder primaryschools.For more detailed information regarding our school please visit our website atwww.drouinsc.vic.edu.auor view our <strong>2011</strong> <strong>Annual</strong> <strong>Report</strong> online at http://www.vrqa.vic.gov.au/SReg/
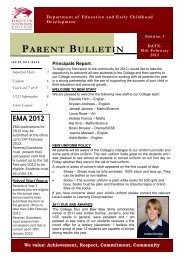
Government <strong>School</strong> PerformanceSummary <strong>2011</strong><strong>Drouin</strong> <strong>Secondary</strong> CollegeHow this school compares <strong>to</strong> allVic<strong>to</strong>rian government schoolsKey:Range of results for <strong>the</strong> middle 60% of Vic<strong>to</strong>rian government schools:Result for this school: Median of all Vic<strong>to</strong>rian government schools:This page provides <strong>the</strong> overall picture of this school's performance in <strong>the</strong> past year.The following pages provide more detail on each of <strong>the</strong>se measures.Overall Measures Student Outcomes <strong>School</strong> ComparisonResults achieved by students at this schoolcompared <strong>to</strong> students at o<strong>the</strong>r Vic<strong>to</strong>riangovernment schools.Whe<strong>the</strong>r this school, taking in<strong>to</strong> account itsstudents, is performing higher than, lowerthan, or broadly similar <strong>to</strong> o<strong>the</strong>r schools,taking in<strong>to</strong> account <strong>the</strong>ir students.1. Student LearningCombining teacher assessments from <strong>the</strong>Vic<strong>to</strong>rian Essential Learning Standards(VELS), <strong>the</strong> results from <strong>the</strong> NationalAssessment Program – Literacy andNumeracy (NAPLAN) tests and <strong>the</strong>Vic<strong>to</strong>rian Certificate of Education (VCE).LowerOutcomesHigherOutcomesLower Similar Higher2. Student Engagement and WellbeingCombining student attendance rates andresults from <strong>the</strong> annual student Attitudes<strong>to</strong> <strong>School</strong> survey.LowerOutcomesHigherOutcomesLower Similar Higher3. Student Pathways and TransitionsCombining <strong>the</strong> number of studentsremaining at school through <strong>to</strong> Year 10and students going on <strong>to</strong> fur<strong>the</strong>r study orfull-time employment from Years 10 <strong>to</strong> 12.LowerOutcomesHigherOutcomesLower Similar Higher●<strong>School</strong> Profile● Average level of parent satisfaction ● Average level of staff satisfaction ● Overall socio-economic profilewith <strong>the</strong> school, as derived from with <strong>the</strong> school, as derived from<strong>the</strong> annual Parent Opinion survey. <strong>the</strong> annual Staff Opinion survey.low low-mid midThe score is reported on a scale The score is reported on a scaleof 1 <strong>to</strong> 7, where 7 is <strong>the</strong> highest of 1 <strong>to</strong> 5, where 5 is <strong>the</strong> highestpossible score.possible score.1● Proportion of students with English as a second language7 1 5low low-mid mid mid-high highAll Vic<strong>to</strong>rian government school teachers meet <strong>the</strong> registrationrequirements of <strong>the</strong> Vic<strong>to</strong>rian Institute of Teaching (www.vit.vic.edu.au).For more information regarding this school, please visit www.vrqa.vic.gov.au/sreg●mid-highhighBased on <strong>the</strong> school's Student Family Occupation indexwhich takes in<strong>to</strong> account parents' occupations.943 students (453 female, 490 male) were enrolled at thisschool in <strong>2011</strong>.7785 Version 1, February 2012
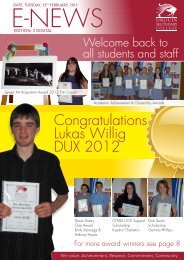
<strong>Drouin</strong> <strong>Secondary</strong> CollegeHow this school compares <strong>to</strong> allVic<strong>to</strong>rian government schoolsKey:Range of results for <strong>the</strong> middle 60% of Vic<strong>to</strong>rian government schools:Result for this school: Median of all Vic<strong>to</strong>rian government schools:Student Learning Student Outcomes <strong>School</strong> Comparison4. Teacher assessments from <strong>the</strong>Vic<strong>to</strong>rian Essential Learning Standards(VELS)Percentage of students in Years 7 <strong>to</strong> 10with a grade of C or above in:●●English and Ma<strong>the</strong>maticsAll o<strong>the</strong>r subjectsThe grades are <strong>the</strong> same as those used inyour child's end of year report.A ‘C’ rating means that a student is at <strong>the</strong>standard expected at <strong>the</strong> time ofreporting.000Results: English and Ma<strong>the</strong>matics 2010Results: English and Ma<strong>the</strong>matics2007 - 2010 (4-year average)Results: All o<strong>the</strong>r subjects 2010Results: All o<strong>the</strong>r subjects2007 - 2010 (4-year average)100100100Lower Similar HigherLower Similar HigherLower Similar Higher0100Lower Similar Higher5. NAPLAN Year 7 Results: Reading <strong>2011</strong>Average score achieved on <strong>the</strong> NAPLANReading and Numeracy tests conductedin May each year.Year 7 assessments are reported on ascale from Bands 4-9.Bands represent different levels ofachievement. For Year 7, <strong>the</strong> NationalMinimum Standard is at Band 5.Band 4 5 6 7 8 9Results: Reading 2008 - <strong>2011</strong>(4-year average)Band 4 5 6 7 8 9Results: Numeracy <strong>2011</strong>Being <strong>the</strong> first year of secondaryschool, Year 7 NAPLAN is not used for<strong>the</strong> <strong>School</strong> Comparison.Band 4 5 6 7 8 9Results: Numeracy 2008-<strong>2011</strong>(4-year average)Band 4 5 6 7 8 96. NAPLAN Year 9 Results: Reading <strong>2011</strong>Average score achieved on <strong>the</strong> NAPLANReading and Numeracy tests conductedin May each year.Year 9 assessments are reported on ascale from Bands 5-10.Bands represent different levels ofachievement. For Year 9, <strong>the</strong> NationalMinimum Standard is at Band 6.Band 5 6 7 8 9 10Results: Reading 2008 - <strong>2011</strong>(4-year average)Band 5 6 7 8 9 10Results: Numeracy <strong>2011</strong>Lower Similar HigherLower Similar HigherBand 5 6 7 8 9 10Results: Numeracy 2008-<strong>2011</strong>(4-year average)Lower Similar HigherBand 5 6 7 8 9 10Lower Similar HigherVersion 1, February 2012
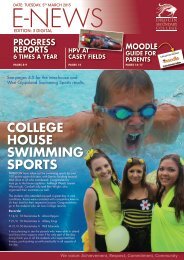
<strong>Drouin</strong> <strong>Secondary</strong> CollegeHow this school compares <strong>to</strong> allVic<strong>to</strong>rian government schoolsKey:Range of results for <strong>the</strong> middle 60% of Vic<strong>to</strong>rian government schools:Result for this school: Median of all Vic<strong>to</strong>rian government schools:Student Learning Student Outcomes <strong>School</strong> Comparison7. Vic<strong>to</strong>rian Certificate of Education (VCE) Results: <strong>2011</strong>Mean study score from all VCE subjectsundertaken by students at this school.This includes all Unit 3 and 4 studies(including those completed in Year 11)and any VCE VET studies awarded astudy score. The maximum student studyscore is 50 and <strong>the</strong> state-wide mean(including government and nongovernmentschools) is set at 30.0 50Results: 2008 - <strong>2011</strong> (4-year average)0 50Lower Similar HigherLower Similar HigherPercent of students in <strong>2011</strong> who satisfac<strong>to</strong>rily completed <strong>the</strong>ir VCE: 100%Percent of Year 12 students in <strong>2011</strong> undertaking at least one Vocational Education and Training (VET) unit of competence: 23%Percent of VET units of competence satisfac<strong>to</strong>rily completed in <strong>2011</strong>: 98%Percent of Vic<strong>to</strong>rian Certificate of Applied Learning (VCAL) credits satisfac<strong>to</strong>rily completed in <strong>2011</strong>: 93%Student Engagement Student Outcomes <strong>School</strong> Comparisonand Wellbeing8. Student attendance Results: 2010Average attendance rate of all students in 0 100<strong>the</strong> school. Common reasons for nonattendanceinclude illness and extendedfamily holidays.Results: 2007 - 2010 (4-year average)0 100Lower Similar HigherAverage 2010 attendance rate by year level:Yr7 Yr8 Yr9 Yr10 Yr1192% 91% 89% 93% 94%Yr1295%Lower Similar Higher9. Student attitudes <strong>to</strong> school Results: <strong>2011</strong>Derived from <strong>the</strong> Attitudes <strong>to</strong> <strong>School</strong> 1 5survey completed annually by Vic<strong>to</strong>riangovernment school students in Years 5 <strong>to</strong>12. It includes questions about students’ Results: 2008 - <strong>2011</strong> (4-year average)engagement in and enjoyment of school.The school’s average score is reported1 5here on a scale of 1 <strong>to</strong> 5, where 5 is <strong>the</strong>highest possible score.Lower Similar HigherLower Similar HigherStudent Pathways Student Outcomes <strong>School</strong> Comparisonand Transitions10. Student retention Results: 2010Percentage of Year 7 students whoremain at <strong>the</strong> school through <strong>to</strong> Year 10.11. Students exiting <strong>to</strong> fur<strong>the</strong>r studies andfull-time employmentPercentage of students from Years 10 <strong>to</strong>12 going on <strong>to</strong> fur<strong>the</strong>r studies or full-timeemployment.0100Results: 2007 - 2010 (4-year average)0 100Results: 20100 100Results: 2007 - 2010 (4-year average)0 100Lower Similar HigherLower Similar HigherLower Similar HigherLower Similar HigherVersion 1, February 2012
How <strong>to</strong> read <strong>the</strong>Government <strong>School</strong>Performance Summary <strong>2011</strong>The Government <strong>School</strong> Performance Summary provides an overview of how this school is performing, andhow it compares <strong>to</strong> all o<strong>the</strong>r Vic<strong>to</strong>rian government schools.All schools acknowledge <strong>the</strong> partnership and support of <strong>the</strong>ir parents and <strong>the</strong> community in working <strong>to</strong>ge<strong>the</strong>r<strong>to</strong> improve outcomes for children and young people.By sharing this information with <strong>the</strong> community, our goal is <strong>to</strong> identify where we need <strong>to</strong> improve and <strong>to</strong> work<strong>to</strong>ge<strong>the</strong>r <strong>to</strong> achieve excellence in every school.The first page outlines whatyour school is doing <strong>to</strong> improveits results.The second page summarisesyour school’s performance.The third and fourth pagesprovide a detailed breakdownof each of <strong>the</strong> result areas.What are student outcomes?Student outcomes show <strong>the</strong> achievements ofstudents in this school in English, Ma<strong>the</strong>matics ando<strong>the</strong>r subjects. They also show results in nationalliteracy and numeracy tests and, for secondarycolleges, <strong>the</strong> Vic<strong>to</strong>rian Certificate of Education(VCE) examinations. They provide importantinformation about student attendance andengagement at school.For secondary colleges, <strong>the</strong> Government <strong>School</strong>Performance Summary also provides informationabout how many students at this school go on <strong>to</strong>fur<strong>the</strong>r studies or full-time work after leaving school.You can see <strong>the</strong>se results for <strong>the</strong> latest year, as wellas <strong>the</strong> average of <strong>the</strong> last four years (whereavailable).The Government <strong>School</strong> Performance Summaryalso allows you <strong>to</strong> compare student outcomes forstudents at this school with <strong>the</strong> outcomes ofstudents in all o<strong>the</strong>r Vic<strong>to</strong>rian government schools.
What is a <strong>School</strong> Comparison?The <strong>School</strong> comparison is a way of comparingschool performance that takes in<strong>to</strong> account <strong>the</strong>different student intake characteristics of eachschool.A <strong>School</strong> comparison takes in<strong>to</strong> account <strong>the</strong> school’sacademic intake, <strong>the</strong> socio-economic backgroundof students, <strong>the</strong> number of Indigenous students, <strong>the</strong>number of non-English speaking and refugeestudents, <strong>the</strong> number of students with a disability,and <strong>the</strong> size and location of <strong>the</strong> school.The <strong>School</strong> comparison measures show that mostschools are doing well and are achieving resultsthat are ‘similar’ <strong>to</strong> what we would estimate given<strong>the</strong> background characteristics of <strong>the</strong>ir students.Some schools are doing exceptionally well with <strong>the</strong>students <strong>the</strong>y have, and have ‘higher’ performance.Some schools have ‘lower’ performance after takingin<strong>to</strong> account <strong>the</strong>ir students’ characteristics – <strong>the</strong>seschools will receive targeted support <strong>to</strong> ensure that<strong>the</strong>re is improvement.Looking at both <strong>the</strong> student outcomes and schoolcomparisons provides important information aboutwhat a school is doing well and <strong>the</strong> areas thatrequire fur<strong>the</strong>r improvement.More information on school comparisonperformance measures can be found at:www.education.vic.gov.au/aboutschool/schoolreportsWhat is <strong>the</strong> meaning of ‘Data not available’?For some schools, <strong>the</strong>re are <strong>to</strong>o few students <strong>to</strong>provide data. For o<strong>the</strong>r schools, <strong>the</strong>re are no studentsat some levels, so school comparisonsare not possible. Newly opened schools have only <strong>the</strong>latest year of data and no averages from previousyears. The Department also recognises<strong>the</strong> unique circumstances of Specialist, Select Entry,English Language and <strong>Community</strong> <strong>School</strong>s whereschool comparisons are not appropriate.What is this school doing <strong>to</strong> improve?All schools have a plan <strong>to</strong> improve outcomes for<strong>the</strong>ir students. The ‘What our school is doing’statement provides a summary of this school’simprovement plan.
Financial Performanceand Position<strong>Drouin</strong> <strong>Secondary</strong> CollegeFinancial Performance – Operating StatementSummary for <strong>the</strong> year ending 31st December, Financial Position as at 31st December, <strong>2011</strong><strong>2011</strong>Revenue <strong>2011</strong> Actual Funds Available <strong>2011</strong> ActualDepartmental Grants $1,390,720 High Yield Investment Account $167,705Commonwealth Government Grants $10,017 Official Account $27,845State Government Grants $60,433 O<strong>the</strong>r Bank Accounts( listed individually)O<strong>the</strong>r $183,667 Building Fund $10,475Locally Raised Funds $1,304,232 Parents and Friends $21,840Total Operating Revenue $2,949,069 At Call Investments $104,705Bonds NT $6,500Expenditure (insert) $Salaries and Allowances $407,963 (insert) $Bank Charges $2,361 Total Funds Available $339,070Consumables $354,291Books and Publications $25,441 Financial Commitments <strong>2011</strong> ActualCommunication Costs $33,977 <strong>School</strong> Operating Reserve $42,551Furniture and Equipment $727,083 Assets or Equipment Replacement ‹12 months $0Utilities $140,345 Capital – Building/Grounds including SMS ‹ 12 $0Property Services $333,269 months$0Travel and Subsistence $973 Maintenance – Building/Grounds including $0Mo<strong>to</strong>r Vehicle Expenses $7,318 SMS ‹ 12 months$0Administration $21,891 Beneficiary/Memorial Accounts $6,500Health and Personal Development $931 Co-operative Bank Account $0Professional Development $33,864 Revenue Receipted in Advance $203,901Trading and Fundraising $254,776 <strong>School</strong> based programs $13,982Support/Service $369,109 Region/Network/Cluster Funds $54,016Miscellaneous $388,575 Provision Accounts $18,120Total Operating Expenditure $3,102,167 Repayable <strong>to</strong> DEECD $0O<strong>the</strong>r Recurrent Expenditure (Accounts Payable) $0Assets or Equipment Replacement › 12Net Operating Surplus/-Deficit -$153,098$0monthsCapital Expenditure $0Capital – Building/Grounds including SMS › 12$0Please note that <strong>the</strong> above amounts do not include anymonthscredit revenue or expenditure allocated or spent by <strong>the</strong> Maintenance - Building/Grounds includingschool through its Student Resource PackageSMS › 12 months$0Total Financial Commitments $339,070Financial performance and position commentary