Chasing Chaos with an RL-Diode Circuit - Experimental Physics
Chasing Chaos with an RL-Diode Circuit - Experimental Physics
Chasing Chaos with an RL-Diode Circuit - Experimental Physics

You also want an ePaper? Increase the reach of your titles
YUMPU automatically turns print PDFs into web optimized ePapers that Google loves.
<strong>Chasing</strong> <strong>Chaos</strong> <strong>with</strong> <strong>an</strong> <strong>RL</strong>-<strong>Diode</strong> <strong>Circuit</strong>Junaid Alam <strong>an</strong>d Sabieh AnwarLUMS School of Science <strong>an</strong>d EngineeringWednesday, March 24, 2010Have you ever wondered how science c<strong>an</strong> be so org<strong>an</strong>ized <strong>an</strong>d streamlined <strong>an</strong>d yet be ableto explain almost everything that we encounter? The <strong>an</strong>swer to this genius skepticismis quite straightforward: we made it simple, for it was me<strong>an</strong>t to simplify <strong>an</strong>d systematizewhat seemed to be erratic <strong>an</strong>d complicated. Science is a step towards intellectualsophistication in order to make things simple <strong>an</strong>d explicable. This is what Leonardo daVinci says, “simplicity is the ultimate sophistication.”In this experiment, on the contrary, we are going to shun the struggle for simplicity.Instead we are going to look into the complicated side of matters–those that appearto be simple. Let’s forget for the time being that simplicity is what we are after; let’spursue complexity <strong>an</strong>d intrigue; let’s chase <strong>Chaos</strong>.KEYWORDSDynamical System · Supersensitivity · Phase Portrait · Poincare Map · Attractor · Fractals· Self-similarity · Fiegenbaum Const<strong>an</strong>t · <strong>Diode</strong> Recovery Time · Junction Capacit<strong>an</strong>ce· Reson<strong>an</strong>ce · Period Doubling Bifurcation · <strong>Chaos</strong>.APPROXIMATE PERFORMANCE TIME 1 week.1 ObjectivesIn this experiment, we will discover:1. how very simple systems c<strong>an</strong> exhibit complex behavior under certain conditions,2. the richness of the mathematical <strong>an</strong>d physical structure of dynamical systems,3. how <strong>an</strong> arbitrarily small ch<strong>an</strong>ge in the input c<strong>an</strong> ch<strong>an</strong>ge the long-term conduct ofa dynamical system drastically,4. how to construct <strong>an</strong>d interpret phase portraits <strong>an</strong>d Poincare Maps for differentkinds of responses of a system,5. the mystery of Fiegenbaum const<strong>an</strong>t <strong>an</strong>d what makes chaos a universal underlyingstructure of the complexity exhibited by nonlinear dynamical systems,1
6. a beautiful <strong>an</strong>d artistic aspect of science in the form of attractors <strong>an</strong>d fractals.References <strong>an</strong>d Essential Reading[1] Gregory L. Baker, J. P. Gollub, “Chaotic dynamics: <strong>an</strong> introduction”, 2nd Edition,Melbourne: Cambridge University Press, 1996, Ch. 1-4.[2] Robert C. Hilborn, “<strong>Chaos</strong> <strong>an</strong>d Non-Linear Dynamics: An Introduction for Scientists<strong>an</strong>d Engineers”, 2nd Edition, NewYork: Oxford University Press, 2000, Ch.1-4.[3] J. Testa, J Perez <strong>an</strong>d C. Jefferies, “Evidence for Universal Chaotic Behavior of aDriven oscillator”, Phys. Rev. Lett., Vol. 48, pp. 714-717, 1982.[4] R.W. Rollins <strong>an</strong>d E. R. Hunt, “Exactly Solvable Model of a Physical System ExhibitingUniversal Chaotic Behavior”, Phys. Rev. Lett., vol. 49, pp. 1295-1298, 1982.[5] A. Azzouz, R. Duhr <strong>an</strong>d M. Hasler, “Tr<strong>an</strong>sition to <strong>Chaos</strong> in a Simple Nonlinear<strong>Circuit</strong> Driven by a Sinosoidal Voltage Source”, IEEE Tr<strong>an</strong>s. <strong>Circuit</strong>s Syst., Vol.CAS-30 (12), 1983.[6] M. P. H<strong>an</strong>ias, Z. Avgerinos, G.S. Tombras, “Period Doubling, Fiegenbaum const<strong>an</strong>t<strong>an</strong>d time series prediction in <strong>an</strong> experimental chaotic <strong>RL</strong>D circuit”, <strong>Chaos</strong>, Solitons<strong>an</strong>d Fractals 40 (2009); 1050-1059.[7] A.B. Ozer, E. Akin, “Tools for Detecting <strong>Chaos</strong>”, SA Fen Bilimleri Enstits Dergisi9. Cilt, 1. Say 2005.[8] N. C. Ropes, “Poincare Sections <strong>an</strong>d the R-L-<strong>Diode</strong> <strong>Circuit</strong>”, 28th SoutheasternSymposium on System Theory (SSST), 1996.2 FoundationsSummon up: What kind of nonlinear phenomena have you come across? Try to lista few, <strong>with</strong> a reason to why you believe them to be nonlinear.Ponder: Is it that all the linear processes that you have ever known about, are reallylinear? Remember one, <strong>an</strong>d put it to test.Mathematical linearization of scientific problems for the sake of practicality has been,in fact, a hum<strong>an</strong> confession that indicates a mere discrep<strong>an</strong>cy regarding our reach <strong>an</strong>dgrasp over nature. It would be naive to think that linearization works very often. We c<strong>an</strong>hardly find linear processes in nature. The spirit of nature is indeed non-linear. On theother h<strong>an</strong>d, no wonder, dynamical systems, systems having different behavior at differentinst<strong>an</strong>ts of time, comprise the core of scientific study. Therefore, in physics, nonlineardynamical systems remain a vitally import<strong>an</strong>t subject. Our current experiment is aboutone such system.2
2.1 Defining Nonlinear DynamicsNonlinear dynamics, is the field of physics <strong>an</strong>d mathematics that deals <strong>with</strong> the mostcommon kind of natural systems, systems that keep ch<strong>an</strong>ging <strong>with</strong> time <strong>an</strong>d are nonlinear.Being a bit more technical, dynamical systems for which the principle of superpositiondoesn’t hold are termed as nonlinear. For such systems the sum of responsesto several inputs c<strong>an</strong>not be treated as a single response to the sum of those all inputs.Qualitatively speaking [2]:A nonlinear system is a system whose time evolution equations are nonlinear; that is,the dynamical variables describing the properties of the system (for example, position,velocity, acceleration, pressure, etc.) appear in the equation in a nonlinear form.Now, if x represents <strong>an</strong> input variable <strong>an</strong>d y is the output as a function of x, theprinciple of superposition in its very simplistic form states that:y(x 1 + x 2 + ... + x n ) = y(x 1 ) + y(x 2 ) + ... + y(x n ) (1)The above mathematical expression me<strong>an</strong>s that if the stimulus to a linear system isdoubled, the response is also doubled. For a nonlinear system, the response will begreater or less th<strong>an</strong> that.Ask yourself: Could it be that a system is both linear <strong>an</strong>d nonlinear at the same time?C<strong>an</strong> a system be linear for some conditions <strong>an</strong>d nonlinear for others?2.2 Nonlinearity: A Conduit to <strong>Chaos</strong>What makes this nonlinearity so import<strong>an</strong>t? The basic idea is that for a linear system,when a parameter (e.g. the spring const<strong>an</strong>t k in a spring mass system) is varied, it doesn’tch<strong>an</strong>ge the qualitative behavior of the system. On the other h<strong>an</strong>d, for nonlinear systems,a small ch<strong>an</strong>ge in a parameter c<strong>an</strong> lead to sudden <strong>an</strong>d dramatic ch<strong>an</strong>ges in both thequalitative <strong>an</strong>d qu<strong>an</strong>titative behavior of the system. For one value, the behavior mightbe periodic. For <strong>an</strong>other value only slightly different from the first, the behavior mightbe completely aperiodic.Contemplate: What could be a physical expl<strong>an</strong>ation of this unpredictability <strong>an</strong>d suddench<strong>an</strong>ge in behavior?2.2.1 <strong>Chaos</strong> definedIn the context of nonlinear dynamical systems, chaos is a word used to describe thetime behavior of a system that is aperiodic, <strong>an</strong>d is apparently r<strong>an</strong>dom or “noisy”. But,underlying this chaotic r<strong>an</strong>domness is <strong>an</strong> order that c<strong>an</strong> be determined, in some sense,by the very time evolution equations that describe the system. Even when it may soundparadoxical, such <strong>an</strong> apparently r<strong>an</strong>dom system is in fact deterministic.Underst<strong>an</strong>d: What c<strong>an</strong> you comprehend from the statement “such <strong>an</strong> apparentlyr<strong>an</strong>dom system is in fact deterministic”? What is me<strong>an</strong>t by such determinism?3
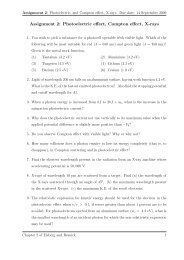
2.2.2 Origins of chaosNow, let us briefly try to <strong>an</strong>swer the question: what could be the origin of chaos innonlinear systems? Chaotic behavior shows up in systems that are essentially free fromnoise <strong>an</strong>d are also relatively simple, i.e. possess only a few degrees of freedom. This tellsus that chaotic behavior actually depends on the physical aspects <strong>an</strong>d the spatiotemporalproperties of a nonlinear system.2.3 <strong>Chaos</strong> ringing the door-bellUsually, chaotic behavior doesn’t appear <strong>with</strong>out informing us when it is about to come,adding to the beauty of this brave <strong>an</strong>d org<strong>an</strong>ized disorder. Generally, it all starts <strong>with</strong> aso called period-doubling bifurcation: system switches to a new behavior <strong>with</strong> twice theperiod of the original system at a particular value of a certain parameter. As the valueof that parameter is further increased, successive bifurcations occur <strong>an</strong>d the behavior ofsystem takes a time period that is four times, then eight times <strong>an</strong>d so on, finally endingin chaotic behavior. This makes the story of chaos eventful <strong>an</strong>d, as we shall see later,universal.The math ingredient: A dynamical system is expressed by its differential equations.What happens to the solution of the system equations when a bifurcation occurs?3 Identifying <strong>Chaos</strong>We need to recognize chaos by face, for we are going to encounter it several times inour experiment. So, now we will learn about some useful tools that c<strong>an</strong> help us identifychaos.3.1 Time seriesThe very first <strong>an</strong>d basic tool is the time series. Knowing the fact that chaos impliesaperiodicity, we c<strong>an</strong> tell if the system is chaotic by investigating the “shape” of its timeseries.45position coordinate3210−1−2position coordinate0−5−10−15−20−30 20 40 60 80 100 120 140 160 180 200time(a) Periodic Time Series−250 50 100 150 200 250 300 350 400 450 500time(b) Chaotic Time SeriesFigure 1: Time-series for periodic <strong>an</strong>d chaotic behavior.4
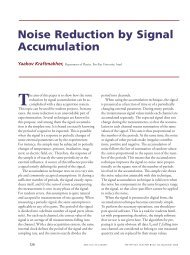
But not all of the aperiodic responses imply chaos; m<strong>an</strong>y signals might be aperiodic dueto the statistical noise or the complexity of the system. Therefore, time series <strong>an</strong>alysisshould be carried out for several initial conditions that may in turn validate the presenceof chaos by exhibiting “divergence of nearby trajectories”, i.e. difference in subsequenttrajectories for slightly different initial conditions.3.2 Fourier spectrumFrom our discussion about the time series of a chaotic system, we may surmise thatlike <strong>an</strong>y aperiodic response, the response of a chaotic system will have a continuum offrequencies when seen in the Fourier domain. This is indeed the case, <strong>an</strong>d is a very usefultool to recognize chaos.62.5Energy content5432Energy content21.5110.50frequency−1 0 1 2 3 4 5(a) Periodic Behavior0frequency0 0.02 0.04 0.06 0.08 0.1 0.12 0.14 0.16 0.18 0.2(b) Chaotic BehaviorFigure 2: Fourier spectra of periodic <strong>an</strong>d chaotic behavior.Still one should not forget that Fourier spectrum of a completely r<strong>an</strong>dom response is alsoa continuum of frequencies, so, this tool is useful when system approaches chaos afterpassing through several bifurcations <strong>an</strong>d we c<strong>an</strong>, in some way, track them.Exploit: When you know what chaos looks like, c<strong>an</strong> you come up <strong>with</strong> a scheme toharness chaos <strong>an</strong>d put it to practical use?3.3 Phase portraitsThe notion of state space (or phase space) is a very rich topic. It has a venerable historyof being helpful in stability <strong>an</strong>alysis as well as qu<strong>an</strong>titative inspection of dynamicalsystems. The basic idea in using a state space model is that if we are provided <strong>with</strong> theknowledge of the state variables, the variables that represent the state of a system, fora particular scenario <strong>an</strong>d the rate of ch<strong>an</strong>ge of those state variables, we c<strong>an</strong> predict thebehavior of the system in terms of those variables at <strong>an</strong>y time. This leads to the idea ofusing conjugate variables (Fourier duals of each other, or the position <strong>an</strong>d momentumvariables of the system) as the c<strong>an</strong>onical coordinates for a state space representation.So, for a periodic system that obeys the law of energy conservation (e.g. a pendulum),the state space plot (phase portrait) will be one closed loop for a particular set of initialconditions. For a chaotic system, there will be m<strong>an</strong>y distinct loops in a phase portrait,showing that the system is aperiodic <strong>an</strong>d does not approach a stable trajectory.5
−3 −2 −1 0 1 2 3 42.52.5momentum coordinate21.510.50−0.5−1−1.5−2−2.5position coordinate(a) Periodic Behaviormomentum coordinate21.510.50−0.5−1−1.5−2−2.5−25 −20 −15 −10 −5 0 5position coordinate(b) Chaotic BehaviorFigure 3: Possible phase portraits of periodic <strong>an</strong>d chaotic behavior.labelling of axis.Refer to main text for3.3.1 Example of a simple pendulumConsider a simple pendulum having a small amplitudeof oscillation (so that we c<strong>an</strong> assume sin θ ≈θ). Ignoring friction, it may be represented usingNewton’s second law by a normalized second orderdifferential equation of the form:d 2 θdt 2 + g l θ = 0 (2)where θ represents the <strong>an</strong>gular position of the pendulum.The solution of this equation will be:Figure 4: The simple pendulumθ = θ o sin(ωt + ϕ) (3)where θ o is the maximum <strong>an</strong>gular displacement. The first derivative of θ is:˙θ = θ o ω cos(ωt + ϕ) (4)Now, from (3) <strong>an</strong>d (4), writing <strong>an</strong> equation in terms of θ <strong>an</strong>d ˙θ will give the parametricequation:θ 2θo2+ ( ˙θ) 2(ωθ o ) 2 = 1 (5)which is evidentally the equation of <strong>an</strong> ellipse <strong>with</strong> θ on the horizontal <strong>an</strong>d ˙θ on thevertical axis <strong>an</strong>d represents a periodic trajectory in the phase space. In this context, θ<strong>an</strong>d ˙θ represent the c<strong>an</strong>onical coordinates. Using the two coordinates, we c<strong>an</strong> find thestate of the system at <strong>an</strong>y inst<strong>an</strong>t.6
Implicate: Write down the equation of energy of a pendulum in terms of position <strong>an</strong>dmomentum variables indicated in the formalism above. What is the total energy in thesystem?Figure out: What does a closed loop in phase space signify? What c<strong>an</strong> we say aboutthe energy contained in a system?A step ahead: Draw the circuit diagram of <strong>an</strong> <strong>RL</strong>C circuit. Write down the differentialequation of the system <strong>an</strong>d identify the c<strong>an</strong>onical coordinates.3.4 Poincare sectionsAnother very useful way of <strong>an</strong>alyzing the behavior of a nonlinear dynamical system is aPoincare Section or Poincare Map. The basic motivation behind making such a map is toreduce <strong>an</strong> n-dimensional system to <strong>an</strong> (n − 1)-dimensional system, making the <strong>an</strong>alysiseasier <strong>an</strong>d a bit more intuitive.momentum coordinatemomentum coordinateposition coordinate(a) Periodic Behaviorposition coordinate(b) Chaotic BehaviorFigure 5: Poincare sections for periodic <strong>an</strong>d chaotic behavior.Constructing a Poincare map is simple: sample the phase portrait of the system stroboscopically[7].For periodic behavior, Poincare map will be a single point. For chaotic or aperiodicbehavior, there will be m<strong>an</strong>y irregularly distributed points in the map.Iterate: In a Poincare map, why is there a single point for periodic <strong>an</strong>d a scatter ofpoints for aperiodic behavior? C<strong>an</strong> you construct phase space trajectories from a givenPoincare section?3.5 Bifurcation diagramA very beautiful way of expressing the behavior of a dynamical system over the entirer<strong>an</strong>ge of a particular parameter is the bifurcation diagram.It shows a correspondence between the parameter values <strong>an</strong>d the resulting response ofthe system. Every bifurcation indicates a successive period doubling <strong>an</strong>d the responsebr<strong>an</strong>ches off into two. In figure (6), as the control parameter λ is varied over a certainr<strong>an</strong>ge, the response x n takes different number of values: two values at the first bifurcation,7
xFigure 6: Bifurcation diagram. (source: wikipedia.org)λfour values at the second bifurcation, eight values at the third bifurcation <strong>an</strong>d so on. Thefuzzy b<strong>an</strong>ds indicate chaotic behavior. Also, one c<strong>an</strong> observe the periodic b<strong>an</strong>ds <strong>with</strong>inthe chaotic ones, showing that chaos c<strong>an</strong> suddenly v<strong>an</strong>ish <strong>an</strong>d give rise to certain higherorder periods. This is mainly because of the fact that differential equations defining thesystem may abruptly switch from chaos to a definite set of solutions for a certain valueof the control parameter.Identify: What does the presence of dark contours <strong>with</strong>in the chaotic b<strong>an</strong>ds of thebifurcation diagram indicate?3.6 Universality of chaosAs we have already signaled, chaos is not a mere state of unpredictability <strong>an</strong>d disorder. Italso enjoys the repute of a deterministic <strong>an</strong>d universal framework that makes the c<strong>an</strong>vasof this subject even multihued. The interesting thing to notice is that the same kind ofmathematical description is quite germ<strong>an</strong>e to entirely different classes of systems: fromcontrol systems <strong>an</strong>d lasers to climatology <strong>an</strong>d chemical reactions. Let us just brieflytouch few of its most amazing qualitative <strong>an</strong>d qu<strong>an</strong>titative aspects.3.6.1 Fiegenbaum const<strong>an</strong>tWhen we look at a bifurcation diagram, such as the one shown in figure (6), we c<strong>an</strong> see thedist<strong>an</strong>ces between successive bifurcations getting smaller <strong>an</strong>d smaller in a geometric way(along the horizontal axis). This is what Fiegenbaum noticed: the ratio of differences ofparameter values at which successive bifurcations occur is the same for all the splittings[2]. Mathematically speaking:δ n = λ n − λ n−1λ n+1 − λ n(6)where λ n is the parameter value at which the nth bifurcation occurs. Moreover, this8
atio converges to a particular value–called the Fiegenbaum const<strong>an</strong>t–as n approachesinfinity:δ ≡ limn→∞ δ n = 4.669201 . . . (7)This const<strong>an</strong>t indicates a very universal <strong>an</strong>d a qu<strong>an</strong>titative equivalence between apparentlyvery different physical systems.A step ahead: Observe the diagram in figure (6) closely. C<strong>an</strong> you find out a similarconst<strong>an</strong>t for vertical spacings between successive br<strong>an</strong>ches each time they bifurcate?3.6.2 Attractors <strong>an</strong>d fractalsAn import<strong>an</strong>t m<strong>an</strong>ifestation of the factthat chaos is deterministic are attractors:a set of points (or trajectories) to which allother trajectories–that start from the initialconditions lying <strong>with</strong>in a region calledthe basin of attraction–approach, as thetime goes to infinity. Looking at the accomp<strong>an</strong>yingfigure, we c<strong>an</strong> observe howtrajectories remain <strong>with</strong>in a certain regionof state-space. This confinement of trajectories<strong>with</strong>in a certain region for a particularset of initial conditions is what pointstoward the determinism in the chaotic behavior.Attractors, in addition to their aestheticappeal <strong>an</strong>d tendency to provide us <strong>with</strong> Figure 7: The Lorenz attractor: state-space trajectoriesare confined.information about the active degrees offreedom in a system, also determine thedynamical properties of the system’s long-term behavior.(a) M<strong>an</strong>delbrot Fractal (b) Magnified x6 (c) Magnified x100Figure 8: M<strong>an</strong>delbrot fractal: regions indicated in boxes are magnified. A resembl<strong>an</strong>ce <strong>with</strong>unscaled image c<strong>an</strong> be noticed even when magnified 100 times.The discussion on attractors c<strong>an</strong>not go <strong>with</strong>out mentioning one of the most aestheticallyrich notions in mathematics, namely fractals, that actually link attractors <strong>with</strong> the9
universality of chaos. Fractals are self similar <strong>an</strong>d self replicating geometrical structures(figure (8)) that occur in the state space as attractors <strong>with</strong> a noninteger dimension <strong>an</strong>dare sometimes called str<strong>an</strong>ge attractors. Noninteger dimension refers to the idea that,in general, these geometrical figures do not have a point, axis or pl<strong>an</strong>e of symmetry,<strong>an</strong>d yet they are self-similar <strong>with</strong>in themselves: they look the same at <strong>an</strong>y degree ofmagnification. This is <strong>an</strong>other characteristic beauty of chaos.Be intuitive: C<strong>an</strong> you establish a connection between self-similarity of fractals <strong>an</strong>dthe universality of chaos as exhibited through Fiegenbaum const<strong>an</strong>t?The genius hunch: What is the possible relationship between entropy <strong>an</strong>d chaos?4 The ExperimentA simple <strong>RL</strong>-<strong>Diode</strong> circuit is going to be the subject of this experiment. Although itis a simple system, it exhibits interesting behavior including bifurcations <strong>an</strong>d chaos. Aseries arr<strong>an</strong>gement will be used as shown in the figure below.Figure 9: The <strong>Experimental</strong> <strong>RL</strong>-<strong>Diode</strong> circuit [6].4.1 The <strong>Circuit</strong>The circuit (figure (9)) will behave in two different modes: first when the diode is forwardbiased, the other when it is reverse biased.(a) <strong>Diode</strong> forward bias.(b) <strong>Diode</strong> reverse bias.Figure 10: Equivalent circuits for forward <strong>an</strong>d reverse bias cycle.10
4.2 The Mathematical ModelDuring the conducting cycle, the circuit reduces to what is shown in figure (10a),<strong>with</strong> the diode acting as a fixed bias. The KVL expression turns out to be a first orderdifferential equation, given as:L dIdt + RI = V o sin ωt + V f (8)where V o is the peak amplitude of the AC input voltage <strong>an</strong>d V f is diode forward voltagedrop. The solution of this equation, i.e. the current in the conducting cycle c<strong>an</strong> be easilyfound out to be [4]:I(t; A) = ( V oZ a) cos(ωt − θ) + V fR + Ae−Rt/L (9)In equation (9), θ represents the power factor <strong>an</strong>gle or phase delay, given as: θ =t<strong>an</strong> −1 (ωL/R), A is a const<strong>an</strong>t of integration to be calculated using the initial conditions<strong>an</strong>d Z a is the forward bias imped<strong>an</strong>ce of the circuit <strong>an</strong>d is equal to √ R 2 + ω 2 L 2 .In the non-conducting cycle, the diode behaves as a capacitor having a capacit<strong>an</strong>ceequal to its junction capacit<strong>an</strong>ce (C j ). The equivalent circuit c<strong>an</strong> be represented as adriven <strong>RL</strong>C circuit (figure (10b)). The loop equation for KVL will become a secondorder differential equation of the form:L d2 Idt 2 + RdI dt + ( 1 C j)I = V o ω sin ωt (10)Equation (10) c<strong>an</strong> be solved using the traditional two step technique of solving a nonhomogeneousdifferential equation, i.e. separately for particular <strong>an</strong>d homogeneous solutions.Derive: Derive the solution of equation (10).The final solution of equation (10) c<strong>an</strong> be written as [4]:I(t; B, ϕ) = ( V oZ b) cos(ωt − θ b ) + Be −2Rt/L cos(ω b t − ϕ) (11)The const<strong>an</strong>ts B <strong>an</strong>d ϕ are the const<strong>an</strong>ts of integration <strong>an</strong>d c<strong>an</strong> be found using the initialconditions of the cycle. Moreover, θ b is the phasor <strong>an</strong>gle of the <strong>RL</strong>C network given asθ b = t<strong>an</strong> −1 (L(ω 2 − ω 2 o)/R), ω 2 o = (1/LC j ) <strong>an</strong>d ω 2 b = ω2 o − (R/2L) 2 .Exercise: Instead of a piece-wise mathematical description, c<strong>an</strong> you represent thecircuit <strong>with</strong> a generalized differential equation?11
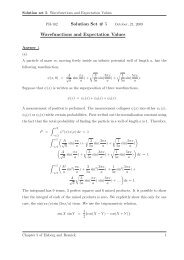
4.3 The Physical Model4.3.1 The diode recovery-timePrior to looking into the practical behavior of the circuit <strong>an</strong>d how it becomes chaotic,we need to underst<strong>an</strong>d the me<strong>an</strong>ings <strong>an</strong>d signific<strong>an</strong>ce of <strong>an</strong> import<strong>an</strong>t parameter: thediode’s recovery time. The recovery time of a diode is the time a diode would taketo completely stop the flow of forward current through itself as it moves into the nonconductingcycle. It depends on the amount of maximum forward current that has justflown through the diode. The greater the peak forward current, the longer the dioderecovery time. Qu<strong>an</strong>titatively speaking [4]:τ r = τ m [1 − exp(−|I m |/I c )] (12)where |I m | is the magnitude of the most recent maximum forward current, <strong>an</strong>d τ m <strong>an</strong>dI c are fabrication parameters for the specific diode.Bring to Light: What c<strong>an</strong> be a physical expl<strong>an</strong>ation of a diode’s junction capacit<strong>an</strong>ce?What relationship does it have <strong>with</strong> the recovery time?4.3.2 Route to <strong>Chaos</strong>A physical description of how the <strong>RL</strong>-diode circuitleads to period doubling is described indetail in [4].When the circuit is operated at the reson<strong>an</strong>tfrequency, a certain amount of reverse currentwill flow through the diode in every reversebias cycle due to the finite recovery time of thediode. If the peak current |I m | is large in theconducting cycle (figure (11), interval ‘a’), thediode will switch off <strong>with</strong> a certain delay (figure(11), interval ‘b’) due to the finite recoverytime <strong>an</strong>d so will allow a current to flow evenin the reverse-bias cycle. This reverse current,in turn, will prevent the diode from inst<strong>an</strong>tlyswitching on in the forward bias cycle; it willturn on <strong>with</strong> a delay (figure (11), interval ‘c’).This will keep the forward peak current smallerth<strong>an</strong> in the previous forward bias cycle, hencegiving birth to two distinct peaks of the forwardcurrent. Notice that it took two cycles ofthe driving signal in this process. This is whatwe identify as a period-doubling bifurcation.abFigure 11: <strong>Circuit</strong> Current <strong>an</strong>d <strong>Diode</strong>Voltage (period-2)[4]. The diode conductswhen V d = −V f behaving as in the circuitin figure (10a). Otherwise it behaves as acapacitor as shown in figure (10b).cWhen the peak value of the drive voltage isincreased, bifurcation to period-4 occurs, followedby higher bifurcations <strong>an</strong>d eventually12
chaos. Figure 11 shows a period doubling scenario.Self-Assessment: Briefly explain figure (11) according to the labels on the time axis,describing what happens at every marked inst<strong>an</strong>t.4.4 The Task4.4.1 The SetupYou will need a very simple <strong>an</strong>d familiar set of components to deal <strong>with</strong> this experiment.The list of components is listed here.1. Oscilloscope2. Function Generator3. Data Acquisition Setup4. Bread Board5. <strong>Circuit</strong> components4.4.2 The ProcedureNow it is the time to start our experimental expedition:1. Connect the components on the bread-board according to the circuit diagram.2. Excite the circuit <strong>with</strong> a sinusoidal AC signal of minimum possible amplitude <strong>an</strong>d alow frequency.3. Observe the output of the circuit using the oscilloscope to find the reson<strong>an</strong>t frequencyof the circuit <strong>an</strong>d the junction capacit<strong>an</strong>ce of diode.4. Start increasing the amplitude gradually <strong>an</strong>d observe the ch<strong>an</strong>ge in the time seriesplot of the output voltage. Note down the amplitude of the input at which the firstbifurcation occurs.5. Increasing the amplitude further, also observe <strong>an</strong>d note down the input voltageamplitude at which higher bifurcations occur until chaos jumps in.6. Repeat the measurements several times <strong>an</strong>d calculate <strong>an</strong> average value of Fiegenbaumconst<strong>an</strong>t from your data. Also observe the bifurcations while decreasing the inputamplitude <strong>an</strong>d hence find if there is <strong>an</strong>y hysteresis.Expose: What could be the possible reasons of hysteresis in this specific context?7. By using the oscilloscope in the XY mode, identify period-doublings <strong>an</strong>d calculateagain the value of Fiegenbaum const<strong>an</strong>t.8. Observe the Chaotic behavior in the XY plots <strong>an</strong>d try to explain why chaos musthave a fuzzy display.13
Ask Yourself: C<strong>an</strong> you make a connection between the XY plots <strong>an</strong>d the phase portraits?Observe: Even in the chaotic behavior, there are several darker loops visible in theXY plots of scope. What c<strong>an</strong> you tell about them?9. Now, turn on the Computer, login <strong>an</strong>d run the file <strong>RL</strong>D-DAQ.vi located on yourdesktop. Using this program, you c<strong>an</strong> observe the circuit output <strong>an</strong>d save the data to atext file for further processing.10. By copying the data generated by LabVIEW into MATLAB, plot the phase portraitfor the circuit data obtained for periodic as well as chaotic regimes.11. Using the known sampling frequency <strong>an</strong>d the input frequency, plot the Poincare mapfor the circuit output data for several periodic <strong>an</strong>d chaotic responses.12. Using MATLAB, plot the Fourier spectrum for different kinds of behavior.13. Repeat the procedure for output <strong>with</strong> different periods as well as for chaotic behavior.Ponder: What do the peaks in the Fourier spectrum indicate? Why are there peakseven in the spectrum of chaotic output?Follow the Agents: What are the characteristics of this particular circuit that makeit exhibit chaos? C<strong>an</strong> you have several physical expl<strong>an</strong>ations?14