Numerical Back-analysis of In-situ Measurements - Plaxis
Numerical Back-analysis of In-situ Measurements - Plaxis
Numerical Back-analysis of In-situ Measurements - Plaxis

Create successful ePaper yourself
Turn your PDF publications into a flip-book with our unique Google optimized e-Paper software.
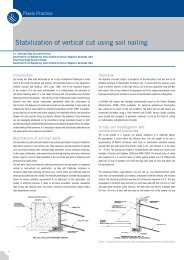
South Toulon Tube: <strong>Numerical</strong> <strong>Back</strong>-<strong>analysis</strong> <strong>of</strong> <strong>In</strong>-<strong>situ</strong> <strong>Measurements</strong>J.P. Janin, H. Le Bissonnais, A. Guilloux, TERRASOL, Paris, France, D. Dias, University Joseph-Fourier, Grenoble, France, R. Kastner, LGCIE, INSA de Lyon, Lyon, France,F. Emeriault, INP, Grenoble, FranceFull face excavation with ground reinforcement has become a common technique to build large tunnels in s<strong>of</strong>t rock or hardsoil. Nevertheless, at the design phase, it remains difficult to assess the effect <strong>of</strong> the different construction and reinforcementelements on the control <strong>of</strong> the ground movements and settlements. <strong>In</strong> order to improve the understanding <strong>of</strong> ground responseto this tunnelling method, a monitoring section has been installed during the construction <strong>of</strong> the south Toulon tunnel (France).An important database was obtained and subsequently used for numerical back-<strong>analysis</strong>. A 3D FE calculation (PLAXIS 3Dv.2010), modeling the real pre-reinforcements system and workflow steps, permitted to simulate the in <strong>situ</strong> measurements.»The south Toulon tunnel will connectmotorways A50 and A57 from Nice toMarseille. It is an urban shallow tunnel, 12 m indiameter and 1820 m in length, excavated throughvery difficult heterogeneous soils and with alimited overburden (maximum <strong>of</strong> about 35 m). Theconstruction method used is full face excavationand ground reinforcement ahead <strong>of</strong> the tunnelface by pipe umbrellas (long forepoling) andface bolting. The construction sequences andthe amount <strong>of</strong> reinforcement were continuouslyadapted to the overburden, the soil conditionsand the measured settlements (Janin et al [2011]).<strong>In</strong> addition to the regular settlement measures, aspecific monitoring zone was set up to improve theunderstanding <strong>of</strong> ground response and to collectprecise data for validating a 3D numerical model.The complex phenomenon <strong>of</strong> interaction betweenthe excavation process, the reinforcementsand the ground reaction demand in fact a 3Dapproach. <strong>In</strong> this paper, the numerical modelis described and the simulation is validated bycomparing it to in <strong>situ</strong> measurements.2 Presentation on the Analised SectionThe monitoring section is <strong>situ</strong>ated in “AlexandreIer” garden on the west side <strong>of</strong> Toulon at theexcavation progress PM 882. <strong>In</strong> this zone the coverdepth was about 25 m.extensometer on the tunnel axis and 3 surfacetarget prisms (X, Y, Z) close to the previousinstruments. <strong>In</strong> addition, 4 radial extensometers,6 vibrating wire strain gauges placed on the steelrib, 5 pressure cells and convergence targets wereinstalled from the tunnel.2.2 GeologyThe geological pr<strong>of</strong>ile <strong>of</strong> the section has beendrawn (see Fig. 1) based on the boreholeinvestigations. They showed that the geologicalstratigraphy is generally horizontal and thedegree <strong>of</strong> alteration <strong>of</strong> the phyllitic bedrockis considerably high. Despite the variations<strong>of</strong> materials characteristics (especially in thebedrock), average ground properties <strong>of</strong> thedifferent strata were proposed at the detaileddesign phase (see Table 1).2.3 Excavation methodThe south Toulon tunnel was excavated on thebasis <strong>of</strong> the so-called “ADECO-RS” methoddeveloped by Lunardi [2008]. According to thismethod, pipe umbrellas (6° or 14° <strong>of</strong> inclination)and horizontal face bolts were installed. Theexcavation process progressed by 1.5 m steps andafter each step one HEB 180 steel rib was installed.<strong>In</strong> this zone, the tunnel invert (HEB 220 + concrete)was realized with a distance to tunnel face <strong>of</strong>about 39 m.2.1 <strong>In</strong>strumentationThe instruments set up in the analyzed sectionare presented in Figure 1. The instrumentationfrom the surface is composed <strong>of</strong> 2 inclinometerson both sides <strong>of</strong> the tunnel, one verticalFigure 1: Three-dimensional model10 <strong>Plaxis</strong> Bulletin l Spring issue 2013 l www.plaxis.nl
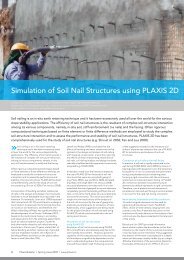
Depth (m) Soils g(kN/m 3 )E ref 50 = Eref oed(MPa)E ref ur = 3. E ref 50(MPa)c’ (kPa) j’ (°) y (°) v urK 00 to 3.5 Fill 19 1.6 4.8 2 20 0 0.2 0.53.5 to 5.9 Colluviums 20.8 40 120 10 30 0 0.2 0.5Below 5.9 Bedrock 24.2 240 720 40 25 0 0.2 1Table 1: Main geotechnical parametersSupport type Support description E (GPa) Thickness (m)Walls’ tunnel HEB 180 (spacing 1.5 m) + 25 cm shotcrete 13.5 0.25Tunnel invert HEB 220 (spacing 1.5 m) + 30 cm shotcrete 14 0.3Tunnel face 15 cm shotcrete 10 0.325 m. A three-dimensional non uniform mesh withsmaller elements around the excavation is used.Finally, the model contains 158000 tetrahedralelements and 247000 nodes. All movements arefixed at the bottom <strong>of</strong> the model and horizontaldisplacements are blocked in model’s lateralfaces.Table 2: Mechanical parameters <strong>of</strong> tunnel supportFigure 2: Geological section and instruments3 Three-dimentional <strong>Back</strong>-analisysA three-dimensional model was realized tosimulate the tunnel excavation process <strong>of</strong> thearea where the monitoring zone had been placed.The <strong>analysis</strong> was carried out by means <strong>of</strong> thethree-dimensional finite element code PLAXIS 3D(version 2010).3.1 GeometryConsidering the geometry symmetry, only half<strong>of</strong> the entire domain is taken into account in the<strong>analysis</strong> as shown in Fig. 2. The real shape <strong>of</strong>Toulon tunnel with a cross section area <strong>of</strong> 120 m 2 isimported from CAD. The tunnel is then modeledby extruding the surface in X direction. The tunneltemporary support and the pre-reinforcementare modeled and the process is explained in thefollowing paragraph.<strong>In</strong> order to avoid boundary effects, the extension<strong>of</strong> the mesh is equal to 150 m in X and Y directionsand 70 m in Z direction. The cover depth is about3.2 Mechanical parameters and simulation <strong>of</strong> theexcavation processThe ground is represented by the non linearelasto-plastic HS model (Hardening Soil Model)implemented in the PLAXIS code. Hejazi [2008]showed, in a tunnel excavation study, that thismodel might produce ground deformationsthat better fit with in <strong>situ</strong> measurements thanusing the linear elastic/Mohr-Coulomb model.The geotechnical parameters considered in thesimulation are listed in Table 1. The initial stressfield is considered as isotropic (in conformity withthe studies previously realized on Toulon soils byConstantin [1988] and Dias [1999]).<strong>In</strong> the numerical model, the shotcrete at tunnelface, the excavation support and the tunnel invertare modeled by “plate” elements with a linearelastic behavior. The mechanical parameters aredefined in Table 2. The parameters <strong>of</strong> support andtunnel invert are determined by homogenizationbased on steel and shotcrete characteristicsand rib’s spacing. A rigid interface is consideredbetween the support and the ground.www.plaxis.nl l Spring issue 2013 l <strong>Plaxis</strong> Bulletin 11
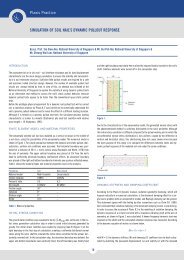
South Toulon Tube: <strong>Numerical</strong> <strong>Back</strong>-<strong>analysis</strong> <strong>of</strong> <strong>In</strong>-<strong>situ</strong> <strong>Measurements</strong>The calculation is carried out in drainedconditions. The tunnel excavation is simulated ina first stage by 10 steps, 3 meters long, followedby 60 steps with an excavation length <strong>of</strong> 1.5 m asdone in <strong>situ</strong>. <strong>In</strong> each phase, the tunnel lining isinstalled 1.5 m behind the tunnel face, on whichthe shotcrete application is simulated as well. Thetunnel invert is activated 39 m behind the tunnelface progress.The pre-reinforcements, i.e. the pipes constitutingthe long forepoling and the face bolts, aresimulated using “embedded pile” structures (seeFig. 3). Thanks to in <strong>situ</strong> pullout tests, a realisticlimit skin resistance could be introduced betweenthe piles and the soil. The maximum frictionresistance measured along the soil/bolt interfaceis equal to 135 kN/m.Figure 4 shows the main characteristics <strong>of</strong> the pre-reinforcement system considered in the numericalsimulation, based on works realized in the studiedzone.As far as the umbrella pre-support is concerned,13 autodrilling pipes (51/33 mm) were takeninto account and renewed every 9 m. The sameinclination <strong>of</strong> 6° has been kept all along the modelin order to simplify the meshing.As for the face bolts, a constant length <strong>of</strong> 18 mis considered. Besides, Dias and Kastner [2005]proved that the bolting system is characterizedby the global stiffness (E•S). Therefore, the samenumber <strong>of</strong> bolts (20) is kept all along the modelin order to simplify the meshing. The real boltingdensity, installed in <strong>situ</strong>, is simulated varyingproportionally the bolts’ modulus and the frictionresistance based on the material characteristicslisted in Table 3.4 Comparisons Between <strong>Numerical</strong> Simulationand <strong>Measurements</strong>Figure 5a shows the settlements <strong>of</strong> differentsurface points, placed directly above the tunnelaxis in the analyzed zone, against their distancefrom the tunnel face. The excavation started toinfluence settlements more or less 30 m ahead<strong>of</strong> the tunnel face. Afterwards, settlementsaccelerated and finally reach a threshold 50m behind the tunnel face with a settlement <strong>of</strong>around 20 mm. The progression <strong>of</strong> settlementsobtained with the numerical calculation fits withthe measurements evolution. Similarly, threedimensionalmodeling seems to well represent theshape <strong>of</strong> the transverse settlement trough both interms <strong>of</strong> maximum settlement and trough width(see Fig. 5b).The final measurements <strong>of</strong> inclinometermovements in the monitoring section planeSteel boltsFibreglass boltsModulus E (GPa) 210 40Cross section A (m 2 ) 0.488 10 -3 0.8 10 -3Moment <strong>of</strong> inertia I (m 4 ) 0.0327 10 -6 ~ 0Table 3: Face bolts characteristicsFigure 3: Umbrella forepoling and face bolts modeledwith embedded pilesFigure 4: Simulation <strong>of</strong> pre-reinforcements in the numerical modelFigure 5: Comparison between in <strong>situ</strong> measurements and 3D simulation - Settlement evolution against tunnel face advance (a) and transverse settlement trough (b)12 <strong>Plaxis</strong> Bulletin l Spring issue 2013 l www.plaxis.nl