seismic response and damage of high-rise buildings
seismic response and damage of high-rise buildings
seismic response and damage of high-rise buildings

You also want an ePaper? Increase the reach of your titles
YUMPU automatically turns print PDFs into web optimized ePapers that Google loves.
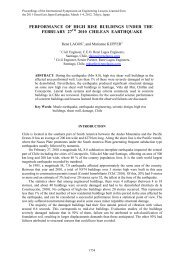
Proceedings <strong>of</strong> the International Symposium on Engineering Lessons Learned fromthe 2011 Great East Japan Earthquake, March 1-4, 2012, Tokyo, JapanSEISMIC RESPONSE AND DAMAGEOF HIGH-RISE BUILDINGS IN TOKYO, JAPAN,DURING THE GREAT EAST JAPAN EARTHQUAKEYoshiaki Hisada 1 , Tetsuo Yamashita 2 , Masahiro Murakami 2 , Tomohiro Kubo 3Jun Shindo 4 , Koji Aizawa 5 , <strong>and</strong> Tatsuhiro Arata 61 Pr<strong>of</strong>essor, School <strong>of</strong> Architecture, Kogakuin University, Tokyo, Japan,hisada@cc.kogakuin.ac.jp2 Associate Pr<strong>of</strong>essor, School <strong>of</strong> Architecture, Kogakuin University, Japan3Assistant Pr<strong>of</strong>essor, School <strong>of</strong> Architecture, Kogakuin University, Japan4Consultant, NKSJ Risk Management, Inc., Japan5Senior Science Officer, Japan Meteorological Agency Japan6Graduate Student, Kogakuin University, Tokyo, JapanABSTRACT: We report <strong>seismic</strong> <strong>response</strong>, <strong>damage</strong> <strong>and</strong> emergency <strong>response</strong> <strong>of</strong> <strong>high</strong>-<strong>rise</strong><strong>buildings</strong> in the Shinjuku Station area in Tokyo, Japan, for the 2011 Great East JapanEarthquake (Mw 9.0), using strong motion data, numerical simulation, <strong>and</strong>questionnaire/hearing surveys. Even though the shaking <strong>of</strong> <strong>buildings</strong> was not very strong<strong>and</strong> there was no structural <strong>damage</strong>, nonstructural elements suffered <strong>damage</strong>: falls <strong>of</strong>ceiling <strong>and</strong> plaster boards, deformation <strong>of</strong> partition walls at <strong>high</strong>er floors <strong>and</strong> so on. Acouple <strong>of</strong> elevators had been stopped for weeks, because <strong>of</strong> twisted cables <strong>and</strong>/or brokenparts.Key Words: 2011 Great East Japan earthquake, Long-Period Ground Motion, High-RiseBuilding, format, Damage <strong>of</strong> Non Structural Elements, Emergency Response,Earthquake Early Warning System, Real-Time Strong Motion Monitoring SystemINTRODUCTIONThe 2011 Great East Japan earthquake (Mw 9.0) paralyzed the function <strong>of</strong> the city <strong>of</strong> Tokyo, such astraffic jams <strong>and</strong> congestions <strong>of</strong> telephones. Even though the ground motion was not very severe inTokyo metropolitan area, where JMA Intensity is about 5, many people were difficult to get home <strong>and</strong>had to stay in the city for all night. Especially, since <strong>high</strong>-<strong>rise</strong> <strong>buildings</strong> shook severely at <strong>high</strong>er floorsby the long-period strong ground motions, many people evacuated from the <strong>buildings</strong>. This causedextremely crowded areas in the downtown districts in Tokyo, <strong>and</strong> rescue <strong>and</strong> fire-fighting activitiescould be difficult for larger earthquakes.In this paper, we report <strong>seismic</strong> <strong>response</strong>, <strong>damage</strong> <strong>and</strong> emergency <strong>response</strong> <strong>of</strong> <strong>high</strong>-<strong>rise</strong> <strong>buildings</strong>in the Shinjuku Station area during the earthquake. The station is the largest in the world; about3,600,000 passengers use trains every day. Among 30 <strong>high</strong>-<strong>rise</strong> <strong>buildings</strong> (more than 100 m) in thearea, digital strong motion data <strong>of</strong> the Kogakuin University <strong>and</strong> adjacent the STEC <strong>buildings</strong> are1110
available for this study (see Picture 1). We simulated <strong>seismic</strong> <strong>response</strong> <strong>of</strong> the Kogakuin building using3D structural model. In addition, we conducted questionnaire <strong>and</strong> hearing surveys for 22 <strong>high</strong>-<strong>rise</strong><strong>buildings</strong> in the area, <strong>and</strong> obtained useful results from 16 building management companies <strong>and</strong> 23tenants.Strong Motion Records <strong>of</strong> High-Rise BuildingSEIMIC RESPONSE OF HIGH-RISE BUILDINSWe explain the structure <strong>and</strong> strong motion records <strong>of</strong> the Shinjuku Campus building <strong>of</strong> KogakuinUniversity. As shown in Figures 1 <strong>and</strong> 2, it is the steel moment frame building with braces <strong>of</strong>29-stories <strong>and</strong> approximately 140 meter height. The natural periods <strong>of</strong> the 1th <strong>and</strong> 2nd modes areabout 3 s <strong>and</strong> 1 s, respectively. Figure 3 shows the locations <strong>of</strong> strong motion seismometers, which arelocated from GL-100m, B6F, <strong>and</strong> up to the top ro<strong>of</strong> floor (29F).On the other h<strong>and</strong>, Picture 1 <strong>and</strong> Figure 3 also show the STEC <strong>of</strong>fice building, which is the next<strong>of</strong> the Campus building, <strong>and</strong> the location <strong>of</strong> strong motion seismometers. The structure is steel momentframe with braces, which is similar to the Campus building, but it is slightly lower with 28-stories <strong>of</strong>about 128 m height.STEC OfficeBuildingKogakuinUniversityShinjukuStationPicture 1 The Shinjuku station Area (Left) <strong>and</strong> the campus building <strong>of</strong> Kogakuin University <strong>and</strong>STEC <strong>of</strong>fice building (Right)38.43.2 3.2 25.6 3.2 3.23.23.23.2NS1NS225.66.4UDEW3.23.23.2Y14X2Fig.1 Structural plan <strong>and</strong> location <strong>of</strong> strong motion seismometers1111
127.84.6 4.3 4.3 4.3 4.3 4.3 4.3 4.3 4.3 4.3 4.0 3.9 4.2 4.0 3.9 3.9 4.3 4.2 4.2 5.5 4.0 4.0 4.0 4.0 4.0 5.24.3 5.1 4.2 4.030F25F20F15F10F5F(a) EW Direction (b) NS DirectionSTECOfficeBuilding28FRo<strong>of</strong>22F15F8FShinjukuCampusBuilding143m29FRo<strong>of</strong>22F16F8F1FB6F[GL-100mFig.2 Structural elevation <strong>of</strong> Kogakuin University building Fig.3 Location <strong>of</strong> strong motion sensors(Note: This Data (ch28) <strong>of</strong> the 8th floor is contaminated by noises)Fig. 4 Accelerations (left) <strong>and</strong> displacements (right) <strong>of</strong> NS2 components from GL-100 m to the Top Floor1112
Table 1 <strong>and</strong> Figures 5 - 6 show the maximum amplitudes <strong>of</strong> the <strong>response</strong> <strong>of</strong> the two <strong>high</strong>-<strong>rise</strong><strong>buildings</strong>, an example <strong>of</strong> recorded waves <strong>of</strong> accelerations <strong>and</strong> displacements, <strong>and</strong> <strong>response</strong> spectraduring the main shock <strong>of</strong> the 2012 Great East Japan earthquake. The maximum amplitudes <strong>of</strong>accelerations, velocities, displacements, <strong>and</strong> <strong>seismic</strong> intensities <strong>of</strong> JMA (Japan Metrological Agency)are about 1 m/s/s, 0.2 m/s, 0.1 m, <strong>and</strong> 4 at the ground level, respectively, whereas those <strong>of</strong> the topfloors are amplified to about 3 m/s/s, 0.7 m/s, 0.37 m, <strong>and</strong> 6. The array <strong>of</strong> the displacements indicatesthe dominance <strong>of</strong> the 1st mode at longer periods, whereas that <strong>of</strong> the accelerations shows thedominance <strong>of</strong> the 2nd mode at shorter periods, because the amplitudes at the 22th floor are smallerthan those <strong>of</strong> the 16th <strong>and</strong> 22th floors.Figure 6 shows the velocity <strong>response</strong> spectra <strong>of</strong> the NS <strong>and</strong> EW components at the 1st <strong>and</strong> 29thfloors <strong>of</strong> the university building. The spectra <strong>of</strong> 1st floor show relatively flat amplitudes at broadperiods, whereas those <strong>of</strong> the 29th floor show distinct natural periods around 3 s <strong>and</strong> 1 s,corresponding to the 1st <strong>and</strong> 2nd modes, respectively.We checked the dependency <strong>of</strong> the natural period on the maximum amplitude <strong>of</strong> the building<strong>response</strong>. Figure 7 shows the natural periods <strong>of</strong> the 1st modes versus the maximum amplitudes <strong>of</strong>velocities <strong>of</strong> the 29th floor. We used the two data sets: one for small earthquakes before the 2012 mainshock, <strong>and</strong> the other for the main-shock <strong>and</strong> after-shocks. The larger the building <strong>response</strong> is, thelonger the natural period becomes. In particular, the former dataset from small earthquakes showsshorter natural periods than those <strong>of</strong> the latter including the main shock. This is probably caused byrelaxing non-structural elements, such as partitions <strong>and</strong> curtain walls during the main-shock.Table 1 Max. amplitudes <strong>of</strong> <strong>of</strong> the Kogakuin <strong>and</strong> STEC <strong>buildings</strong> during 2011 East Japan earthquake(a) Kogakuin University Building(b) STEC Office BuildingFloor 29 25 22 16 8 1 B6F -100m Floor 28 22 15 8 1 B6FRelative EW 30.5 28.7 24.8 - - 0.0 Relative EW 32.7 27.3 18.8 7.8 0.0Displacement NS1 33.7 29.0 25.9 16.9 - 0.0 Displacement NS1 29.7 23.5 15.3 7.0 0.0to1F (cm) NS2 33.5 25.6 16.4 - 0.0 to 1F (cm) NS2 34.9 27.4 17.2 8.7 0.0EW 30.6 26.1 25.1 - - 5.7 6.5 5.8 EW 34.4 28.9 20.5 9.9AbsoluteAbsoluteNS1 34.7 29.9 26.9 17.9 - 6.2 7.1 6.3 NS1 29.0 23.2 15.8 8.3DisplacementDisplacementNS2 35.3 27.4 18.2 - 7.2 7.0 NS2 35.2 28.0 18.3 8.9(cm)(cm)UD 3.5 3.7 3.4 3.3 UD 3.5 3.5EW 234.6 134.7 151.7 - 197.1 91.9 63.3 45.9 EW 161.0 124.7 152.2 154.7Acceleration NS1 291.6 151.4 153.4 232.4 198.2 97.5 56.8 49.5 Acceleration NS1 246.9 125.8 246.0 190.0(cm/s/s) NS2 340.7 159.2 241.9 - 81.6 55.4 (cm/s/s) NS2 302.1 155.8 228.6 159.3UD 183.6 - 37.1 29.1 UD 134.2 37.9JMA Intensity 5.9 5.2 5.1 - - 4.5 4.4 4.1 JMA Intensity 5.6 4.9 5.5 5.3 4.5Note: NS1=West Side, NS2=East SideNote: NS1=East Side, NS2=West SideThe JMA intensities <strong>of</strong> the shaded cells are calculated using the two horizontal components302530floor floor floor floor253025302520202020EWEWEW15151515EW10101010NSNS5555NSNS0000(a) Max (b) Max (c) Max (d) Max-5-5-5-5Acceleration Velocities Displacements JMA Intensity-10-10-10-100 100 200 300 400 0 20 40 60 80 0 10 20 30 40 50 3.0 3.5 4.0 4.5 5.0 5.5 6.0 6.5cm/s/s cm/s cmFig.5 Maximum Accelerations, Velocities, Displacements, <strong>and</strong> the JMA Intensities <strong>of</strong> Kogakuin Univ.1113
velocity (cm/s)6005004003002001000NS Component1F29Fvelocity (cm/s)EW Component10000 1 2 3 4 5 6 7 8 9 10 0 1 2 3 4 5 6 7 8 9 10period (s)period (s)Fig.6 Velocity <strong>response</strong> spectra (h=5%) <strong>of</strong> the campus building <strong>of</strong> Kogakuin University6005004003002001F29F3.153.103.053.002.952.902.852.802.752.702.65period (s)NS(1st Mode)0.01 0.1 1 10Main Shock2007~2011BeforeShocks2011 Main <strong>and</strong>After ShocksMax Velocities (cm/s)3.103.053.002.952.902.852.802.752.702.652.602.552.50period (s)0.01 0.1 1 10EW(1st Mode)Main Shock2007~2011BeforeShocks2011 Main <strong>and</strong>After ShocksMax Velocities (cm/s)Fig.7 Dependency <strong>of</strong> natural periods on the maximum velocities <strong>of</strong> the 29th floor <strong>of</strong> the universitybuilding3D Seismic Response SimulationsWe simulate numerically the <strong>seismic</strong> <strong>response</strong> <strong>of</strong> the Kogakuin building, using a 3D non-linearmoment frame model. Since the stiffness <strong>of</strong> columns is much larger than that <strong>of</strong> beams <strong>and</strong> braces, weassumed that plasticity occurred in beams <strong>and</strong> braces, but not columns. Figure 8 shows the non-linearhysteretic models for the beams <strong>and</strong> the braces. In addition, we assumed the rigidness <strong>of</strong> the floors <strong>and</strong>the panel zones between column <strong>and</strong> beam. We also assumed the fixed columns by neglecting thesoil-structure interaction. We use the Rayleigh-type damping factors <strong>of</strong> 1 % for the 1st <strong>and</strong> 2nd modes,which values were estimated from the forced vibration experiments. The natural periods <strong>of</strong> thesimulation model are about 2.8 s <strong>and</strong> 0.9 s for the 1st <strong>and</strong> 2nd modes, respectively, which are slightlyshorter than those during the main shock.Figure 9 show the comparisons between the recorded <strong>and</strong> simulated waves (accelerations <strong>and</strong>displacements), for the foreshock (2011/3/9 Sanriku-Oki EQ, M7.3) <strong>and</strong> the main shock. Since thenatural periods <strong>of</strong> the simulation model are close to those <strong>of</strong> the building during the foreshock, theresults by the foreshock show good agreements with the observations. On the other h<strong>and</strong>, thesimulated results for the main shock show larger accelerations <strong>and</strong> smaller displacements than those <strong>of</strong>the observations, because <strong>of</strong> the discrepancy <strong>of</strong> the natural periods between the simulation <strong>and</strong> theobservations.1114
Initial BuckingStrengthCompressionTensionFig.8 Non-linear hysteretic models for beams <strong>and</strong> braces <strong>of</strong> the 3D structural model <strong>of</strong> Kogakuin Univ.Acceleration(gal)403020Record Max:7.48gal10Simulation Max:9.70gal0-10100 200 300 Time (sec) 400(a) Foreshock Acceleration: EW ComponentRecord Max:1.15cm403020Record Max:9.00gal10Simulation Max:9.02gal0-10100 200 300 Time(sec) 400NS ComponentFig.9 Observed <strong>and</strong> simulated accelerations <strong>and</strong> displacements <strong>of</strong> the 29th floor for the fore- <strong>and</strong>main-shocksAcceleration(gal)88Record Max:1.44cm664Simulation Max:1.60cm 4Simulation Max:1.44cm2200-2-2100 200 300 Time (sec) 400 100 200 300 Time (sec) 400(b) Foreshock Displacement: EW ComponentNS Component10001000Record Max:234.62galRecord Max:291.64gal500500Simulation Max:212.00galSimulation Max:390.00gal00Displacement(cm)Acceleration(gal)Displacement(cm)-500100 200 300 Time (sec) 400(c) Mainshock Acceleration: EW Component160Record Max:32.33cm800Simulation Max:29.80cmDisplacement(cm)Acceleration(gal)Displacement(cm)-500100 200 300 Time(sec) 400NS Component200Record Max:36.69cm100Simulation Max:27.50cm0-80-100100 200 300 Time (sec) 400 100 200 300 Time (sec) 400(d) Mainshock Displacement: EW ComponentNS ComponentStrong Motion Data <strong>of</strong> Other High-Rise BuildingsTable 2 shows the maximum amplitudes <strong>of</strong> accelerations <strong>and</strong> displacements <strong>of</strong> other <strong>high</strong>-<strong>rise</strong><strong>buildings</strong> in the Shinjuku station area during the 2011 Great East Japan earthquake. Note that thedisplacements for the Shinjuku Center Building (Hosozawa et al., 2011) <strong>and</strong> Tokyo Metropolitan1115
Government Building (Tokyo Metropolitan Government Financial Bureau, 2011) are relative values tothose <strong>of</strong> the 1F <strong>and</strong> B3 floor, respectively. On the other h<strong>and</strong>, those <strong>of</strong> <strong>buildings</strong> A <strong>and</strong> B are absolutevalues. Since the sizes <strong>of</strong> <strong>buildings</strong> A <strong>and</strong> B are similar to those <strong>of</strong> the Kogakuin <strong>and</strong> STEC <strong>buildings</strong>,the results including the JMA intensities are similar (see Table 1 <strong>and</strong> Figure 3). On the other h<strong>and</strong>, thetwo taller <strong>buildings</strong> show the larger <strong>response</strong> <strong>of</strong> the displacements, whereas accelerations do not showlarge differences.Table 2 Max. Amplitudes <strong>of</strong> Strong Motions <strong>of</strong> High-Rise Buildings in the Shinjuku Station Areas(Note: The displacements <strong>of</strong> <strong>buildings</strong> No.1 <strong>and</strong> 2 are relative values with respect to those <strong>of</strong> 1F<strong>and</strong> B3, respectively, whereas those <strong>of</strong> No.3 <strong>and</strong> 3 are absolute values.)No.1234Building NameShinjukuCenter Building(54 Stories)TokyoMetropolitanGovernmentBuilding(48 Stories)A Building(31 Stories)B Building(30 Stories)FloorAcc. (cm/s/s) Disp. (cm) JMANS EW UD NS EW UD Intensity54F 161 236 - 54 49 - -28F 171 113 - 33 26 - -1F 142 94 57 0 0 - -48F 242 288 198 65 66 - -43F 114 136 156 57 54 - -32F 95 117 125 44 39 - -25F 113 141 105 35 31 - -8F 120 89 71 10 9.2 - -1F 91 82 45 0.6 0.7 - -B3 74 73 48 0 0 - -31F 280 239 117 49 35 7.8 5.615F 168 160 83 27 17 7.5 5.21F 155 112 52 14 10 7.7 4.6B5 66 62 47 14 10 7.7 4.430F 184 209 291 38 33 7.3 5.520F 158 157 222 30 24 7.2 5.210F 156 138 122 16 12 7.3 5.22F 109 85 62 10 8.5 7.3 4.5B3 63 71 52 11 8.4 7.3 4.5Systems for Emergency ResponseEMERGENCY RESPONSE AND DAMAGEWe report emergency <strong>response</strong> systems, initial <strong>response</strong> <strong>of</strong> people, <strong>and</strong> <strong>damage</strong> <strong>of</strong> <strong>high</strong>-<strong>rise</strong> <strong>buildings</strong>in the Shinjuku station area. As the case <strong>of</strong> Kogakuin University, Figure 8 shows popup windows <strong>of</strong>the two EEW (Earthquake Early Warning) systems after the 2011 Great East Japan earthquake, whosedata are provided by NIED (Nationl Research Institute for Earth Science <strong>and</strong> Disaster Prevention) <strong>and</strong>JMA (Japan Metrological Agency through Anet Co.). Since the initially estimated magnitude wassmall (7.6 <strong>and</strong> 7.3 by JMA <strong>and</strong> NIED, respectively), <strong>and</strong> the epicentral distance was large (about 390km), the estimated JMA intensity was 3 (the actual intensity was 5). Therefore, the automated warningmessage was not issued. Even this limitation <strong>of</strong> accuracy, we believe that the systems are useful forinitial <strong>response</strong>, especially for the long-period ground motion from far <strong>and</strong> large earthquakes. Figure10(b) shows 100 s <strong>of</strong> the arrival time for the long-period ground motion (surface waves: Kubo et al.,2011), which is enough time for initial <strong>response</strong>, such as the emergency stop <strong>of</strong> elevators <strong>and</strong> issuing awarning announcementsFigure 9 shows the popup window <strong>of</strong> the RMS (Real-Time Strong Motion Monitoring System) <strong>of</strong>Kogakuin University, which shows the real-time information <strong>of</strong> the building <strong>response</strong>: the arrays <strong>of</strong>estimated JMA intensities, <strong>and</strong> drift angles (Kubo, 2011). Using this system, the emergency controlcenter quickly knew that the building was structurally safe, <strong>and</strong> made prompt announcements to stay atsafe places.1116
EstimatedMagnitudeMessages <strong>of</strong>EarthquakeMagnitudeEstimatedIntensityArrival TimerEpicenteSurfaceWaveS WaveP WaveEstimated JMA, Arrival TimeIntensity <strong>of</strong> S Wave(a) EEW by JMA <strong>and</strong> Anet Co.Estimated JMAIntensity(b) EEW by NEED <strong>and</strong> Kogakuin UniversityFig.10 EEW (Earthquake Early Warning System) after the 2012 East Japan earthquake at KogakuinUniversityCampus BuildingKogakuin Univ.EastcmWestReal-Time Monitoring <strong>of</strong>BuildingJMAIntensitycmSouthNorth5+5-5+5+4DriftAngleSTEC OfficeBuildingEastcmWestSouthcmNorthJMAIntensity6-5+5+5-4DriftAngleFig.11 RMS (Real-Time Strong Motion Monitoring System) after the 2012 East Japan earthquake atKogakuin UniversityDamage <strong>of</strong> High-Rise BuildingsEven though there was no severe <strong>damage</strong> in the university building, several non-structural elements<strong>and</strong> equipments suffered <strong>damage</strong>, as shown in Pictures 2: fall <strong>and</strong> deformation <strong>of</strong> ceiling panels <strong>and</strong>plaster boards, deforming <strong>of</strong> partition walls, fall <strong>of</strong> unsettled objects, <strong>and</strong> so on. In addition, anemergency elevator stopped the service for about three weeks, because the main cables were twisted,1117
<strong>and</strong> it was difficult to obtain the replacement parts.We also conducted questionnaire <strong>and</strong> hearing surveys about building <strong>response</strong>, <strong>damage</strong>, <strong>and</strong>emergency <strong>response</strong> at 22 <strong>high</strong>-<strong>rise</strong> <strong>buildings</strong> in the Shinjuku station area, <strong>and</strong> obtained data from 16building management companies <strong>and</strong> 23 tenants. As results, we found that the extent <strong>of</strong> <strong>damage</strong> wasvery similar to that <strong>of</strong> Kogakuin University: the fall <strong>and</strong> deformation <strong>of</strong> non-structural elements <strong>and</strong>equipments, <strong>and</strong> tangled elevator cables (see Picture 2(b)). In addition, there were a couple <strong>of</strong><strong>buildings</strong> which were suffered water leakage from sprinklers, <strong>and</strong> a few people were trapped inelevators, because <strong>of</strong> the activation <strong>of</strong> emergency sensors.Generally, communications between building managers <strong>and</strong> tenants were difficult, because <strong>of</strong> thetelephone lines congestion. Even though there were no severe structural <strong>damage</strong> <strong>of</strong> a building, somemanagers felt difficulty to make an appropriate announcement whether people should stay or evacuatefrom the building, because they could not obtain the information <strong>of</strong> <strong>damage</strong> immediately after theearthquake. This suggests that EEW <strong>and</strong> RMS are effective for emergency management during a bigearthquake.(a) Fall <strong>of</strong> ceiling panels(b) Movement <strong>of</strong> a copy machine (c) Deformation <strong>of</strong> a partition wall(d) Tangled elevator cable (e) Fall <strong>of</strong> unsettled objects (f) Fall <strong>of</strong> cover <strong>of</strong> EJ(g) Evacuees from the Shinjuku (h) Disaster Control Headquarter <strong>of</strong> Univ. (i) Evacuees at Kogakuin Univ.StationPictures 2 Various <strong>damage</strong> <strong>and</strong> situation in <strong>and</strong> around Kogakuin University <strong>and</strong> the Shinjuku stationarea1118