Routinexaxmap (xa, xe, xor, xstp,cstr, nt, ny)yaxmap (ya, ye, yor, ystp)cstr, nt, nx)plots a secondary X-axis.plots a secondary Y-axis.MeaningFigure A.27: Geographical ProjectionsA.28 ContouringRoutineconclr (ncray, n)concrv (xray, yray, n, z)confll (xray, yray, zray, n, i1ray,i2ray, i3ray, ntri, zlvray, nlev)congap (xfac)conlab (copt)conmat (zmat, nx, ny, z)conmod (xfac, xquot)ncrv = conpts (xray, n, yray, m,zmat, zlev, xpts, ypts,maxpts, iray, maxcrv)conshd (xray, nx, yray,ny, zmat, zlray, n)contri (xray, yray, zray, n,i1ray, i2ray, i3ray, ntri, zlev)contur (xray, nx, yray,ny, zmat, zlev)labclr (nclr, ’CONT’)labdis (ndis, ’CONT’)labels (copt, ’CONT’)shdmod (copt, ’CONT’)ncrv = tripts (xray, yray, zray, n,i1ray, i2ray, i3ray, ntri, zlev,xpts, ypts, maxpts, iray, maxcrv)Meaningdefines colours for shaded contours.plots generated contours.plots filled contours of an Delaunay triangulation.affects the spacing between contour lines and labels.defines a character string used for contour labels.plots contours.affects the position of contour labels.generates contours.plots shaded contours.plots contours of an Delaunay triangulation.plots contours.defines the colour of contour labels.defines the distance between labels.defines contour labels.sets the algorithm for shaded contours.generates contours from triangulated data.Figure A.28: ContouringA.29 Image RoutinesRoutineimgbox (nx, ny, nw, nh)imgclp (nx, ny, nw, nh)imgfin ()Meaningdefines a rectangle for PostScript/PDF output.defines a clipping rectangle.terminates transfering of image data.28
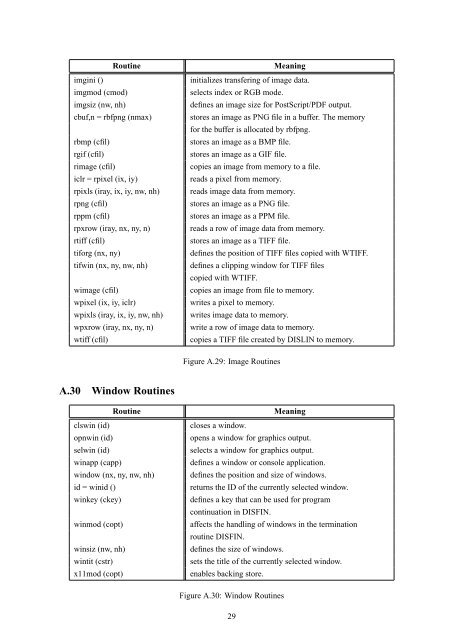
Routineimgini ()imgmod (cmod)imgsiz (nw, nh)cbuf,n = rbfpng (nmax)rbmp (cfil)rgif (cfil)rimage (cfil)iclr = rpixel (ix, iy)rpixls (iray, ix, iy, nw, nh)rpng (cfil)rppm (cfil)rpxrow (iray, nx, ny, n)rtiff (cfil)tiforg (nx, ny)tifwin (nx, ny, nw, nh)wimage (cfil)wpixel (ix, iy, iclr)wpixls (iray, ix, iy, nw, nh)wpxrow (iray, nx, ny, n)wtiff (cfil)Meaninginitializes transfering of image data.selects index or RGB mode.defines an image size for PostScript/PDF output.stores an image as PNG file in a buffer. The memoryfor the buffer is allocated by rbfpng.stores an image as a BMP file.stores an image as a GIF file.copies an image from memory to a file.reads a pixel from memory.reads image data from memory.stores an image as a PNG file.stores an image as a PPM file.reads a row of image data from memory.stores an image as a TIFF file.defines the position of TIFF files copied with WTIFF.defines a clipping window for TIFF filescopied with WTIFF.copies an image from file to memory.writes a pixel to memory.writes image data to memory.write a row of image data to memory.copies a TIFF file created by <strong>DISLIN</strong> to memory.Figure A.29: Image RoutinesA.30 Window RoutinesRoutineclswin (id)opnwin (id)selwin (id)winapp (capp)window (nx, ny, nw, nh)id = winid ()winkey (ckey)winmod (copt)winsiz (nw, nh)wintit (cstr)x11mod (copt)Meaningcloses a window.opens a window for graphics output.selects a window for graphics output.defines a window or console application.defines the position and size of windows.returns the ID of the currently selected window.defines a key that can be used for programcontinuation in DISFIN.affects the handling of windows in the terminationroutine DISFIN.defines the size of windows.sets the title of the currently selected window.enables backing store.Figure A.30: Window Routines29
- Page 2: c○ Helmut Michels, Max-Planck-Ins
- Page 8 and 9: Helmut MichelsMax-Planck-Institut f
- Page 11 and 12: xrayyrayzlvrayis a floatingpoint ar
- Page 13: XRESYRESX3VIEWY3VIEWZ3VIEWX3LENY3LE
- Page 16 and 17: Routinen = pdfbuf (cbuf, nmax)pdfmo
- Page 19 and 20: A.7 Axis SystemsRoutineMeaningaddla
- Page 21 and 22: Routineticpos (copt, cax)timopt ()M
- Page 23 and 24: A.13 Line Styles and Shading Patter
- Page 25 and 26: Routinenx,ny,nz = getscl ()nw,nh =
- Page 27 and 28: Routinen = bitsi4 (nbits, ninp, iin
- Page 29 and 30: A.25 Coloured 3-D GraphicsRoutineax
- Page 31: Routinesurmat (zmat, nx, ny, ixpts,
- Page 35 and 36: Routineswgtxt (id, cval)swgtyp (cty
- Page 37 and 38: Appendix BExamplesThis appendix pre
- Page 39 and 40: 1.00.50.0-0.5-1.0Demonstration of C
- Page 41 and 42: 60Polar Plots90120150301800.2 0.4 0
- Page 43 and 44: Symbols0 1 2 34 5 6 78 9 10 1112 13
- Page 45 and 46: Figure B.4: Logarithmic Scaling41
- Page 47 and 48: Figure B.5: Interpolation Methods43
- Page 49 and 50: Figure B.6: Line Styles45
- Page 51 and 52: 1.00.50.0-0.5-1.0Demonstration of C
- Page 53 and 54: Figure B.8: Shading Patterns49
- Page 55 and 56: 01111131114211531170119113111331134
- Page 57 and 58: Z-axis3602701809003-D Colour Plot o
- Page 59 and 60: Figure B.11: Surface Plot55
- Page 61 and 62: Surface Plot of the Parametric Func
- Page 63 and 64: dislin.labels (’NONE’, ’CONTU
- Page 65 and 66: B.14 Shaded Contour Plot#! /usr/bin
- Page 67 and 68: Shaded Contour PlotF(X,Y) = (X 2 -
- Page 69 and 70: Figure B.15: Pie Charts65
- Page 71: Figure B.16: World Coastlines and L