Discovery Report - Ohio Department of Natural Resources
Discovery Report - Ohio Department of Natural Resources
Discovery Report - Ohio Department of Natural Resources

You also want an ePaper? Increase the reach of your titles
YUMPU automatically turns print PDFs into web optimized ePapers that Google loves.
Project Area Community ListCommunity Name<strong>Ohio</strong>Anna, Village <strong>of</strong> 39X004 Minister, Village <strong>of</strong> 39X082Ansonia, Village <strong>of</strong> 390138 Montgomery County 390775Arcanum, Village <strong>of</strong> 390684 Mutual, Village <strong>of</strong> 390794Auglaize County 390761 New Carlisle, City <strong>of</strong> 390062Beavercreek, City <strong>of</strong> 390876 New Madison, Village <strong>of</strong> 390140Belle Center, Village <strong>of</strong> 390339 North Hampton, Village <strong>of</strong> 390679Bellefontaine, City <strong>of</strong> 390430 North Star, Village <strong>of</strong> 39X096Botkins, Village <strong>of</strong> 390504 Osgood, Village <strong>of</strong> 390141Bradford, Village <strong>of</strong> 390899 Palestine, Village <strong>of</strong> 39X101Casstown, Village <strong>of</strong> 39X021 Phillipsburg, Village <strong>of</strong> 395434Catawba, Village <strong>of</strong> 39X022 Piqua, City <strong>of</strong> 390400Champaign County 390055 Pitsburg, Village <strong>of</strong> 39X104Christiansburg, Village <strong>of</strong> 390056 Pleasant Hill, Village <strong>of</strong> 39X106Clark County 390732 Port Jefferson, Village <strong>of</strong> 390506Clayton, City <strong>of</strong> 390821 Potsdam, Village <strong>of</strong> 39X109Covington, Village <strong>of</strong> 390399 Quincy, Village <strong>of</strong> 390854Darke County 390137 Riverside, City <strong>of</strong> 390416Dayton, City <strong>of</strong> 390409 Rossburg, Village <strong>of</strong> 39X116De Graff, Village <strong>of</strong> 390609 Rushsylvania, Village <strong>of</strong> 39X117Donnellsville, Village <strong>of</strong> 390061 Russells Point, Village <strong>of</strong> 390342Englewood, City <strong>of</strong> 390828 Russia, Village <strong>of</strong> 390880Enon, Village <strong>of</strong> 390795 Shelby County 390503Fairborn, City <strong>of</strong> 390195 Sidney, City <strong>of</strong> 390507Fletcher, Village <strong>of</strong> 390900 South Vienna, Village <strong>of</strong> 39X126Fort Loramie, Village <strong>of</strong> 390830 Springfield, City <strong>of</strong> 390063Gettysburg, Village <strong>of</strong> 390686 St. Paris, Village <strong>of</strong> 390059Greene County 390193 Tipp City, City <strong>of</strong> 390401Greenville, City <strong>of</strong> 390139 Tremont City, Village <strong>of</strong> 390064Hardin County 390250 Trotwood, City <strong>of</strong> 3904171Upper Great Miami Watershed <strong>Discovery</strong> <strong>Report</strong>, June 2011
Huber Heights, City <strong>of</strong> 390884 Troy, City <strong>of</strong> 390402Huntsville, Village <strong>of</strong> 39X056 Urbana, City <strong>of</strong> 390060Jackson Center, Village <strong>of</strong> 390505 Valley Hi, Village <strong>of</strong> 39X138Kettlersville, Village <strong>of</strong> 39X059 Vandalia, City <strong>of</strong> 390418Lakeview, Village <strong>of</strong> 390341 Versailles, Village <strong>of</strong> 390142Laura, Village <strong>of</strong> 390835 Wayne Lakes, Village <strong>of</strong> 390904Lawrenceville, Village <strong>of</strong> 39X062 Waynesfield, Village <strong>of</strong> 39X142Lockington, Village <strong>of</strong> 39X067 West Liberty, Village <strong>of</strong> 390343Logan County 390772 West Milton, Village <strong>of</strong> 390403Ludlow Falls, Village <strong>of</strong> 390838 Yorkshire, Village <strong>of</strong> 39X155Mercer County 390392 Zanesfield, Village <strong>of</strong> 390345Miami County 390398IndianaRandolph County 180429 Union City, Village <strong>of</strong> 1802192Upper Great Miami Watershed <strong>Discovery</strong> <strong>Report</strong>, June 2011
Table <strong>of</strong> ContentsI. Watershed Description ........................................................................................ 4II. Project Description and Methodology ................................................................. 8III. Data Analysis ....................................................................................................... 9i. Data that can be used for Flood Risk Products .................................................. 11ii. Other Data and Information ............................................................................... 13IV. Risk MAP Needs ............................................................................................... 17i. Floodplain Studies ............................................................................................. 17ii. Mitigation Projects ............................................................................................. 18iii. Compliance ........................................................................................................ 18iv. Communications ................................................................................................ 18V. Close .................................................................................................................. 18VI. Appendix – <strong>Discovery</strong> Files .............................................................................. 193Upper Great Miami Watershed <strong>Discovery</strong> <strong>Report</strong>, June 2011
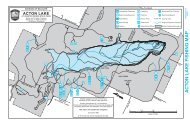
I. Watershed DescriptionThe Upper Great Miami River Watershed is located in southwestern <strong>Ohio</strong>, with a drainagearea <strong>of</strong> 2,513 square miles. The 105 mile-long Great Miami River flows into the <strong>Ohio</strong>River just east <strong>of</strong> the City <strong>of</strong> Cincinnati. The principal tributaries to the Great Miami areMad River, Turtle Creek, and Stillwater River. The headwaters originate in northwesternLogan County and flow in a southwesterly direction through Shelby, Miami andMontgomery Counties. The watershed also drains the majority <strong>of</strong> Champaign and DarkeCounties, along with a small portion <strong>of</strong> Greene County. The limits <strong>of</strong> the <strong>Discovery</strong> projectarea are presented in Figure 1. Table 1 includes the National Flood Insurance Program(NFIP) participation status <strong>of</strong> each community within the Upper Great Miami Watershed.4Upper Great Miami Watershed <strong>Discovery</strong> <strong>Report</strong>, June 2011
Figure 1. Project Area Map5Upper Great Miami Watershed <strong>Discovery</strong> <strong>Report</strong>, June 2011
Table 1. NFIP Participation StatusCounty Community ParticipatingAuglaize County YAuglaize, OH MinsterNWaynesfield NChampaign County YChristiansburg YChampaign, OH MutualYSt. ParisYUrbanaYCatawbaNClark County YDonnelsville NEnonYClark, OHLawrenceville NNew Carlisle YNorth Hampton YSouth Vienna NSpringfieldYTremont City YAnsoniaYArcanumYDarke County YGettysburgYGreenvilleYNew Madison NNorth StarNDarke, OH OsgoodNPalestineNPitsburgNRossburgNUnion CityYVersaillesYWayne Lakes NYorkshireNBeavercreek YGreene, OHFairbornYGreene County YHuber Heights YCounty Community ParticipatingBelle Center NBellefontaine YDe GraffYHuntsvilleNLakeviewYLogan, OHLogan County YQuincyNRushylvania NRussells Point YValley HiNWest Liberty NZanesfieldYMercer, OH Mercer County YBradfordNCasstownNCovingtonYFletcherYLauraYLudlow Falls YMiami, OH Miami County YPiquaYPleasant Hill NPotsdamNTipp CityYTroyYWest Milton YClaytonYDaytonYEnglewoodYHuber Heights YMontgomery, OH Montgomery County YPhillipsburg NRiversideYTrotwoodYVandaliaY6Upper Great Miami Watershed <strong>Discovery</strong> <strong>Report</strong>, June 2011
Table 1. NFIP Participation Status (continued)County Community ParticipatingShelby, OHRandolph, INAnnaBotkinsFort LoramieJackson CenterKettlersvilleLockingtonPort JeffersonRussiaShelby CountySidneyRandolph CountyUnion CityNYNYNNYYYYYY7Upper Great Miami Watershed <strong>Discovery</strong> <strong>Report</strong>, June 2011
II. Project Description and Methodology<strong>Discovery</strong> is the process <strong>of</strong> data collection, including information exchange between allgovernmental levels <strong>of</strong> stakeholders, spatial data presentation, and cooperative discussionwith stakeholders to better understand the area, decide whether a flood risk project isappropriate, and if so, to collaborate on the project planning in detail. At this time,<strong>Discovery</strong> processes and requirements are still being defined; however, draft guidance isavailable from the draft Appendix I – <strong>Discovery</strong> (fall 2010), the draft Meetings Guidancefor FEMA Personnel (October 2010) and the FY11 <strong>Discovery</strong>, Statement <strong>of</strong> Priorities(January 2011). In addition, there are several draft tools and templates at various stages <strong>of</strong>completion that were used to support the effort.Region V initiated a <strong>Discovery</strong> project in February 2011 for the Upper Great MiamiWatershed. The <strong>Discovery</strong> process involved coordination with watershed stakeholders,data collection and analysis, a meeting with stakeholders in the watershed, anddevelopment <strong>of</strong> recommendations for Risk MAP projects based on an analysis <strong>of</strong> data andinformation gathered throughout the process.The initial phase in the <strong>Discovery</strong> process was establishing a Project Team made up <strong>of</strong>local, state, and federal agencies. The Project Team for the Upper Great Miami Watershedincluded representatives from:• FEMA Region V, Risk Analysis Branch• FEMA Region V, Floodplain Management and Insurance Branch• FEMA Region V, Hazard Mitigation Assistance Branch• <strong>Ohio</strong> <strong>Department</strong> <strong>of</strong> <strong>Natural</strong> <strong>Resources</strong> (ODNR)• <strong>Ohio</strong> Emergency Management Agency (OEMA)• STARRProject Team contact information are provided in Appendix A. The Project Team workedtogether to compile the stakeholder list for the Upper Great Miami watershed. <strong>Discovery</strong>Meeting invitations and stakeholder contact list are presented in Appendix B.STARR coordinated with community <strong>of</strong>ficials and other watershed stakeholders throughwritten invitations, phone calls and follow-up emails. The coordination included givingcommunity <strong>of</strong>ficials information about the <strong>Discovery</strong> process. Communities were asked toidentify “Areas <strong>of</strong> Concern” which could be addressed during the <strong>Discovery</strong> Meeting.The second phase <strong>of</strong> the <strong>Discovery</strong> Project was the collection <strong>of</strong> relevant tabular andspatial data for all the communities within the watershed. The data was collected throughonline resources, Federal and State sources, and interviews with cooperating communities.The collected data was used to evaluate both previous and current flooding concerns, while8Upper Great Miami Watershed <strong>Discovery</strong> <strong>Report</strong>, June 2011
determining the vital areas requiring mapping needs. Section III., Data Analysis, providesa more in-depth look at the collected data.The third phase was to hold watershed-wide <strong>Discovery</strong> Meetings and facilitate discussionand data analysis <strong>of</strong> study needs, mitigation project needs, desired compliance support, andlocal flood risk awareness efforts. Two (2) watershed-wide <strong>Discovery</strong> Meetings were heldon May 5, 2011 in Sidney, <strong>Ohio</strong> and Troy, <strong>Ohio</strong>. The discussion was stimulated using the<strong>Discovery</strong> Geodatabase display <strong>of</strong> relevant data. Attendees, including all affectedcommunities and selected other stakeholders, cooperatively identified possible solutionsfor the Areas and Points <strong>of</strong> Concern shown on the <strong>Discovery</strong> Meeting Maps. Solutionsincluded recommendations <strong>of</strong> floodplain studies, mitigation projects, compliance issues,and ideas on how to improve the local flood risk communication programs.Copies <strong>of</strong> the <strong>Discovery</strong> Meeting Presentations, Sign in sheets, Handouts, Meeting Notesand Meeting Feedback Forms are presented in Appendices, D, E, F and G, respectively.The fourth phase <strong>of</strong> the <strong>Discovery</strong> effort involved an analysis <strong>of</strong> the data and informationcollected and discussed at the meeting, and recommendations as to the future relationshipand activities between FEMA and the watershed communities. The Final <strong>Discovery</strong> Map,presented in Appendix H, indicates desired study areas and mitigation project locations,and the <strong>Discovery</strong> <strong>Report</strong> documents the results <strong>of</strong> data collection and conversation.III. Data Analysis<strong>Discovery</strong> data collection entailed a massive collection <strong>of</strong> tabular and spatial data for allstakeholder communities from Federal, State and Local sources. A list <strong>of</strong> the datacollected, the deliverable or product in which the data are included, and the source <strong>of</strong> thedata is presented in Table 2. In addition, Data Analysis is divided between two sections:one section listing the data that can be used for Risk MAP products (regulatory andnon-regulatory) and, one section listing the other data and information that helped theProject Team to form a more holistic understanding <strong>of</strong> this watershed.9Upper Great Miami Watershed <strong>Discovery</strong> <strong>Report</strong>, June 2011
Table 2. Data Collection for Upper Great Miami WatershedData Types Deliverable/ Product SourceInsurance PoliciesCommunity Fact SheetCommunity Information System(CIS)Mitigation Plans Status Community Fact Sheet FEMA Regional Office, OEMAMitigation ProjectsCommunity Fact SheetData.gov: FEMA Hazard MitigationProgram Summary, OEMAOther Hazard PlansCommunity Fact SheetLocal websites, Community Contact,OEMARepetitive LossCommunity Fact SheetCommunity Information System(CIS), OEMAZone B, C, and X ClaimsCommunity Fact SheetCommunity Information System(CIS)Letter <strong>of</strong> Map Change (LOMCs)Community Fact Sheet(known clusters on <strong>Discovery</strong> Map)Community Information System(CIS), Community ContactDeclared DisastersCommunity Fact SheetsData.gov: FEMA DisasterDeclarations SummaryHazardsCommunity Fact SheetsCommunity Information System(CIS)Past flood claims and repetitive losspropertiesCommunity Fact SheetFEMA R5 and/or ODNRHUC-8 Watershed<strong>Discovery</strong> MapUSGS National Hydrography Dataset(NHD)HUC-12 Watersheds<strong>Discovery</strong> MapNational Resource ConservationService (NRCS)Jurisdictional Boundaries <strong>Discovery</strong> Map FEMA and ODNRTribal land boundaries<strong>Discovery</strong> MapUS Census Bureau and/orUSGS National AtlasState lands<strong>Discovery</strong> Map<strong>Ohio</strong> <strong>Department</strong> <strong>of</strong> <strong>Natural</strong><strong>Resources</strong> (ODNR)Federal lands <strong>Discovery</strong> Map USGS National AtlasTransportation Major and Minor<strong>Discovery</strong> Map<strong>Ohio</strong>'s Location Based ResponseSystem (LBRS) and FEMAStream lines<strong>Discovery</strong> MapNational Hydrography Dataset (NHD) and FEMAProtected Areas (USFWS)<strong>Discovery</strong> MapU.S. Fish and Wildlife Service(USFWS)Study Needs<strong>Discovery</strong> MapCoordinated Needs ManagementSystem (CNMS)10Upper Great Miami Watershed <strong>Discovery</strong> <strong>Report</strong>, June 2011
Table 2. Data Collection for Upper Great Miami WatershedData Types Deliverable/ Product SourceTopographic data<strong>Discovery</strong> Map<strong>Ohio</strong> Statewide Imagery Program(OSIP)HAZUS - Average Annualized Loss(AAL)<strong>Discovery</strong> MapSTARRCommunity or Tribal risk assessmentdata<strong>Discovery</strong> MapHAZUSLocal mitigation plans <strong>Discovery</strong> Map OEMAState mitigation plans<strong>Discovery</strong> MapODPS - <strong>Ohio</strong> EmergencyManagement Agency (OEMA)National and Regional flood controlstructures<strong>Discovery</strong> MapUSACERegional flood control structures<strong>Discovery</strong> Map<strong>Ohio</strong> <strong>Department</strong> <strong>of</strong> <strong>Natural</strong><strong>Resources</strong> (ODNR)Stream Gages <strong>Discovery</strong> Map U.S. Geological Survey (USGS)Flooded Structures<strong>Discovery</strong> Map<strong>Ohio</strong> <strong>Department</strong> <strong>of</strong> <strong>Natural</strong><strong>Resources</strong> (ODNR)Effective study data<strong>Discovery</strong> MapFEMA's Regional Flood HazardLayer (RFHL)Orthophotography<strong>Discovery</strong> Map<strong>Ohio</strong> Statewide Imagery Program(OSIP)Contacts Excel spreadsheet Local websites, State/FEMA updatesi. Data that can be used for Flood Risk ProductsTopographic and Imagery DataAs shown on the Final <strong>Discovery</strong> Map, LiDAR elevation data and digitalorthophotography is available for the project area provided by the <strong>Ohio</strong> GeographicallyReferenced Information Program (OGRIP), as part <strong>of</strong> the <strong>Ohio</strong> Statewide ImageryProgram (OSIP). The goal <strong>of</strong> OSIP was to develop and maintain a seamless statewide basemap. OSIP is an initiative partnered by several State Agencies (i.e. ODOT, ODNR)through OGRIP. Data from this project forms the foundation <strong>of</strong> the Statewide base map,and was developed primarily to support multi-use applications, including homelandsecurity, emergency management, economic development, and the business <strong>of</strong>government. The digital orthophotography consists <strong>of</strong> MrSID Images produced at 1-footpixel resolution at a 30:1 compression ratio. The LiDAR elevation data consists <strong>of</strong> DigitalElevation Model (DEM) raster tiles acquired to meet +/- 1-foot vertical accuracy. This issuitable for rectification <strong>of</strong> digital orthophotography and for the creation <strong>of</strong> 2- and 5-footcontours (with the addition <strong>of</strong> 3D compiled breaklines). OSIP products within the UpperGreat Miami Watershed were collected during leaf-<strong>of</strong>f conditions in 2007.11Upper Great Miami Watershed <strong>Discovery</strong> <strong>Report</strong>, June 2011
USGS GagesSTARR has identified several USGS stream gages in the watershed. The locations <strong>of</strong> thegages are shown on the <strong>Discovery</strong> Map and a summary is presented in Table 3.GageNumberTable 3. USGS GagesYears <strong>of</strong> Record(Peaks)Station Name and Location03260325 North Fork Great Miami River near Indian Lake OH 103260450 South Fork Great Miami River near Huntsville OH 103260502 Great Miami River bl Indian Lake at Russells Pt OH 103260700 Bokengehalas Creek near De Graff OH 3503260706 Bokengehalas Creek at De Graff OH 1803260800 Stony Creek near De Graff OH 1803261500 Great Miami River at Sidney OH 9703261950 Loramie Creek near Newport OH 4503262000 Loramie Creek at Lockington OH 9503262700 Great Miami River at Troy OH 4803262750 Millers Ditch at Tipp City OH 1703263000 Great Miami River at Taylorsville OH 9303263100 Poplar Creek near Vandalia OH 3103263168 Stillwater River near Ansonia OH 803263700 Bridge Creek near Greenville OH 3103264000 Greenville Creek near Bradford OH 7903265000 Stillwater River at Pleasant Hill OH 9403265100 Hog Run tributary at Laura OH 2803266000 Stillwater River at Englewood OH 8503266500 Mad River at Zanesfield OH 3303266560 Mad River at West Liberty OH - 03266560 1403267000 Mad River near Urbana OH 7603267900 Mad River at St Paris Pike at Eagle City OH 4203267950 Buck Creek near New Moorefield OH 903267960 East Fork Buck Creek near New Moorefield OH 903268000 Buck Creek at New Moorefield OH 1703268300 Beaver Creek at Brighton OH 1903268500 Beaver Creek near Springfield OH 2103269000 Buck Creek at Springfield OH 5703269500 Mad River near Springfield OH 9903270000 Mad River near Dayton OH 9612Upper Great Miami Watershed <strong>Discovery</strong> <strong>Report</strong>, June 2011
Average Annualized Loss (AAL) DataFEMA has conducted a Level 1 Hazus flood analysis to determine average annualizedlosses (AAL) for the project area. This analysis was based on USGS 30-meter DEM dataand Hazus s<strong>of</strong>tware default inventory data. The Hazus riverine hydrology analysis useddefault USGS regression equations to estimate the peak flows for selected return periodsand the USGS topographic data to conduct normal depth calculations for flood depth grids.The loss estimation for the AAL data was then conducted to produce loss calculations atthe U.S. census block level.The AAL data is symbolized on the <strong>Discovery</strong> Map as varying levels <strong>of</strong> risk. During the<strong>Discovery</strong> meeting, the Level 1 analysis results were validated by stakeholders to identifypotential sites for Refined Analyses.ii.Other Data and InformationMitigation Plans/Status, Mitigation ProjectsHazard Mitigation Plans (HMPs) are prepared to assist communities to reduce their risk tonatural hazard events. The plans are used to develop strategies for risk reduction and toserve as a guide for all mitigation activities in the given county or community. Theavailable HMPs obtained and reviewed for this <strong>Discovery</strong> Project are presented in Table 4.County/CommunityTable 4. Hazard Mitigation Plan StatusHazusHazardMitigation PlanIssueDateExpirationDateAuglaize County N Y 2008 2013Champaign County N Y 2006 2012Clark County N Y 2006 2013Darke County N Y 2006 2011Greene County N Y 2007 2012Hardin County N Y 2006 2011Logan County N Y 2005 2010Mercer County N Y 2006 2011Miami County Y Y 2006 2011Montgomery County N Y 2007 2012Shelby County N Y 2006 2011Critical facilities are the facilities that can impact the delivery <strong>of</strong> vital services, causegreater damages to other sectors <strong>of</strong> a community, or put special populations at risk. Theassessment <strong>of</strong> the flood risk posed to critical facilities within the watershed is an importantaspect <strong>of</strong> the HMPs. Critical facilities that are located within the 1-percent-annual-chancefloodplain were quantified and identified as at-risk structures. The exact number <strong>of</strong> criticalfacilities that are considered at-risk is not quantifiable due to the limited detail presented in13Upper Great Miami Watershed <strong>Discovery</strong> <strong>Report</strong>, June 2011
the HMPs. The number <strong>of</strong> critical facilities estimated to be within the 1-percent-annualchancefloodplain was determined by overlaying Hazard Maps included in the HMP’s withthe latest flood hazard data. However, the risk <strong>of</strong> flood damage is limited by the detail andaccuracy <strong>of</strong> the most recent flood map. An estimated total <strong>of</strong> 48 critical facilities within thewatershed are considered at-risk and should be identified as an Area <strong>of</strong> Mitigation Interest.A repetitive loss structure is a term associated with the National Flood Insurance Program(NFIP). For Flood Mitigation Assistance (FMA) program purposes, a repetitive lossstructure is one that is covered by a flood insurance contract under the NFIP, that hassuffered flood damage on two or more occasions over a 10-year period, ending on the datewhen a second claim is made, in which the cost to repair the flood damage, on average,equals or exceeds 25% <strong>of</strong> the market-value <strong>of</strong> the structure at the time <strong>of</strong> each flood lossevent. In terms <strong>of</strong> the Community Rating System (CRS) <strong>of</strong> the NFIP, a repetitive lossproperty is any property, which the NFIP has paid two or more flood claims <strong>of</strong> $1,000 ormore, in any given 10-year period since 1978. A repetitive loss structure is important to theNFIP, since structures that flood frequently put a strain on the flood insurance fund. Itshould also be important to a community because <strong>of</strong> the disruption and threat to residents’lives by the continual flooding.Specific details regarding repetitive loss structures within the floodplain were not madeavailable in the available HMPs. The locations <strong>of</strong> repetitive loss structures presented on the<strong>Discovery</strong> Map were determined by rectifying the HMP’s Hazard Maps to the <strong>Discovery</strong>Map basemap data. The exact locations and numbers <strong>of</strong> repetitive loss structures have beensummarized with caution due to the lack <strong>of</strong> detail in the HMPs and Hazard Maps. Areasthat have suffered multiple repetitive losses are some <strong>of</strong> the most important areas <strong>of</strong>mitigation interest. The total number <strong>of</strong> repetitive loss structures within the watershed is58.Numerous locations <strong>of</strong> roads overtopping during flood events were identified during thedata collection and <strong>Discovery</strong> Meeting process.Numerous dams exist within the watershed, but are not mentioned in the HMPs as floodcontrol structures. According to the ODNR database, seventeen (17) Class I dams arelocated within the watershed and owned/operated by state or federal agencies.The overall goals <strong>of</strong> the reviewed HMP’s were found to be consistent; however, specificmethods for implementation <strong>of</strong> these goals and locations <strong>of</strong> specific projects were notreadily available. These goals include:• Educate the citizens <strong>of</strong> each county to increase awareness <strong>of</strong> flooding and where toseek safety during flood events• Provide adequate shelters where citizens can seek safety from severe weather andflooding• Improve the warning systems and radio communications throughout the county14Upper Great Miami Watershed <strong>Discovery</strong> <strong>Report</strong>, June 2011
• Expedite the clean up process through coordination and equipment acquisition• Update countywide NFIP maps• Purchase or flood pro<strong>of</strong> repetitive loss structures• Develop map <strong>of</strong> infrastructure concernsSome <strong>of</strong> the county’s/community’s HMPs included the locations and number <strong>of</strong> repetitiveloss structures while other plans left this information out. This inconsistency in informationholds true with the location and number <strong>of</strong> critical facilities found within the 1-percentannual-chancefloodplain.An example <strong>of</strong> a recent mitigation project that has occurred within the Upper Great MiamiWatershed was an acquisition <strong>of</strong> residential properties along the Russels Point spillwayalong Indian Lake. These properties were located within the 1-percent-annual-chancefloodplain and had sustained substantial damage during a number <strong>of</strong> flood events. Theproject was funded by several grants from the Hazard Mitigation Grant Program for theacquisition and removal <strong>of</strong> structures in the problem area.Coordinated Needs Management Strategy (CNMS) and NFIP Mapping Study NeedsAnalysis <strong>of</strong> the CNMS data for the Upper Great Miami Watershed is complete. Analyzedstudies have been identified as “VALID” or “INVALID”. The current CNMS geospatialdata is presented on the Final Discover Map.Socio-Economic AnalysisDevelopment within the Upper Great Miami Watershed ranges from very developed torural. The majority <strong>of</strong> the land within the watershed west <strong>of</strong> the Upper Great Miami isdeveloped, especially near its confluence with the <strong>Ohio</strong> River, while the eastern portion <strong>of</strong>the watershed is still relatively undeveloped with narrow steep valleys. Approximately 1.7million residents live within the Upper Great Miami Watershed (2010 Census). Themedian age in the watershed is in the mid 30’s, and around 10% <strong>of</strong> the population over 65years old. Between 2-5% are non-English speakers, and less than 1% are Native American.Approximately 85% <strong>of</strong> the population graduated high school, and about 10% have acollege degree. Around 60% <strong>of</strong> residents over the age <strong>of</strong> 16 that desired employment wereworking, with a median income between $27,000 and $34,000 annually. The top threeindustries employing residents include:• Manufacturing• Educational, health, and social services• Retail trade.Community Rating System (CRS)There are no communities in the Upper Great Miami River Watershed that participate inthe CRS program.15Upper Great Miami Watershed <strong>Discovery</strong> <strong>Report</strong>, June 2011
LeveesWithin the Upper Great Miami Watershed, several levees exist. The majority <strong>of</strong> the leveesin the watershed are along the Great Miami River existing in the Dayton, Piqua, Troy, TippCity, Vandalia and Huber Heights municipalities. Other levee systems include the MadRiver and the Stillwater River systems in the City <strong>of</strong> Dayton.Floodplain Management/CAVsBased on information provided by ODNR, the following communities have open CAV’s:Village <strong>of</strong> Arcanum, City <strong>of</strong> Beavercreek, City <strong>of</strong> Bellefontaine, Greene County, LoganCounty, Village <strong>of</strong> Russells Point, City <strong>of</strong> Sidney, and City <strong>of</strong> Springfield.Regulatory MappingA number <strong>of</strong> communities within the Upper Great Miami Watershed have had recentcountywide map updates as part <strong>of</strong> FEMA’s Map Modernization Program. The effectivedates <strong>of</strong> the most recent county-wide projects are presented on the <strong>Discovery</strong> Map andbelow in Table 5. The effective data is a combination <strong>of</strong> both detailed and approximateanalysis with varying vintage dates.Table 5. Map Modernization ActivityCounty Status Effective DateAuglaize, OH Unmodernized N/AChampaign, OH Effective 11/18/2009Clark, OH Effective 2/17/2010Darke, OH LFD 1/18/2011 N/AGreene, OH Effective 3/17/2011Hardin, OH Unmodernized N/ALogan, OH Unmodernized N/AMercer, OH Unmodernized N/AMiami, OH LFD 2/2/2011 N/AMontgomery, OH Effective 1/6/2005Randolph, IN Preliminary N/AShelby, OH Unmodernized N/ACommunity Fact SheetsTo help guide the data analysis process, a Fact Sheet was developed for each communitywithin the watershed (Appendix H). Each Fact Sheet summarizes the demographic, social,and industrial characteristics and flood-study information for each community.16Upper Great Miami Watershed <strong>Discovery</strong> <strong>Report</strong>, June 2011
IV. Risk MAP NeedsThe results <strong>of</strong> the data collection and analysis were thoroughly discussed at the <strong>Discovery</strong>Meeting. The following sections include issues and situations that exist in the Upper GreatMiami Watershed communities that can be considered Risk MAP Needs, to be addressedwith Risk MAP projects. Details and background on all issues can be found in the interviewnotes, meeting notes, and other files included in the appendices.i. Floodplain StudiesA number <strong>of</strong> the counties located in the Upper Great Miami Watershed have undergonerecent countywide DFIRM projects; however, not all <strong>of</strong> these projects included new ZoneA studies.As shown on the Final <strong>Discovery</strong> Map, recent LiDAR and imagery data meeting FEMA’sGuidelines and Specifications have been developed for the entire <strong>Discovery</strong> Project Area.As shown on the Final <strong>Discovery</strong> Map, numerous study reaches have been classified as“INVALID” during the CNMS process.At the <strong>Discovery</strong> Meeting, several areas were identified by community <strong>of</strong>ficials as needingan updated detailed or approximate study.Based on the results <strong>of</strong> the Stakeholder Coordination, Data Analysis and <strong>Discovery</strong>Meeting, proposed Study Areas in the Upper Great Miami have been identified in Table 6.Table 6. Mapping NeedsSTUDY LENGTHFLOODING SOURCESTUDY TYPE(miles)Bokengehalas Creek 13.7 DETAILEDBlue Jacket Creek 7.9 DETAILEDGreat Miami River 27.9 DETAILEDGreat Miami River 19.2 APPROXIMATEGreenville Creek 6.0 APPROXIMATEHebble Creek 2.8 DETAILEDHulls Creek 4.0 DETAILEDIsland No. 3 Tributary 8.0 DETAILEDLeatherwood Creek 4.6 DETAILEDLilly Creek 1.2 DETAILEDLoramie Creek 24.5 DETAILEDMad River 17.7 DETAILEDMad River 10.5 UNSTUDIED17Upper Great Miami Watershed <strong>Discovery</strong> <strong>Report</strong>, June 2011
FLOODING SOURCESTUDY LENGTH(miles)STUDY TYPEMad River (Right Overbank) 2.2 DETAILEDMoore Run 3.3 DETAILEDPlum Creek 6.8 DETAILEDPossum Run 1.9 DETAILEDRush Creek 3.4 DETAILEDSouth Fork Great Miami River 10.7 APPROXIMATEStillwater River 14.5 APPROXIMATESwanders Creek 1.5 DETAILEDii.Mitigation Projectsiii.iv.Loramie Creek was found to be “INVALID” in CNMS, due in part to a change in thenumber <strong>of</strong> hydraulic structures and differing updated and effective discharges. A number<strong>of</strong> community <strong>of</strong>ficials noted increased development and channel reconfiguration inmultiple areas along this stream.Several locations <strong>of</strong> overtopping roads and undersized culverts were identified by thecommunities.ComplianceWhile several communities have open CAV’s no Risk MAP Needs regarding complianceissues were identified.CommunicationsThe local <strong>of</strong>ficials were all interested in learning more about how to provide flood riskinformation to residents. Community representatives indicated the need to be keptinformed about the results <strong>of</strong> the <strong>Discovery</strong> process and opportunities for public inputthroughout the process.V. CloseLocal <strong>of</strong>ficials in the communities were interested in the <strong>Discovery</strong> process and Risk MAPand open to learning more about how they can begin to develop resiliency to flood events.They identified several areas for map updates and areas in which they could use additionalFEMA support. The information gathered in the <strong>Discovery</strong> process provided invaluableinformation for analyzing and identifying the most flood-prone and at-risk areas. Local<strong>of</strong>ficials will now be more aware <strong>of</strong> risks in their area, and state and federal agencies willbe able to focus their resources on the most feasible projects. The local <strong>of</strong>ficials in theUpper Great Miami Watershed would benefit from the implementation <strong>of</strong> Risk MAPprojects.18Upper Great Miami Watershed <strong>Discovery</strong> <strong>Report</strong>, June 2011
VI. Appendix – <strong>Discovery</strong> FilesThe <strong>Discovery</strong> <strong>Report</strong> appendices are stored digitally under their respective folders on theMIP at:\05090202\<strong>Discovery</strong>\Project_<strong>Discovery</strong>_Initiation\<strong>Discovery</strong>_<strong>Report</strong>\Appendix A - Project Team Contact Information & Meeting MinutesAppendix B - Stakeholder Contact Information & Meeting InvitationsAppendix C - <strong>Discovery</strong> Meeting PresentationsAppendix D - <strong>Discovery</strong> Meeting Sign-In Sheets & HandoutsAppendix E - <strong>Discovery</strong> Meeting Notes & CommentsAppendix F - <strong>Discovery</strong> Meeting Participant FeedbackAppendix G - <strong>Discovery</strong> MapsAppendix H - Community Fact Sheets19Upper Great Miami Watershed <strong>Discovery</strong> <strong>Report</strong>, June 2011