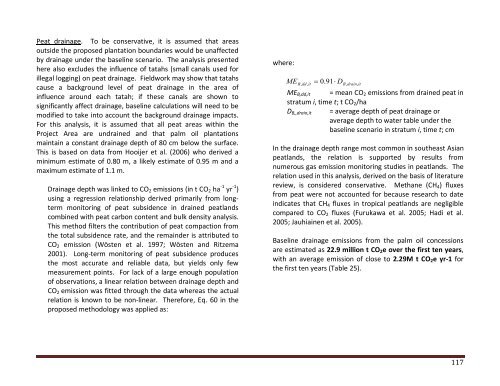
Peat drainage. To be conservative, it is assumed that areasoutside the proposed plantation boundaries would be unaffectedby drainage under the baseline scenario. <strong>The</strong> analysis presentedhere also excludes the influence of tatahs (small canals used forillegal logging) on peat drainage. Fieldwork may show that tatahscause a background level of peat drainage in the area ofinfluence around each tatah; if these canals are shown tosignificantly affect drainage, baseline calculations will need to bemodified to take into account the background drainage impacts.For this analysis, it is assumed that all peat areas within the<strong>Project</strong> Area are undrained and that palm oil plantationsmaintain a constant drainage depth of 80 cm below the surface.This is based on data from Hooijer et al. (2006) who derived aminimum estimate of 0.80 m, a likely estimate of 0.95 m and amaximum estimate of 1.1 m.Drainage depth was linked to CO 2 emissions (in t CO 2 ha -‐1 yr -‐1 )using a regression relationship derived primarily from long-termmonitoring of peat subsidence in drained peatlandscombined with peat carbon content and bulk density analysis.This method filters the contribution of peat compaction fromthe total subsidence rate, and the remainder is attributed toCO 2 emission (Wösten et al. 1997; Wösten and Ritzema2001). Long-‐term monitoring of peat subsidence producesthe most accurate and reliable data, but yields only fewmeasurement points. For lack of a large enough populationof observations, a linear relation between drainage depth andCO 2 emission was fitted through the data whereas the actualrelation is known to be non-‐linear. <strong>The</strong>refore, Eq. 60 in theproposed methodology was applied as:where:MEB, dd , it 0.91DB,drain,itME B,dd,it = mean CO 2 emissions from drained peat instratum i, time t; t CO 2 /haD B,,drain,it = average depth of peat drainage oraverage depth to water table under thebaseline scenario in stratum i, time t; cmIn the drainage depth range most common in southeast Asianpeatlands, the relation is supported by results fromnumerous gas emission monitoring studies in peatlands. <strong>The</strong>relation used in this analysis, derived on the basis of literaturereview, is considered conservative. Methane (CH 4 ) fluxesfrom peat were not accounted for because research to dateindicates that CH 4 fluxes in tropical peatlands are negligiblecompared to CO 2 fluxes (Furukawa et al. 2005; Hadi et al.2005; Jauhiainen et al. 2005).Baseline drainage emissions from the palm oil concessionsare estimated as 22.9 million t CO 2 e over the first ten years,with an average emission of close to 2.29M t CO 2 e yr-‐1 forthe first ten years (Table 25).117
Year of<strong>Project</strong>Area burnedyr-‐1Table 25. Emission from peat drainage associated with palm oil plantationsAnnual CO 2 e emissions from peat drainage (t CO 2 e yr-‐1)Concession 1Borneo Eka SawitTangguhConcession 2Graha Indo SawitAndal TunggalConcession 3Wahana AgroTama MakmurConcession 4<strong>Rimba</strong> SawitUtama PlanindoAnnual total (tCO 2 e yr -‐1)CumulativeTotal (t CO 2 e)1 2,000 182,000 0 0 0 182,000 182,0002 6,000 364,000 182,000 0 0 546,000 728,0003 12,000 546,000 364,000 182,000 0 1,092,000 1,820,0004 20,000 728,000 546,000 364,000 182,000 1,820,000 3,640,0005 26,986 817,738 728,000 546,000 364,000 2,455,738 6,095,7386 31,843 817,738 910,000 623,987 546,000 2,897,725 8,993,4647 35,843 817,738 1,092,000 623,987 728,000 3,261,725 12,255,1898 38,346 817,738 1,137,773 623,987 910,000 3,489,498 15,744,6889 39,725 817,738 1,137,773 623,987 1,035,489 3,614,987 19,359,67510 39,725 817,738 1,137,773 623,987 1,035,489 3,614,987 22,974,66211 39,725 817,738 1,137,773 623,987 1,035,489 3,614,987 26,589,65012 39,725 817,738 1,137,773 623,987 1,035,489 3,614,987 30,204,63713 39,725 817,738 1,137,773 623,987 1,035,489 3,614,987 33,819,62514 39,725 817,738 1,137,773 623,987 1,035,489 3,614,987 37,434,61215 39,725 817,738 1,137,773 623,987 1,035,489 3,614,987 41,049,60016 39,725 817,738 1,137,773 623,987 1,035,489 3,614,987 44,664,58717 39,725 817,738 1,137,773 623,987 1,035,489 3,614,987 48,279,57418 39,725 817,738 1,137,773 623,987 1,035,489 3,614,987 51,894,56219 39,725 817,738 1,137,773 623,987 1,035,489 3,614,987 55,509,54920 39,725 817,738 1,137,773 623,987 1,035,489 3,614,987 59,124,53721 39,725 817,738 1,137,773 623,987 1,035,489 3,614,987 62,739,52422 39,725 817,738 1,137,773 623,987 1,035,489 3,614,987 66,354,51123 39,725 817,738 1,137,773 623,987 1,035,489 3,614,987 69,969,49924 39,725 817,738 1,137,773 623,987 1,035,489 3,614,987 73,584,48625 39,725 817,738 1,137,773 623,987 1,035,489 3,614,987 77,199,47426 39,725 817,738 1,137,773 623,987 1,035,489 3,614,987 80,814,46127 39,725 817,738 1,137,773 623,987 1,035,489 3,614,987 84,429,44828 39,725 817,738 1,137,773 623,987 1,035,489 3,614,987 88,044,43629 39,725 817,738 1,137,773 623,987 1,035,489 3,614,987 91,659,42330 39,725 817,738 1,137,773 623,987 1,035,489 3,614,987 95,274,411Totals 23,081,199 29,990,779 16,691,675 25,510,758 95,274,411118
- Page 1 and 2:
The Rimba Raya Biodiversity Reserve
- Page 3 and 4:
AcknowledgementsWith Special Recogn
- Page 5 and 6:
ContentsContents ..................
- Page 7 and 8:
BIODIVERSITY SECTION ..............
- Page 9 and 10:
GLOSSARY OF PROJECT SPECIFIC TERMSC
- Page 11 and 12:
REDD, which is necessarily conserva
- Page 13 and 14:
Rehabilitation Center (OFI), home t
- Page 15 and 16:
estricted-‐range, or otherwise
- Page 17 and 18:
HydrologyWatersheds in the Project
- Page 19 and 20:
SoilA soil map for the Project Zone
- Page 21 and 22:
ClimateRainfall in the Project Zone
- Page 23 and 24:
Compositionally, freshwater swamps
- Page 25 and 26:
selective logging, intensive loggin
- Page 27 and 28:
G1.3. Boundaries of the Project Are
- Page 29 and 30:
Communities in the Project ZoneThe
- Page 31 and 32:
Delineation of the Project Zone. To
- Page 33 and 34:
the project and recommending that t
- Page 35 and 36:
During the ground surveys, aerial s
- Page 37 and 38:
Stratification by Peat Distribution
- Page 39 and 40:
G1.5. Description of Project Zone C
- Page 41 and 42:
Only a few of the communities have
- Page 43 and 44:
livelihoods, providing protection f
- Page 45 and 46:
Similar to the other villages along
- Page 47 and 48:
company. On average, farmers and fi
- Page 49 and 50:
categories: housing, office, agricu
- Page 51 and 52:
Table 6. Current Community Conflict
- Page 53 and 54:
and six are Vulnerable (VU). CR spe
- Page 55 and 56:
eight are listed as Vulnerable. Eig
- Page 57 and 58:
2004). These losses highlight the i
- Page 59 and 60:
small mammal species richness decli
- Page 61 and 62:
even fewer forest species than plan
- Page 63 and 64:
Other threats to biodiversityAdditi
- Page 65 and 66:
HCV1.1Table 8. Preliminary evaluati
- Page 67 and 68:
of water supplies and prevention of
- Page 69 and 70:
ladang agriculture, scrub, short se
- Page 71 and 72:
Table 11. Critically Endangered Hig
- Page 73 and 74:
d. areas that support significant c
- Page 75 and 76: G1.8.2. Significant Large Landscape
- Page 77 and 78: It is possible that a degree of per
- Page 79 and 80: The revised Toolkit for Indonesia i
- Page 81 and 82: the assessment area; and second, an
- Page 83 and 84: HCV 4.3HCV 4.3 aims to identify and
- Page 85 and 86: Within the Project Area and neighbo
- Page 87 and 88: G1.8.6. Areas Critical for Traditio
- Page 89 and 90: In 2004, five oil palm estates were
- Page 91 and 92: Figure 23. Comparison of the new dr
- Page 93 and 94: Table 15. Extent of Overlap w/ Oil
- Page 95 and 96: Baseline analysis: LandcoverIn orde
- Page 97 and 98: All survey data has been entered in
- Page 99 and 100: For a complete report on the Carbon
- Page 101 and 102: Identification of Baseline Scenario
- Page 103 and 104: Under Indonesian legislation, Law (
- Page 105 and 106: drained due to the realization that
- Page 107 and 108: conversion for urban, rural, and in
- Page 109 and 110: to 2002. Furthermore, deforestation
- Page 111 and 112: Local Perspective. Tanjung Puting N
- Page 113 and 114: Table 17. 2000-‐2008 Palm Oil E
- Page 115 and 116: Provincial Government Targets Rimba
- Page 117 and 118: to recovery from past disturbance,
- Page 119 and 120: StratumTable 20. Calculations of CO
- Page 121 and 122: Year ofProjectArea loggedyr-‐1T
- Page 123 and 124: GHG removals from oil palm sequestr
- Page 125: Year ofProjectArea burnedyr-‐1T
- Page 129 and 130: Yr ofProjectTable 26. Net baseline
- Page 131 and 132: environmental impacts and the need
- Page 133 and 134: triggered by palm-‐oil companie
- Page 135 and 136: G3. Project Design and GoalsG3.1. S
- Page 137 and 138: elements and an assessment of the P
- Page 139 and 140: habitat in terms of canopy and food
- Page 141 and 142: Funding of OFI activitiesTanjung Pu
- Page 143 and 144: interventions can improve the poor
- Page 145 and 146: Community Agro-‐Forestry. In ke
- Page 147 and 148: The only requirement is to pump the
- Page 149 and 150: The Rimba Raya project proponents i
- Page 151 and 152: www.kiva.org as highly reputable fi
- Page 153 and 154: purchases more than $24 million dol
- Page 155 and 156: The comparative analysis will be us
- Page 157 and 158: G3.4. Project Lifetime, Accounting
- Page 159 and 160: Table 28. Rimba Raya Implementation
- Page 161 and 162: 2-‐Establishment ofRimba RayaRe
- Page 163 and 164: 6-‐Development ofSocial Buffer2
- Page 165 and 166: 7-‐Outreach andEducation3-‐
- Page 167 and 168: Pembuang Hulu and Tanjung Hanau reg
- Page 169 and 170: .7. Determination of the need for s
- Page 171 and 172: elationship with oil palm companies
- Page 173 and 174: capital.” In order to ensure that
- Page 175 and 176: G3.8. Stakeholder Identification an
- Page 177 and 178:
2. Improve multi-‐stakeholder p
- Page 179 and 180:
Community Involvement during Projec
- Page 181 and 182:
31 26/12/08 Burhanudin Merchant Des
- Page 183 and 184:
Table 31. Rimba Raya Project Proces
- Page 185 and 186:
G3.9. CCBA Public Comment PeriodDes
- Page 187 and 188:
In some contexts, for example where
- Page 189 and 190:
Table 32. Required Skill Sets , Key
- Page 191 and 192:
Develop areforestationprogramaround
- Page 193 and 194:
Figure 38 PT Rimba Raya Conservatio
- Page 195 and 196:
Figure 40. Project Organizational C
- Page 197 and 198:
manipulated to serve someone’s pe
- Page 199 and 200:
13). One area of special considerat
- Page 201 and 202:
also provide training in the skills
- Page 203 and 204:
Communitycenters &librariesWater fi
- Page 205 and 206:
C102 - Social Security (Minimum Sta
- Page 207 and 208:
G5.2. Documentation of Project Appr
- Page 209 and 210:
Figure 42. Official Land Area Verif
- Page 211 and 212:
Figure 44. Original Letter from Gov
- Page 213 and 214:
Figure 45. Original Minister’s De
- Page 215 and 216:
Encroachment by Palm Oil Plantation
- Page 217 and 218:
CLIMATE SECTIONCL1. Net Positive Cl
- Page 219 and 220:
CL1.5. Double Counting of Emissions
- Page 221 and 222:
Negative leakage is the unanticipat
- Page 223 and 224:
undervalued. Moreover, the argument
- Page 225 and 226:
et. al., 2005). However the long te
- Page 227 and 228:
edistributed such that the most eff
- Page 229 and 230:
The intersection of the hypothetica
- Page 231 and 232:
dedicated to bio-‐fuel producti
- Page 233 and 234:
Without project activities are disp
- Page 235 and 236:
Table 36. Assessment of risk factor
- Page 237 and 238:
Table 36. ...continuedRiskFactorLik
- Page 239 and 240:
Table 37. ...continuedRisk Factor %
- Page 241 and 242:
degraded portions of the Project Ar
- Page 243 and 244:
CL2.4. Leakage and non-CO2 GasesNon
- Page 245 and 246:
Monitoring of the boundary of the p
- Page 247 and 248:
Monitoring will be conducted by a p
- Page 249 and 250:
Table 38. InfiniteSUSTAINABILITY Ma
- Page 251 and 252:
Phinisi FloatingClinicMicro-Finance
- Page 253 and 254:
Table 39. Threats and management re
- Page 255 and 256:
Hunting - Communities in the Projec
- Page 257 and 258:
All five of these capital assets ar
- Page 259 and 260:
Hygiene improvesProportion of house
- Page 261 and 262:
LARASITAProject proponents will wor
- Page 263 and 264:
B1.2. Impact of Project Activities
- Page 265 and 266:
HCV 1.1 Support Function to Protect
- Page 267 and 268:
further losses. Protection of non-
- Page 269 and 270:
five are listed as Endangered by IU
- Page 271 and 272:
HCV 2.3 Areas that Contain Populati
- Page 273 and 274:
Table 42. Species to be used for Ri
- Page 275 and 276:
negative. In this scenario, net bio
- Page 277 and 278:
permanent 10-‐20 km transects s
- Page 279 and 280:
high resolution imagery) and field
- Page 281 and 282:
e present in the Seruyan River insi
- Page 283 and 284:
The Rimba Raya Project is located i
- Page 285 and 286:
intentionally or unintentionally, f
- Page 287 and 288:
GL3. Exceptional Biodiversity Benef
- Page 289 and 290:
Table 44. Endangered & Critically E
- Page 291 and 292:
GL3.2.2. Species with Large but Clu
- Page 293 and 294:
BIBLIOGRAPHYAnderson, J.A.R. (1972)
- Page 295 and 296:
Gibbs, H., (2008) Carbon payback ti
- Page 297 and 298:
Nicolas, Marc V.J. and Grant S. Bee
- Page 299 and 300:
Islands]. In Press.Susilo, H.D. (19