CHAPTER 4 Name
CHAPTER 4 Name
CHAPTER 4 Name

You also want an ePaper? Increase the reach of your titles
YUMPU automatically turns print PDFs into web optimized ePapers that Google loves.
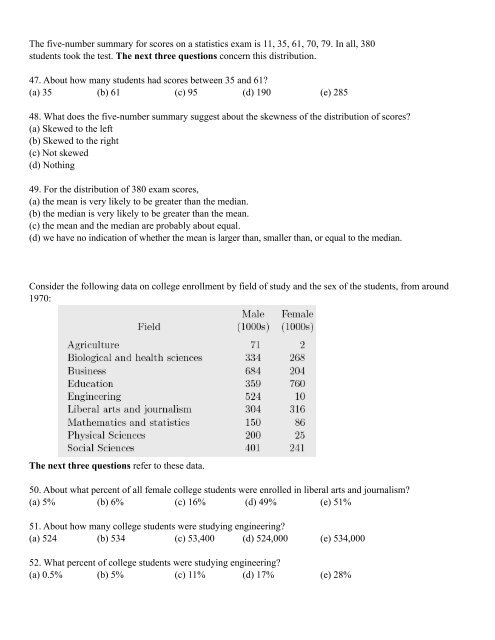
The five-number summary for scores on a statistics exam is 11, 35, 61, 70, 79. In all, 380students took the test. The next three questions concern this distribution.47. About how many students had scores between 35 and 61?(a) 35 (b) 61 (c) 95 (d) 190 (e) 28548. What does the five-number summary suggest about the skewness of the distribution of scores?(a) Skewed to the left(b) Skewed to the right(c) Not skewed(d) Nothing49. For the distribution of 380 exam scores,(a) the mean is very likely to be greater than the median.(b) the median is very likely to be greater than the mean.(c) the mean and the median are probably about equal.(d) we have no indication of whether the mean is larger than, smaller than, or equal to the median.Consider the following data on college enrollment by field of study and the sex of the students, from around1970:The next three questions refer to these data.50. About what percent of all female college students were enrolled in liberal arts and journalism?(a) 5% (b) 6% (c) 16% (d) 49% (e) 51%51. About how many college students were studying engineering?(a) 524 (b) 534 (c) 53,400 (d) 524,000 (e) 534,00052. What percent of college students were studying engineering?(a) 0.5% (b) 5% (c) 11% (d) 17% (e) 28%


![';1asAu ro; las I sgeo8 leuo!]eslanuol aql utelqo o1 palenttouJ ue I ...](https://img.yumpu.com/49072782/1/190x221/1asau-ro-las-i-sgeo8-leuoeslanuol-aql-utelqo-o1-palenttouj-ue-i-.jpg?quality=85)