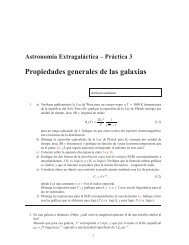
410 S.A. Cellone: Dwarf <strong>galaxies</strong> <strong>in</strong> <strong>the</strong> <strong>NGC</strong> <strong>5044</strong> <strong>Group</strong>so <strong>the</strong>ir observed parameters are reliable. It is necessary <strong>the</strong>n toexplore whe<strong>the</strong>r any peculiarity is <strong>the</strong> cause <strong>of</strong> <strong>the</strong> abnormallylarge N values for <strong>the</strong>se three <strong>galaxies</strong>.5.1. The three “outliers”Fig. 3. Lum<strong>in</strong>osity – shape relation for <strong>NGC</strong> <strong>5044</strong> <strong>Group</strong> <strong>dwarf</strong>s (filledcircles) and Fornax Cluster <strong>dwarf</strong>s form CFG (open circles).a correction to <strong>in</strong>dividual objects may lead to mean<strong>in</strong>gless results.)The few nucleated and flattened artificial <strong>galaxies</strong> follow<strong>the</strong> same trend as round, non-nucleated ones.Four <strong>galaxies</strong> <strong>in</strong> <strong>the</strong> present sample have N values too lowfor <strong>the</strong>ir lum<strong>in</strong>osity. They were already mentioned <strong>in</strong> <strong>the</strong> preced<strong>in</strong>gsection because <strong>of</strong> <strong>the</strong> poor quality <strong>of</strong> <strong>the</strong>ir pr<strong>of</strong>ile fits.Three <strong>of</strong> <strong>the</strong>m (N55, N98, and N124) have r e ≤ 5 ′′ , and so itis assumed that <strong>the</strong>ir observed parameters are flawed by see<strong>in</strong>g.[Alternatively, N98 may be a background object, as judged fromits red colour (see Table 3); <strong>the</strong> same holds true for N99 (seeSect. 3.2).] The fourth one (N95A) has a formally large measuredeffective radius; however, its associated error, as well as∆N, are abnormally large (<strong>the</strong> quality <strong>of</strong> its fit is very poor), andso its measured parameters are most probably wrong. Hence,<strong>the</strong>se four <strong>galaxies</strong> will not be <strong>in</strong>cluded <strong>in</strong> <strong>the</strong> follow<strong>in</strong>g analysis.N95 has r e =5.6 ′′ , i. e., very near to <strong>the</strong> boundary wheresee<strong>in</strong>g effects beg<strong>in</strong> to be significant; it is reta<strong>in</strong>ed with<strong>in</strong> <strong>the</strong>sample, although with caution s<strong>in</strong>ce its N is <strong>the</strong>n probably underestimated.5. The lum<strong>in</strong>osity – shape relationThe L − N relation for <strong>the</strong> rema<strong>in</strong><strong>in</strong>g 11 <strong>dwarf</strong>s <strong>in</strong> <strong>the</strong> <strong>NGC</strong><strong>5044</strong> <strong>Group</strong> sample is plotted <strong>in</strong> Fig. 3 (filled circles). Alsoshown are 15 Fornax Cluster <strong>dwarf</strong>s from CFG (open circles).The V magnitudes for <strong>the</strong> Fornax <strong>dwarf</strong>s were calculatedfrom <strong>the</strong>ir T 1 magnitudes us<strong>in</strong>g <strong>the</strong> transformations <strong>of</strong>Geisler (1996), and assum<strong>in</strong>g a difference <strong>in</strong> distance moduli between<strong>NGC</strong> <strong>5044</strong> and Fornax ∆(M − m) N<strong>5044</strong>−F =1.60 mag(FS90), and a difference <strong>in</strong> redden<strong>in</strong>gs ∆E BVN<strong>5044</strong>−F =0.03(Burste<strong>in</strong> & Heiles 1984).It is clear that most <strong>of</strong> <strong>the</strong> <strong>NGC</strong> <strong>5044</strong> <strong>dwarf</strong>s merge withand extend towards brighter magnitudes <strong>the</strong> L − N relationfor Fornax <strong>dwarf</strong>s, mak<strong>in</strong>g evident that <strong>the</strong> former belong toa population <strong>of</strong> <strong>in</strong>tr<strong>in</strong>sically brighter objects than <strong>the</strong> Fornaxsample. However, three <strong>galaxies</strong> (N42, N49, and N50) clearlydepart from <strong>the</strong> relation, with shape parameters N too high (i. e.,too “convex” <strong>pr<strong>of</strong>iles</strong>) for <strong>the</strong>ir lum<strong>in</strong>osities. These are bright,relatively large <strong>dwarf</strong>s, with high signal-to-noise <strong>pr<strong>of</strong>iles</strong>, andIt has been argued that <strong>galaxies</strong> with different stellar populationsfrom most <strong>galaxies</strong> <strong>in</strong> a given sample are likely to have differentstructural parameters, depart<strong>in</strong>g <strong>the</strong>n from <strong>the</strong> L − N relation(Young & Currie 1998). N49 clearly stands out <strong>of</strong> my samplewith a very blue colour B − V =0.49; it is classified as Im III,which is evident from Fig. 1, where several blobs can be seenon an irregular LSB body. Its pr<strong>of</strong>ile was fitted with a Sérsiclaw with N =1.36; however, two exponentials with differentslopes could have also worked well.N50, <strong>in</strong> turn, is classified as peculiar or r<strong>in</strong>ged blue compact<strong>dwarf</strong> ; however, no peculiar morphology is evident from my images,which show very symmetric isophotes. (It can be arguedthat see<strong>in</strong>g may have smoo<strong>the</strong>d out any subtle feature; however,note that <strong>the</strong> irregular morphology <strong>of</strong> N49 is clearly evident, despite<strong>of</strong> see<strong>in</strong>g.) Moreover, its colour is only 1 sigma lower than<strong>the</strong> mean for <strong>the</strong> whole sample (〈B − V 〉 =0.84 ± 0.16), andfar too red for a BCD (e. g.: Thuan 1983). The new photometrypresented here shows that N50 may <strong>in</strong>deed be termed “compact”,although surely not “blue”. Its compact appearance is<strong>the</strong>n not due to current star formation or a significantly youngerpopulation dom<strong>in</strong>at<strong>in</strong>g its overall lum<strong>in</strong>osity.F<strong>in</strong>ally, N42 is classified as a normal nucleated <strong>dwarf</strong> elliptical;its pr<strong>of</strong>ile shows a very bright nucleus and a bulge-typecomponent extend<strong>in</strong>g out to ≈ 18 ′′ , but <strong>the</strong> outer, ma<strong>in</strong> portion<strong>of</strong> <strong>the</strong> pr<strong>of</strong>ile is clearly convex, yield<strong>in</strong>g N =1.43. Its colouris similar to that <strong>of</strong> N50, i. e., not significantly lower than <strong>the</strong>mean <strong>of</strong> <strong>the</strong> sample. Note that with <strong>the</strong> usual practice (at leastfor bright ellipticals) <strong>of</strong> plott<strong>in</strong>g surface <strong>brightness</strong> aga<strong>in</strong>st r 1 4 ,which puts too much emphasis on <strong>the</strong> <strong>in</strong>ner portions <strong>of</strong> <strong>the</strong> pr<strong>of</strong>ile,N42 seems to be well fit by a de Vaucouleurs law, exceptfor its outer regions, as if it were tidally truncated. However, <strong>the</strong>nearest massive galaxy, <strong>the</strong> SB0 <strong>NGC</strong> 5030 (M B = −17.7),lies at a projected distance <strong>of</strong> 6.1 arcm<strong>in</strong> (∼ 43 kpc). Instead,<strong>the</strong> projected distance from <strong>the</strong> SBa <strong>NGC</strong> 5035 (M B = −18.0)to N50 is only 3.6 arcm<strong>in</strong> (∼ 25 kpc), so <strong>the</strong>re is a higher probabilityfor this <strong>dwarf</strong> than for N42 to be tidally affected by amassive neighbour, although no conclusive evidence is available<strong>in</strong> ei<strong>the</strong>r case.So, only N49 should be excluded from <strong>the</strong> sample because <strong>of</strong>its stellar content be<strong>in</strong>g different from normal dEs. N42 and N50are <strong>the</strong>n genu<strong>in</strong>e <strong>dwarf</strong> or <strong>in</strong>termediate – lum<strong>in</strong>osity ellipticalsthat do not obey <strong>the</strong> L − N relation. Note that <strong>the</strong>ir V T areat least 3 mag brighter than predicted by <strong>the</strong>ir N values. Thealternative <strong>of</strong> <strong>the</strong>ir be<strong>in</strong>g foreground objects is ruled out by <strong>the</strong>results <strong>of</strong> low resolution spectroscopy obta<strong>in</strong>ed with <strong>the</strong> sametelescope on April 1997. A prelim<strong>in</strong>ary reduction <strong>of</strong> <strong>the</strong>se datagave v r = 2 660 ± 180 km s −1 for N42, and v r = 2 390 ±130 km s −1 for N50, i. e., both <strong>in</strong> very good agreement with <strong>the</strong>radial velocity <strong>of</strong> <strong>NGC</strong> <strong>5044</strong> itself as well as <strong>the</strong> only two o<strong>the</strong>rbright early type <strong>galaxies</strong> with known redshifts <strong>in</strong> <strong>the</strong> group
(Huchra et al. 1983). Unfortunately, no spectroscopic data areavailable for N49. The radial velocities <strong>of</strong> N42 and N50 thusconfirm <strong>the</strong>ir classification as def<strong>in</strong>ite members <strong>of</strong> <strong>the</strong> groupby FS90 on a morphological basis. It is important to test thismorphological criterion, s<strong>in</strong>ce it has been successfully verified<strong>in</strong> nearby clusters (B<strong>in</strong>ggeli et al. 1993), but it fails for moredistant clusters, like Coma (e. g.: Adami et al. 1998). A detailedspectroscopic study <strong>of</strong> a few <strong>galaxies</strong> from this sample will bepresented <strong>in</strong> a forthcom<strong>in</strong>g paper (Cellone, <strong>in</strong> preparation).S.A. Cellone: Dwarf <strong>galaxies</strong> <strong>in</strong> <strong>the</strong> <strong>NGC</strong> <strong>5044</strong> <strong>Group</strong> 4115.2. The role <strong>of</strong> surface <strong>brightness</strong>The data presented <strong>in</strong> this paper support <strong>the</strong> claim that <strong>the</strong> L−Nrelation is <strong>in</strong>appropriate as a distance <strong>in</strong>dicator for <strong>in</strong>dividual<strong>galaxies</strong>. However, it could still be useful for a group <strong>of</strong> <strong>galaxies</strong>from which very deviant objects could be elim<strong>in</strong>ated. To explorethis I compared <strong>the</strong> <strong>NGC</strong> <strong>5044</strong> <strong>dwarf</strong>s with <strong>the</strong> large (photographic)Virgo Cluster sample <strong>of</strong> B<strong>in</strong>ggeli & Jerjen (1998).Total blue magnitudes (B T ) for <strong>the</strong> <strong>NGC</strong> <strong>5044</strong> <strong>dwarf</strong>s were calculatedfrom V T and (B − V ) 0 , and <strong>the</strong> N values from <strong>the</strong> Vband fits were used, <strong>in</strong>stead <strong>of</strong> fitt<strong>in</strong>g <strong>the</strong> (generally noisier) B<strong>pr<strong>of</strong>iles</strong>. This assumes that <strong>the</strong>re are no mean<strong>in</strong>gful colour gradients,which is normally true for dEs (Caldwell & Bothun 1987;CFG; Durrell et al. 1996; Durrell 1997).Fig. 4 shows log(N) aga<strong>in</strong>st B T for Virgo (all triangles) and<strong>NGC</strong> <strong>5044</strong> <strong>Group</strong> <strong>dwarf</strong>s (filled circles). The large scatter for<strong>the</strong> Virgo sample data, on which B<strong>in</strong>ggeli & Jerjen (1998) basedmost <strong>of</strong> <strong>the</strong>ir strong critique to <strong>the</strong> use <strong>of</strong> <strong>the</strong> L − N relation fordistance determ<strong>in</strong>ation purposes, is evident. With <strong>the</strong> <strong>in</strong>clusion<strong>of</strong> <strong>the</strong> “three outliers” and <strong>the</strong> probably undersampled N95 <strong>the</strong>scatter <strong>of</strong> <strong>the</strong> <strong>NGC</strong> <strong>5044</strong> <strong>Group</strong> data is even worse; althoughit is substantially reduced when <strong>the</strong>se four <strong>galaxies</strong> are elim<strong>in</strong>ated.The dashed l<strong>in</strong>e is a least-squares fit to <strong>the</strong> whole Virgosample (rms=0.9), while <strong>the</strong> solid l<strong>in</strong>e is a fit us<strong>in</strong>g <strong>the</strong> sameslope to <strong>the</strong> seven rema<strong>in</strong><strong>in</strong>g <strong>dwarf</strong>s <strong>in</strong> <strong>the</strong> <strong>NGC</strong> <strong>5044</strong> <strong>Group</strong>(rms=0.7). (Note that <strong>the</strong> scatter is still relatively large, despiteall troublesome <strong>galaxies</strong> were elim<strong>in</strong>ated and just a handful <strong>of</strong><strong>dwarf</strong>s with well determ<strong>in</strong>ed <strong>pr<strong>of</strong>iles</strong> rema<strong>in</strong>ed.) However, <strong>the</strong>setwo fits cannot be used as <strong>the</strong>y are to derive a relative distance,because both samples are not directly comparable. It was shown<strong>in</strong> Sect. 4 that <strong>the</strong> pr<strong>of</strong>ile parameters <strong>of</strong> <strong>galaxies</strong> with smallerangular sizes cannot be accurately measured; hence, <strong>the</strong> moredistant sample will have a distribution <strong>of</strong> <strong>in</strong>tr<strong>in</strong>sic sizes biasedaga<strong>in</strong>st small <strong>galaxies</strong>.It is known that structural parameters <strong>of</strong> dEs are all connectedto each o<strong>the</strong>r lead<strong>in</strong>g to a variety <strong>of</strong> different relationsbetween <strong>the</strong>m. In particular, any measure <strong>of</strong> <strong>the</strong> size (scale parameterα, effective or isophotal radii, etc.) correlates with lum<strong>in</strong>osity(e. g.: Impey et al. 1988), and hence, smaller <strong>galaxies</strong>are <strong>in</strong> general fa<strong>in</strong>ter. This leads to a change <strong>in</strong> both zero po<strong>in</strong>tand slope for <strong>the</strong> L − N relation when <strong>the</strong> <strong>in</strong>tr<strong>in</strong>sically smaller<strong>galaxies</strong> are elim<strong>in</strong>ated, as can be seen <strong>in</strong> Fig. 4, where <strong>the</strong> dottedl<strong>in</strong>e is a fit to a subsample <strong>of</strong> <strong>the</strong> Virgo data (half-filled triangles)formed after elim<strong>in</strong>at<strong>in</strong>g those <strong>galaxies</strong> that would haver e < 6.8 ′′ at <strong>the</strong> distance <strong>of</strong> <strong>NGC</strong> <strong>5044</strong>. A relative distancemodulus ∆(m−M) =1.85 was assumed (see Sect. 2), and <strong>the</strong>Fig. 4. Logarithm <strong>of</strong> shape parameter (N) vs. apparent blue magnitudesfor <strong>NGC</strong> <strong>5044</strong> <strong>Group</strong> <strong>dwarf</strong>s (filled circles), and Virgo <strong>dwarf</strong>s fromB<strong>in</strong>ggeli & Jerjen (1998) (all triangles). The Virgo subsample formedby those <strong>galaxies</strong> which would have r e < 6.8 ′′ if <strong>the</strong>ir distance is<strong>in</strong>creased by ∆(m−M) =1.85 are shown as half-filled triangles. Thesolid l<strong>in</strong>e is a l<strong>in</strong>ear fit to <strong>the</strong> <strong>NGC</strong> <strong>5044</strong> <strong>Group</strong> data, while <strong>the</strong> dashedand dotted l<strong>in</strong>es are fits to <strong>the</strong> whole Virgo sample and subsample,respectively.cut<strong>of</strong>f at r e < 6.8 ′′ was adopted because this is <strong>the</strong> lower limitfor <strong>the</strong> <strong>NGC</strong> <strong>5044</strong> sample once N95 is also elim<strong>in</strong>ated.This Virgo subsample and <strong>the</strong> <strong>NGC</strong> <strong>5044</strong> data were <strong>the</strong>ncompared to obta<strong>in</strong> a new relative distance modulus, which <strong>in</strong>turn was used to def<strong>in</strong>e a new subsample, and this iterative procedurewas repeated until it converged. A relative distance modulus∆(m−M) 0 =0.9±0.2 was obta<strong>in</strong>ed, significantly lowerthan all previous determ<strong>in</strong>ations. This result should be takenwith extreme caution, given <strong>the</strong> various explicit and implicitassumptions that were made. In particular, <strong>the</strong> goal <strong>of</strong> <strong>the</strong> procedurejust described is that both samples span <strong>the</strong> same range<strong>in</strong> <strong>in</strong>tr<strong>in</strong>sic effective radii; however, even if this goal is achieved,<strong>the</strong>re is no guarantee that both samples have <strong>the</strong> same distribution<strong>of</strong> <strong>in</strong>tr<strong>in</strong>sic effective radii. On <strong>the</strong> o<strong>the</strong>r hand, note that mysample lacks any fa<strong>in</strong>t <strong>galaxies</strong> with N>1; this fact is probably<strong>in</strong>troduc<strong>in</strong>g an additional bias <strong>in</strong> <strong>the</strong> L − N relation for<strong>the</strong> <strong>NGC</strong> <strong>5044</strong> <strong>Group</strong>. A larger sample observed under bettersee<strong>in</strong>g conditions is clearly needed.Regard<strong>in</strong>g <strong>the</strong> large scatter <strong>of</strong> <strong>the</strong> L − N relation, it wassuggested that it could be reduced by add<strong>in</strong>g a third parameter,probably surface <strong>brightness</strong> (Young & Currie 1994;Ferguson & B<strong>in</strong>ggeli 1994). The role <strong>of</strong> surface <strong>brightness</strong> wasalso noted by CFG, who showed that <strong>the</strong>ir sample <strong>of</strong> Fornax dEswas bounded by curves <strong>of</strong> constant isophotal surface <strong>brightness</strong><strong>in</strong> a central surface <strong>brightness</strong> vs. shape parameter plot. Theysuggested <strong>the</strong> existence <strong>of</strong> bright, relatively high surface <strong>brightness</strong><strong>dwarf</strong>s with N > 1 (as well as fa<strong>in</strong>t, very LSB <strong>dwarf</strong>swith N < 1) that were not <strong>in</strong>cluded when select<strong>in</strong>g a particularsample because <strong>the</strong>ir isophotal surface <strong>brightness</strong>es werehigher (lower) than <strong>the</strong> average. A similar plot is show <strong>in</strong> Fig. 5,where curves <strong>of</strong> constant effective surface <strong>brightness</strong> are drawn.Aga<strong>in</strong>, N42, N49, and N50 detach from <strong>the</strong> rest; <strong>in</strong> particular,N50 is located where CFG predicted bright <strong>galaxies</strong> with convex