Surface brightness profiles of dwarf galaxies in the NGC 5044 Group
Surface brightness profiles of dwarf galaxies in the NGC 5044 Group
Surface brightness profiles of dwarf galaxies in the NGC 5044 Group

You also want an ePaper? Increase the reach of your titles
YUMPU automatically turns print PDFs into web optimized ePapers that Google loves.
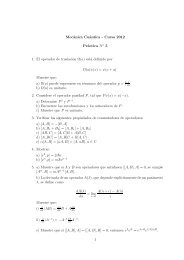
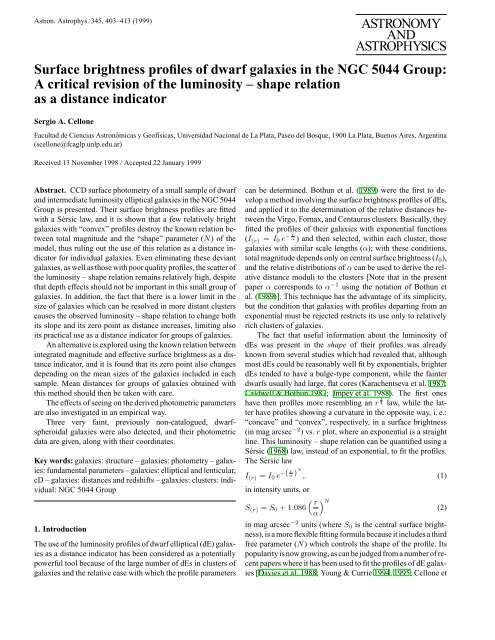
S.A. Cellone: Dwarf <strong>galaxies</strong> <strong>in</strong> <strong>the</strong> <strong>NGC</strong> <strong>5044</strong> <strong>Group</strong> 407Fig. 1. V band images and surface <strong>brightness</strong> <strong>pr<strong>of</strong>iles</strong> for several selected <strong>galaxies</strong>. The images are 1.5 arcm<strong>in</strong> on a side, with North up and Eastto <strong>the</strong> left. Small ticks below <strong>the</strong> <strong>pr<strong>of</strong>iles</strong> show <strong>the</strong> <strong>in</strong>ner (8 pix) and <strong>the</strong> two outer (1σ and 1 σ) cut<strong>of</strong>fs <strong>in</strong> radius for model fitt<strong>in</strong>g. The fitted2models are shown with solid l<strong>in</strong>es. Error bars are not shown when <strong>the</strong>y are smaller than <strong>the</strong> symbol size.
408 S.A. Cellone: Dwarf <strong>galaxies</strong> <strong>in</strong> <strong>the</strong> <strong>NGC</strong> <strong>5044</strong> <strong>Group</strong>Fig. 1. (Cont<strong>in</strong>ued)
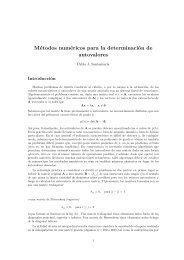
S.A. Cellone: Dwarf <strong>galaxies</strong> <strong>in</strong> <strong>the</strong> <strong>NGC</strong> <strong>5044</strong> <strong>Group</strong> 409orS e = S 0 + 5 log(reα) [ Γ(2− 2.5 logN )N]. (5)It can be shown that reα depends only on N, and <strong>the</strong>n S e doesnot depend on α. These calculated parameters are also shown <strong>in</strong>Table 4. The magnitudes and colours <strong>in</strong> Table 3, <strong>in</strong>stead, wereobta<strong>in</strong>ed from <strong>the</strong> observed <strong>pr<strong>of</strong>iles</strong> with no model assumption,to allow for those <strong>galaxies</strong> whose <strong>pr<strong>of</strong>iles</strong> couldn’t be fitted with<strong>the</strong> model.4. See<strong>in</strong>g effectsThe effects <strong>of</strong> see<strong>in</strong>g on <strong>the</strong> photometric parameters<strong>of</strong> elliptical <strong>galaxies</strong> have been studied us<strong>in</strong>g differenttechniques (e. g.: Franx et al. 1989; Peletier et al. 1990;Saglia et al. 1993b). These studies have shown that <strong>the</strong> effects <strong>of</strong>see<strong>in</strong>g on surface <strong>brightness</strong> and ellipticity <strong>pr<strong>of</strong>iles</strong> may extendup to several PSF radii.The observations presented <strong>in</strong> this paper were obta<strong>in</strong>ed underra<strong>the</strong>r mediocre see<strong>in</strong>g conditions and, <strong>in</strong> addition, <strong>the</strong> telescopehad small track<strong>in</strong>g errors. This resulted <strong>in</strong> a non-circularPSF, with Gaussian fits to its m<strong>in</strong>or and major axis giv<strong>in</strong>gFWHM Y ≃ 2.0 ′′ and FWHM X ≃ 2.8 ′′ , respectively, withsmall variations between different frames. However, <strong>the</strong> actualshape <strong>of</strong> <strong>the</strong> PSF was not Gaussian, hav<strong>in</strong>g notably larger w<strong>in</strong>gs.The adopted approach, <strong>the</strong>n, was to evaluate <strong>the</strong> effects <strong>of</strong> see<strong>in</strong>gon this particular set <strong>of</strong> observations us<strong>in</strong>g an empirical PSFobta<strong>in</strong>ed from <strong>the</strong> same data us<strong>in</strong>g IRAF–DAOPHOT rout<strong>in</strong>es.A set <strong>of</strong> artificial <strong>galaxies</strong> follow<strong>in</strong>g a perfect Sérsic law andspann<strong>in</strong>g a broad range <strong>in</strong> <strong>the</strong> relevant parameters was generated,and <strong>the</strong>n convolved with <strong>the</strong> empirical PSF. The surface<strong>brightness</strong> <strong>pr<strong>of</strong>iles</strong> <strong>of</strong> <strong>the</strong>se convolved artificial <strong>galaxies</strong> were<strong>the</strong>n obta<strong>in</strong>ed and fitted with a Sérsic law, <strong>in</strong> <strong>the</strong> same way aswas previously done with <strong>the</strong> observed <strong>galaxies</strong>. The effects<strong>of</strong> see<strong>in</strong>g were evaluated by compar<strong>in</strong>g <strong>the</strong> “observed” and <strong>the</strong>“orig<strong>in</strong>al” parameters for <strong>the</strong> convolved artificial <strong>galaxies</strong>.A total <strong>of</strong> 55 artificial <strong>galaxies</strong> were generated with fixedcentral surface <strong>brightness</strong>, and spann<strong>in</strong>g <strong>the</strong> follow<strong>in</strong>g ranges<strong>in</strong> scale length and shape parameter: 0.001 ′′ ≤ α ≤ 10 ′′ , and0.25 ≤ N ≤ 1.50, respectively. Most <strong>of</strong> <strong>the</strong>m were round, butseveral non-circular (ɛ =0.5) and a few “nucleated” artificial<strong>galaxies</strong> (i. e., with a po<strong>in</strong>t source 10% <strong>the</strong> lum<strong>in</strong>osity <strong>of</strong> <strong>the</strong>galaxy added at its centre, before <strong>the</strong> convolution) were alsogenerated, <strong>in</strong> order to check for any differences compared tocircular, non-nucleated <strong>galaxies</strong>. No noise or constant sky levelwere added. Although a complete study <strong>of</strong> see<strong>in</strong>g and <strong>in</strong>strumentaleffects would require <strong>the</strong> <strong>in</strong>clusion <strong>of</strong> <strong>the</strong>se factors, alongwith <strong>the</strong> generation <strong>of</strong> a larger sample <strong>of</strong> artificial <strong>galaxies</strong> convolvedwith different PSFs, <strong>the</strong> present approach is sufficient toevaluate <strong>the</strong> global effects <strong>of</strong> see<strong>in</strong>g on <strong>the</strong> measured photometricparameters <strong>of</strong> this particular sample <strong>of</strong> <strong>galaxies</strong>.Fig. 2 shows <strong>the</strong> differences between each measured parameterand <strong>the</strong> orig<strong>in</strong>al one [∆S 0 , ∆ log(α), and ∆ log(N), respectively]aga<strong>in</strong>st <strong>the</strong> measured effective radius r e . It is evident thatfor sufficiently large <strong>galaxies</strong> <strong>the</strong> orig<strong>in</strong>al parameters are recovabcFig. 2a–c. Measured (after convolution with PSF) m<strong>in</strong>us orig<strong>in</strong>al parametersaga<strong>in</strong>st measured effective radius for 55 artificial <strong>galaxies</strong>:a central surface <strong>brightness</strong>, b logarithm <strong>of</strong> scale length, and c logarithm<strong>of</strong> shape parameter. Squares: round, non-nucleated <strong>galaxies</strong>;triangles: ɛ =0.5, non-nucleated <strong>galaxies</strong>; crosses: round, nucleated<strong>galaxies</strong>. Dashed l<strong>in</strong>es are least-squares fits for log(r e) ≤ 0.5 ′′ .ered with small errors, but for <strong>galaxies</strong> with r e 5 ′′ <strong>the</strong> parametersare systematically underestimated because <strong>of</strong> see<strong>in</strong>g andsampl<strong>in</strong>g effects. (Note that, at least <strong>in</strong> pr<strong>in</strong>ciple, it seems possibleto recover <strong>the</strong> orig<strong>in</strong>al parameters for <strong>the</strong> smaller <strong>galaxies</strong>;however, <strong>the</strong> scatter is large, specially for N, and try<strong>in</strong>g to apply
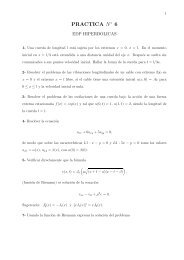
410 S.A. Cellone: Dwarf <strong>galaxies</strong> <strong>in</strong> <strong>the</strong> <strong>NGC</strong> <strong>5044</strong> <strong>Group</strong>so <strong>the</strong>ir observed parameters are reliable. It is necessary <strong>the</strong>n toexplore whe<strong>the</strong>r any peculiarity is <strong>the</strong> cause <strong>of</strong> <strong>the</strong> abnormallylarge N values for <strong>the</strong>se three <strong>galaxies</strong>.5.1. The three “outliers”Fig. 3. Lum<strong>in</strong>osity – shape relation for <strong>NGC</strong> <strong>5044</strong> <strong>Group</strong> <strong>dwarf</strong>s (filledcircles) and Fornax Cluster <strong>dwarf</strong>s form CFG (open circles).a correction to <strong>in</strong>dividual objects may lead to mean<strong>in</strong>gless results.)The few nucleated and flattened artificial <strong>galaxies</strong> follow<strong>the</strong> same trend as round, non-nucleated ones.Four <strong>galaxies</strong> <strong>in</strong> <strong>the</strong> present sample have N values too lowfor <strong>the</strong>ir lum<strong>in</strong>osity. They were already mentioned <strong>in</strong> <strong>the</strong> preced<strong>in</strong>gsection because <strong>of</strong> <strong>the</strong> poor quality <strong>of</strong> <strong>the</strong>ir pr<strong>of</strong>ile fits.Three <strong>of</strong> <strong>the</strong>m (N55, N98, and N124) have r e ≤ 5 ′′ , and so itis assumed that <strong>the</strong>ir observed parameters are flawed by see<strong>in</strong>g.[Alternatively, N98 may be a background object, as judged fromits red colour (see Table 3); <strong>the</strong> same holds true for N99 (seeSect. 3.2).] The fourth one (N95A) has a formally large measuredeffective radius; however, its associated error, as well as∆N, are abnormally large (<strong>the</strong> quality <strong>of</strong> its fit is very poor), andso its measured parameters are most probably wrong. Hence,<strong>the</strong>se four <strong>galaxies</strong> will not be <strong>in</strong>cluded <strong>in</strong> <strong>the</strong> follow<strong>in</strong>g analysis.N95 has r e =5.6 ′′ , i. e., very near to <strong>the</strong> boundary wheresee<strong>in</strong>g effects beg<strong>in</strong> to be significant; it is reta<strong>in</strong>ed with<strong>in</strong> <strong>the</strong>sample, although with caution s<strong>in</strong>ce its N is <strong>the</strong>n probably underestimated.5. The lum<strong>in</strong>osity – shape relationThe L − N relation for <strong>the</strong> rema<strong>in</strong><strong>in</strong>g 11 <strong>dwarf</strong>s <strong>in</strong> <strong>the</strong> <strong>NGC</strong><strong>5044</strong> <strong>Group</strong> sample is plotted <strong>in</strong> Fig. 3 (filled circles). Alsoshown are 15 Fornax Cluster <strong>dwarf</strong>s from CFG (open circles).The V magnitudes for <strong>the</strong> Fornax <strong>dwarf</strong>s were calculatedfrom <strong>the</strong>ir T 1 magnitudes us<strong>in</strong>g <strong>the</strong> transformations <strong>of</strong>Geisler (1996), and assum<strong>in</strong>g a difference <strong>in</strong> distance moduli between<strong>NGC</strong> <strong>5044</strong> and Fornax ∆(M − m) N<strong>5044</strong>−F =1.60 mag(FS90), and a difference <strong>in</strong> redden<strong>in</strong>gs ∆E BVN<strong>5044</strong>−F =0.03(Burste<strong>in</strong> & Heiles 1984).It is clear that most <strong>of</strong> <strong>the</strong> <strong>NGC</strong> <strong>5044</strong> <strong>dwarf</strong>s merge withand extend towards brighter magnitudes <strong>the</strong> L − N relationfor Fornax <strong>dwarf</strong>s, mak<strong>in</strong>g evident that <strong>the</strong> former belong toa population <strong>of</strong> <strong>in</strong>tr<strong>in</strong>sically brighter objects than <strong>the</strong> Fornaxsample. However, three <strong>galaxies</strong> (N42, N49, and N50) clearlydepart from <strong>the</strong> relation, with shape parameters N too high (i. e.,too “convex” <strong>pr<strong>of</strong>iles</strong>) for <strong>the</strong>ir lum<strong>in</strong>osities. These are bright,relatively large <strong>dwarf</strong>s, with high signal-to-noise <strong>pr<strong>of</strong>iles</strong>, andIt has been argued that <strong>galaxies</strong> with different stellar populationsfrom most <strong>galaxies</strong> <strong>in</strong> a given sample are likely to have differentstructural parameters, depart<strong>in</strong>g <strong>the</strong>n from <strong>the</strong> L − N relation(Young & Currie 1998). N49 clearly stands out <strong>of</strong> my samplewith a very blue colour B − V =0.49; it is classified as Im III,which is evident from Fig. 1, where several blobs can be seenon an irregular LSB body. Its pr<strong>of</strong>ile was fitted with a Sérsiclaw with N =1.36; however, two exponentials with differentslopes could have also worked well.N50, <strong>in</strong> turn, is classified as peculiar or r<strong>in</strong>ged blue compact<strong>dwarf</strong> ; however, no peculiar morphology is evident from my images,which show very symmetric isophotes. (It can be arguedthat see<strong>in</strong>g may have smoo<strong>the</strong>d out any subtle feature; however,note that <strong>the</strong> irregular morphology <strong>of</strong> N49 is clearly evident, despite<strong>of</strong> see<strong>in</strong>g.) Moreover, its colour is only 1 sigma lower than<strong>the</strong> mean for <strong>the</strong> whole sample (〈B − V 〉 =0.84 ± 0.16), andfar too red for a BCD (e. g.: Thuan 1983). The new photometrypresented here shows that N50 may <strong>in</strong>deed be termed “compact”,although surely not “blue”. Its compact appearance is<strong>the</strong>n not due to current star formation or a significantly youngerpopulation dom<strong>in</strong>at<strong>in</strong>g its overall lum<strong>in</strong>osity.F<strong>in</strong>ally, N42 is classified as a normal nucleated <strong>dwarf</strong> elliptical;its pr<strong>of</strong>ile shows a very bright nucleus and a bulge-typecomponent extend<strong>in</strong>g out to ≈ 18 ′′ , but <strong>the</strong> outer, ma<strong>in</strong> portion<strong>of</strong> <strong>the</strong> pr<strong>of</strong>ile is clearly convex, yield<strong>in</strong>g N =1.43. Its colouris similar to that <strong>of</strong> N50, i. e., not significantly lower than <strong>the</strong>mean <strong>of</strong> <strong>the</strong> sample. Note that with <strong>the</strong> usual practice (at leastfor bright ellipticals) <strong>of</strong> plott<strong>in</strong>g surface <strong>brightness</strong> aga<strong>in</strong>st r 1 4 ,which puts too much emphasis on <strong>the</strong> <strong>in</strong>ner portions <strong>of</strong> <strong>the</strong> pr<strong>of</strong>ile,N42 seems to be well fit by a de Vaucouleurs law, exceptfor its outer regions, as if it were tidally truncated. However, <strong>the</strong>nearest massive galaxy, <strong>the</strong> SB0 <strong>NGC</strong> 5030 (M B = −17.7),lies at a projected distance <strong>of</strong> 6.1 arcm<strong>in</strong> (∼ 43 kpc). Instead,<strong>the</strong> projected distance from <strong>the</strong> SBa <strong>NGC</strong> 5035 (M B = −18.0)to N50 is only 3.6 arcm<strong>in</strong> (∼ 25 kpc), so <strong>the</strong>re is a higher probabilityfor this <strong>dwarf</strong> than for N42 to be tidally affected by amassive neighbour, although no conclusive evidence is available<strong>in</strong> ei<strong>the</strong>r case.So, only N49 should be excluded from <strong>the</strong> sample because <strong>of</strong>its stellar content be<strong>in</strong>g different from normal dEs. N42 and N50are <strong>the</strong>n genu<strong>in</strong>e <strong>dwarf</strong> or <strong>in</strong>termediate – lum<strong>in</strong>osity ellipticalsthat do not obey <strong>the</strong> L − N relation. Note that <strong>the</strong>ir V T areat least 3 mag brighter than predicted by <strong>the</strong>ir N values. Thealternative <strong>of</strong> <strong>the</strong>ir be<strong>in</strong>g foreground objects is ruled out by <strong>the</strong>results <strong>of</strong> low resolution spectroscopy obta<strong>in</strong>ed with <strong>the</strong> sametelescope on April 1997. A prelim<strong>in</strong>ary reduction <strong>of</strong> <strong>the</strong>se datagave v r = 2 660 ± 180 km s −1 for N42, and v r = 2 390 ±130 km s −1 for N50, i. e., both <strong>in</strong> very good agreement with <strong>the</strong>radial velocity <strong>of</strong> <strong>NGC</strong> <strong>5044</strong> itself as well as <strong>the</strong> only two o<strong>the</strong>rbright early type <strong>galaxies</strong> with known redshifts <strong>in</strong> <strong>the</strong> group
(Huchra et al. 1983). Unfortunately, no spectroscopic data areavailable for N49. The radial velocities <strong>of</strong> N42 and N50 thusconfirm <strong>the</strong>ir classification as def<strong>in</strong>ite members <strong>of</strong> <strong>the</strong> groupby FS90 on a morphological basis. It is important to test thismorphological criterion, s<strong>in</strong>ce it has been successfully verified<strong>in</strong> nearby clusters (B<strong>in</strong>ggeli et al. 1993), but it fails for moredistant clusters, like Coma (e. g.: Adami et al. 1998). A detailedspectroscopic study <strong>of</strong> a few <strong>galaxies</strong> from this sample will bepresented <strong>in</strong> a forthcom<strong>in</strong>g paper (Cellone, <strong>in</strong> preparation).S.A. Cellone: Dwarf <strong>galaxies</strong> <strong>in</strong> <strong>the</strong> <strong>NGC</strong> <strong>5044</strong> <strong>Group</strong> 4115.2. The role <strong>of</strong> surface <strong>brightness</strong>The data presented <strong>in</strong> this paper support <strong>the</strong> claim that <strong>the</strong> L−Nrelation is <strong>in</strong>appropriate as a distance <strong>in</strong>dicator for <strong>in</strong>dividual<strong>galaxies</strong>. However, it could still be useful for a group <strong>of</strong> <strong>galaxies</strong>from which very deviant objects could be elim<strong>in</strong>ated. To explorethis I compared <strong>the</strong> <strong>NGC</strong> <strong>5044</strong> <strong>dwarf</strong>s with <strong>the</strong> large (photographic)Virgo Cluster sample <strong>of</strong> B<strong>in</strong>ggeli & Jerjen (1998).Total blue magnitudes (B T ) for <strong>the</strong> <strong>NGC</strong> <strong>5044</strong> <strong>dwarf</strong>s were calculatedfrom V T and (B − V ) 0 , and <strong>the</strong> N values from <strong>the</strong> Vband fits were used, <strong>in</strong>stead <strong>of</strong> fitt<strong>in</strong>g <strong>the</strong> (generally noisier) B<strong>pr<strong>of</strong>iles</strong>. This assumes that <strong>the</strong>re are no mean<strong>in</strong>gful colour gradients,which is normally true for dEs (Caldwell & Bothun 1987;CFG; Durrell et al. 1996; Durrell 1997).Fig. 4 shows log(N) aga<strong>in</strong>st B T for Virgo (all triangles) and<strong>NGC</strong> <strong>5044</strong> <strong>Group</strong> <strong>dwarf</strong>s (filled circles). The large scatter for<strong>the</strong> Virgo sample data, on which B<strong>in</strong>ggeli & Jerjen (1998) basedmost <strong>of</strong> <strong>the</strong>ir strong critique to <strong>the</strong> use <strong>of</strong> <strong>the</strong> L − N relation fordistance determ<strong>in</strong>ation purposes, is evident. With <strong>the</strong> <strong>in</strong>clusion<strong>of</strong> <strong>the</strong> “three outliers” and <strong>the</strong> probably undersampled N95 <strong>the</strong>scatter <strong>of</strong> <strong>the</strong> <strong>NGC</strong> <strong>5044</strong> <strong>Group</strong> data is even worse; althoughit is substantially reduced when <strong>the</strong>se four <strong>galaxies</strong> are elim<strong>in</strong>ated.The dashed l<strong>in</strong>e is a least-squares fit to <strong>the</strong> whole Virgosample (rms=0.9), while <strong>the</strong> solid l<strong>in</strong>e is a fit us<strong>in</strong>g <strong>the</strong> sameslope to <strong>the</strong> seven rema<strong>in</strong><strong>in</strong>g <strong>dwarf</strong>s <strong>in</strong> <strong>the</strong> <strong>NGC</strong> <strong>5044</strong> <strong>Group</strong>(rms=0.7). (Note that <strong>the</strong> scatter is still relatively large, despiteall troublesome <strong>galaxies</strong> were elim<strong>in</strong>ated and just a handful <strong>of</strong><strong>dwarf</strong>s with well determ<strong>in</strong>ed <strong>pr<strong>of</strong>iles</strong> rema<strong>in</strong>ed.) However, <strong>the</strong>setwo fits cannot be used as <strong>the</strong>y are to derive a relative distance,because both samples are not directly comparable. It was shown<strong>in</strong> Sect. 4 that <strong>the</strong> pr<strong>of</strong>ile parameters <strong>of</strong> <strong>galaxies</strong> with smallerangular sizes cannot be accurately measured; hence, <strong>the</strong> moredistant sample will have a distribution <strong>of</strong> <strong>in</strong>tr<strong>in</strong>sic sizes biasedaga<strong>in</strong>st small <strong>galaxies</strong>.It is known that structural parameters <strong>of</strong> dEs are all connectedto each o<strong>the</strong>r lead<strong>in</strong>g to a variety <strong>of</strong> different relationsbetween <strong>the</strong>m. In particular, any measure <strong>of</strong> <strong>the</strong> size (scale parameterα, effective or isophotal radii, etc.) correlates with lum<strong>in</strong>osity(e. g.: Impey et al. 1988), and hence, smaller <strong>galaxies</strong>are <strong>in</strong> general fa<strong>in</strong>ter. This leads to a change <strong>in</strong> both zero po<strong>in</strong>tand slope for <strong>the</strong> L − N relation when <strong>the</strong> <strong>in</strong>tr<strong>in</strong>sically smaller<strong>galaxies</strong> are elim<strong>in</strong>ated, as can be seen <strong>in</strong> Fig. 4, where <strong>the</strong> dottedl<strong>in</strong>e is a fit to a subsample <strong>of</strong> <strong>the</strong> Virgo data (half-filled triangles)formed after elim<strong>in</strong>at<strong>in</strong>g those <strong>galaxies</strong> that would haver e < 6.8 ′′ at <strong>the</strong> distance <strong>of</strong> <strong>NGC</strong> <strong>5044</strong>. A relative distancemodulus ∆(m−M) =1.85 was assumed (see Sect. 2), and <strong>the</strong>Fig. 4. Logarithm <strong>of</strong> shape parameter (N) vs. apparent blue magnitudesfor <strong>NGC</strong> <strong>5044</strong> <strong>Group</strong> <strong>dwarf</strong>s (filled circles), and Virgo <strong>dwarf</strong>s fromB<strong>in</strong>ggeli & Jerjen (1998) (all triangles). The Virgo subsample formedby those <strong>galaxies</strong> which would have r e < 6.8 ′′ if <strong>the</strong>ir distance is<strong>in</strong>creased by ∆(m−M) =1.85 are shown as half-filled triangles. Thesolid l<strong>in</strong>e is a l<strong>in</strong>ear fit to <strong>the</strong> <strong>NGC</strong> <strong>5044</strong> <strong>Group</strong> data, while <strong>the</strong> dashedand dotted l<strong>in</strong>es are fits to <strong>the</strong> whole Virgo sample and subsample,respectively.cut<strong>of</strong>f at r e < 6.8 ′′ was adopted because this is <strong>the</strong> lower limitfor <strong>the</strong> <strong>NGC</strong> <strong>5044</strong> sample once N95 is also elim<strong>in</strong>ated.This Virgo subsample and <strong>the</strong> <strong>NGC</strong> <strong>5044</strong> data were <strong>the</strong>ncompared to obta<strong>in</strong> a new relative distance modulus, which <strong>in</strong>turn was used to def<strong>in</strong>e a new subsample, and this iterative procedurewas repeated until it converged. A relative distance modulus∆(m−M) 0 =0.9±0.2 was obta<strong>in</strong>ed, significantly lowerthan all previous determ<strong>in</strong>ations. This result should be takenwith extreme caution, given <strong>the</strong> various explicit and implicitassumptions that were made. In particular, <strong>the</strong> goal <strong>of</strong> <strong>the</strong> procedurejust described is that both samples span <strong>the</strong> same range<strong>in</strong> <strong>in</strong>tr<strong>in</strong>sic effective radii; however, even if this goal is achieved,<strong>the</strong>re is no guarantee that both samples have <strong>the</strong> same distribution<strong>of</strong> <strong>in</strong>tr<strong>in</strong>sic effective radii. On <strong>the</strong> o<strong>the</strong>r hand, note that mysample lacks any fa<strong>in</strong>t <strong>galaxies</strong> with N>1; this fact is probably<strong>in</strong>troduc<strong>in</strong>g an additional bias <strong>in</strong> <strong>the</strong> L − N relation for<strong>the</strong> <strong>NGC</strong> <strong>5044</strong> <strong>Group</strong>. A larger sample observed under bettersee<strong>in</strong>g conditions is clearly needed.Regard<strong>in</strong>g <strong>the</strong> large scatter <strong>of</strong> <strong>the</strong> L − N relation, it wassuggested that it could be reduced by add<strong>in</strong>g a third parameter,probably surface <strong>brightness</strong> (Young & Currie 1994;Ferguson & B<strong>in</strong>ggeli 1994). The role <strong>of</strong> surface <strong>brightness</strong> wasalso noted by CFG, who showed that <strong>the</strong>ir sample <strong>of</strong> Fornax dEswas bounded by curves <strong>of</strong> constant isophotal surface <strong>brightness</strong><strong>in</strong> a central surface <strong>brightness</strong> vs. shape parameter plot. Theysuggested <strong>the</strong> existence <strong>of</strong> bright, relatively high surface <strong>brightness</strong><strong>dwarf</strong>s with N > 1 (as well as fa<strong>in</strong>t, very LSB <strong>dwarf</strong>swith N < 1) that were not <strong>in</strong>cluded when select<strong>in</strong>g a particularsample because <strong>the</strong>ir isophotal surface <strong>brightness</strong>es werehigher (lower) than <strong>the</strong> average. A similar plot is show <strong>in</strong> Fig. 5,where curves <strong>of</strong> constant effective surface <strong>brightness</strong> are drawn.Aga<strong>in</strong>, N42, N49, and N50 detach from <strong>the</strong> rest; <strong>in</strong> particular,N50 is located where CFG predicted bright <strong>galaxies</strong> with convex
412 S.A. Cellone: Dwarf <strong>galaxies</strong> <strong>in</strong> <strong>the</strong> <strong>NGC</strong> <strong>5044</strong> <strong>Group</strong>Fig. 5. Shape parameter vs. central surface <strong>brightness</strong> for <strong>NGC</strong> <strong>5044</strong><strong>Group</strong> <strong>dwarf</strong>s. The dashed l<strong>in</strong>es correspond to objects with constanteffective surface <strong>brightness</strong>es: S e =22, S e =23, and S e =24magarcsec −2 , as labeled. The three “outliers” are <strong>in</strong>dicated.<strong>pr<strong>of</strong>iles</strong> could be found. However, N42 has a normal effectivesurface <strong>brightness</strong> (for LSB <strong>dwarf</strong>s), still its shape is abnormalfor its lum<strong>in</strong>osity.B<strong>in</strong>ggeli & Jerjen (1998) used a l<strong>in</strong>ear comb<strong>in</strong>ation <strong>of</strong> centralsurface <strong>brightness</strong> (S 0 ) and log(N) to improve <strong>the</strong> correlationaga<strong>in</strong>st total magnitude. However, <strong>the</strong>y po<strong>in</strong>ted out thatnearly <strong>the</strong> same results were obta<strong>in</strong>ed us<strong>in</strong>g <strong>the</strong> relation betweeneffective surface <strong>brightness</strong> (S e ) and total magnitude. In fact, S eis a function <strong>of</strong> S 0 and N only (see Eq. 5), and has <strong>the</strong> advantage<strong>of</strong> be<strong>in</strong>g a “natural” comb<strong>in</strong>ation <strong>of</strong> <strong>the</strong>se parameters, <strong>the</strong>nnot depend<strong>in</strong>g on sample def<strong>in</strong>ition. Moreover, this relation is<strong>in</strong>dependent <strong>of</strong> Galactic ext<strong>in</strong>ction.Fig. 6 is a plot <strong>of</strong> S e(B) aga<strong>in</strong>st B T for Virgo and <strong>NGC</strong> <strong>5044</strong><strong>dwarf</strong>s, with <strong>the</strong> same cod<strong>in</strong>gs as Fig. 4. The dashed l<strong>in</strong>e is al<strong>in</strong>ear fit to <strong>the</strong> whole Virgo sample, and <strong>the</strong> dotted l<strong>in</strong>e is a fitto <strong>the</strong> subsample (half-filled triangles) formed with those Virgo<strong>galaxies</strong> that would have r e ≥ 6.8 ′′ at <strong>the</strong> distance <strong>of</strong> <strong>NGC</strong> <strong>5044</strong>.Both fits have fixed slope =1.0, because this is by def<strong>in</strong>ition<strong>the</strong> slope <strong>of</strong> <strong>the</strong> S e vs. V T relation when r e = constant (seeEq. 4). Here, <strong>the</strong> effect <strong>of</strong> distance on <strong>the</strong> distribution <strong>of</strong> observedeffective radii is even more dramatic than <strong>in</strong> Fig. 4.The solid l<strong>in</strong>e is a fit to <strong>the</strong> <strong>NGC</strong> <strong>5044</strong> <strong>Group</strong> data (filledcircles), exclud<strong>in</strong>g N42 and N51 (see below). It is evident thatafter <strong>the</strong> smaller <strong>dwarf</strong>s (affected by see<strong>in</strong>g) were elim<strong>in</strong>ated,most <strong>of</strong> <strong>the</strong> rema<strong>in</strong><strong>in</strong>g <strong>galaxies</strong> have similar effective radii (seeTable 4) <strong>the</strong>n produc<strong>in</strong>g a good correlation between S e and B T ,except for N42 and N51 which are larger and <strong>the</strong>n lie up and to<strong>the</strong> left <strong>of</strong> <strong>the</strong> mean relation. Aga<strong>in</strong>, a distance modulus betweenVirgo and <strong>the</strong> <strong>NGC</strong> <strong>5044</strong> <strong>Group</strong> can be derived, and <strong>the</strong>n used toredef<strong>in</strong>e <strong>the</strong> subsample, etc. This iterative procedure convergedto ∆(m − M) = 2.20 ± 0.08, <strong>in</strong> good agreement with <strong>the</strong>value ∆(m − M) =2.26 obta<strong>in</strong>ed by FS90 us<strong>in</strong>g <strong>the</strong> brightestcluster member method. With this relative distance, N42 andN51 would be larger than <strong>the</strong> largest <strong>dwarf</strong> <strong>in</strong> <strong>the</strong> Virgo sample,<strong>the</strong>n <strong>the</strong>ir exclusion is justified. This use <strong>of</strong> <strong>the</strong> effective surfaceFig. 6. Effective surface <strong>brightness</strong> (S e) vs. apparent blue magnitudesfor <strong>NGC</strong> <strong>5044</strong> <strong>Group</strong> and Virgo <strong>dwarf</strong>s. Cod<strong>in</strong>g is <strong>the</strong> same as for Fig. 4<strong>brightness</strong> vs. lum<strong>in</strong>osity relation as a distance <strong>in</strong>dicator is <strong>the</strong>nequivalent to match<strong>in</strong>g <strong>the</strong> mean effective radii <strong>of</strong> both samples.It is illustrative to note that, when compar<strong>in</strong>g <strong>the</strong> <strong>NGC</strong> <strong>5044</strong><strong>Group</strong> data with <strong>the</strong> CCD photometry <strong>of</strong> a sample <strong>of</strong> Virgo<strong>dwarf</strong>s from Durrell (1997) or <strong>the</strong> Fornax data from CFG, <strong>the</strong>iterative procedure just described fails because <strong>the</strong> nearby samplesalmost vanish after <strong>the</strong> first iteration. For this method towork, <strong>the</strong>n, <strong>the</strong> more distant cluster must be observed with <strong>the</strong>sufficient spatial resolution <strong>in</strong> order that objects with <strong>the</strong> same<strong>in</strong>tr<strong>in</strong>sic sizes are <strong>in</strong>cluded <strong>in</strong> both samples.6. ConclusionsIt is clear that <strong>the</strong> shape – lum<strong>in</strong>osity relation cannot be usedto derive distances to <strong>in</strong>dividual objects, at least until <strong>the</strong> situation<strong>of</strong> bright <strong>dwarf</strong>s with convex <strong>pr<strong>of</strong>iles</strong>, like N42 and N50,is understood. On <strong>the</strong> o<strong>the</strong>r hand, its use to derive mean relativedistances for groups <strong>of</strong> <strong>galaxies</strong> is severely hampered by<strong>the</strong> fact that its slope changes when objects <strong>of</strong> different <strong>in</strong>tr<strong>in</strong>siceffective radii are compared. This requires that samples with<strong>the</strong> same distribution <strong>of</strong> <strong>in</strong>tr<strong>in</strong>sic sizes must be observed, a goalthat is usually not easy to achieve. The data presented <strong>in</strong> thispaper for several <strong>NGC</strong> <strong>5044</strong> <strong>Group</strong> <strong>dwarf</strong> and <strong>in</strong>termediate lum<strong>in</strong>osityellipticals were compared to a specially selected sample<strong>of</strong> Virgo <strong>dwarf</strong>s, try<strong>in</strong>g to fulfill that condition. However,<strong>the</strong> relative distance obta<strong>in</strong>ed <strong>in</strong> this manner was significantlylower than all published values, suggest<strong>in</strong>g that a systematicdifference (maybe observational and/or environmental) is stillpresent between both groups <strong>of</strong> <strong>dwarf</strong>s. It is also worth mention<strong>in</strong>gthat, despite all <strong>galaxies</strong> with poor quality fits to <strong>the</strong>ir<strong>pr<strong>of</strong>iles</strong>, along with evident outliers, were elim<strong>in</strong>ated, rema<strong>in</strong><strong>in</strong>g<strong>the</strong>n only <strong>dwarf</strong>s with good quality CCD <strong>pr<strong>of</strong>iles</strong>, <strong>the</strong> scatter<strong>of</strong> <strong>the</strong> L − N relation rema<strong>in</strong>s relatively high, and this cannotbe assigned to a depth effect, given <strong>the</strong> small size <strong>of</strong> <strong>the</strong> <strong>NGC</strong><strong>5044</strong> <strong>Group</strong> as compared to <strong>the</strong> Virgo Cluster.A relative distance between <strong>the</strong> two groups <strong>in</strong> good agreementwith published values is obta<strong>in</strong>ed with <strong>the</strong> known lum<strong>in</strong>osityvs. effective surface <strong>brightness</strong> relation. However, given <strong>the</strong>
S.A. Cellone: Dwarf <strong>galaxies</strong> <strong>in</strong> <strong>the</strong> <strong>NGC</strong> <strong>5044</strong> <strong>Group</strong> 413small size <strong>of</strong> <strong>the</strong> <strong>NGC</strong> <strong>5044</strong> <strong>Group</strong> sample, and <strong>the</strong> unknown reliability<strong>of</strong> <strong>the</strong> procedure used for equaliz<strong>in</strong>g both samples, thisresult should be taken with care. Perhaps <strong>the</strong> L − N relation,<strong>in</strong>clud<strong>in</strong>g its exceptions, is <strong>the</strong>n more useful for study<strong>in</strong>g <strong>the</strong>structure <strong>of</strong> elliptical <strong>galaxies</strong> than as a precise distance <strong>in</strong>dicator.With this idea, it would be <strong>in</strong>terest<strong>in</strong>g to explore any possibleconnection between <strong>the</strong> shape parameter and o<strong>the</strong>r properties <strong>of</strong><strong>the</strong> <strong>galaxies</strong>, such as velocity dispersion or metallicity. Environmentaleffects should also be <strong>in</strong>vestigated; it is <strong>in</strong>terest<strong>in</strong>g thattwo bright <strong>dwarf</strong>s with convex <strong>pr<strong>of</strong>iles</strong> were found <strong>in</strong> a bl<strong>in</strong>dlyselected, although small sample <strong>of</strong> <strong>the</strong> <strong>NGC</strong> <strong>5044</strong> <strong>Group</strong>, whileno counterparts are known <strong>in</strong> Virgo and Fornax. CCD surface<strong>brightness</strong> <strong>pr<strong>of</strong>iles</strong> for larger samples <strong>of</strong> <strong>dwarf</strong>s and <strong>in</strong>termediatelum<strong>in</strong>osity ellipticals, <strong>in</strong>clud<strong>in</strong>g o<strong>the</strong>r nearby small groups,are needed to establish <strong>the</strong> statistical significance <strong>of</strong> this k<strong>in</strong>d <strong>of</strong><strong>galaxies</strong>.Acknowledgements. The author acknowledges use <strong>of</strong> <strong>the</strong> CCD anddata acquisition system supported under U. S. National Science Foundationgrant AST-90-15827 to R. M. Rich. Special thanks are due toCASLEO staff members Luisa Navarro and J. L. Giuliani for <strong>the</strong>ir helpwith L<strong>in</strong>ux-IRAF <strong>in</strong>stallation.ReferencesAdami C., Nichol R.C., Mazure A., et al., 1998, A&A 334, 765Andredakis Y.C., Peletier R.F., Balcells M., 1995, MNRAS 275, 874B<strong>in</strong>ggeli B., Jerjen H., 1998, A&A 333, 17B<strong>in</strong>ggeli B., Popescu C.C., Tammann G.A., 1993, A&AS 98, 275B<strong>in</strong>ggeli B., Sandage A., Tarenghi M., 1984, AJ 89, 64Bothun G.D., Caldwell N., Schombert J.M., 1989, AJ 98, 1542Burste<strong>in</strong> D., Heiles C., 1984, ApJS 54, 33Caldwell N., Bothun G.D., 1987, AJ 94, 1126Caon N., Capaccioli M., D’On<strong>of</strong>rio M., 1993, MNRAS 265, 1013Cellone S.A., Forte J.C., Geisler D., 1994, ApJS 93, 397 (CFG)Davies J.I., Phillipps S., Cawson M.G.M., Disney M.J., KibblewhiteE.J., 1988, MNRAS 232, 239de Souza R.E., dos Anjos S., 1998, In: Barbuy B., Lapasset E., BaptistaR., Cid Fernandes R. (eds.) Proceed<strong>in</strong>gs <strong>of</strong> Workshop: Science withGem<strong>in</strong>i, (IAG–USP & UFSC), p. 128D’On<strong>of</strong>rio M., Capaccioli M., Caon N., 1994, MNRAS 271, 523D’On<strong>of</strong>rio M., Capaccioli M., Zaggia S.R., Caon N., 1997, MNRAS289, 847Durrell P.R., 1997, AJ 113, 531Durrell P.R., McLaughl<strong>in</strong> D.E., Harris W.E., Hanes D.A., 1996, ApJ463, 543Ferguson H.C., B<strong>in</strong>ggeli B., 1994, A&AR 6, 67Ferguson H.C., Sandage A., 1990, AJ 100, 1 (FS90)Ferrarese L., Freedman W.L., Hill R.J., et al., 1996, ApJ 464, 568Franx M., Ill<strong>in</strong>gworth G., Heckman T., 1989, AJ 98, 538Geisler D., 1996, AJ 111, 480Graham A., Lauer T.R., Colless M., Postman M., 1996, ApJ 465, 534Huchra J., Davis M., Latham D., Tonry J., 1983, ApJS 52, 89Impey C.D., Bothun G.D., Mal<strong>in</strong> D.F., 1988, ApJ 330, 634Karachentseva V.E., Karachentsev I.D., Richter G.M., von BerlepschR., Fritze K., 1987, Astron. Nachr.308, 247Landolt A.U., 1992, AJ 104, 340Peletier R.F., Davies R.L., Ill<strong>in</strong>gworth G.D., Davis L.E., Cawson M.,1990, AJ 100, 1091Prugniel P., 1994, In: Meylan G., Prugniel P. (eds.) ESO/OHP WorkshopDwarf Galaxies, ESO, Garch<strong>in</strong>g, p. 171Saglia R.P., Bender R., Dressler A., 1993a, A&A 279, 75Saglia R.P., Bertsch<strong>in</strong>ger E., Baggley G., et al., 1993b, MNRAS 264,961Sérsic J.L., 1968, Atlas de Galaxias Australes. Observatorio Astronómicode CórdobaThuan T.X., 1983, ApJ 268, 667Young C.K., Currie M.J., 1994, MNRAS 268, L11Young C.K., Currie M.J., 1995, MNRAS 273, 1141Young C.K., Currie M.J., 1998, A&A 333, 795Young C.K., Metcalfe N., Zhu J., Wu H., Chen J., 1998, A&AS 130,173