ACTA SCIENTIARUM POLONORUM - SGGW
ACTA SCIENTIARUM POLONORUM - SGGW
ACTA SCIENTIARUM POLONORUM - SGGW

Create successful ePaper yourself
Turn your PDF publications into a flip-book with our unique Google optimized e-Paper software.
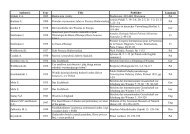
The distribution of social security payments among regions of Poland... 15Table 6. Average monthly social security benefits paid from SII and ASIF according to theprovinces in 2008 (in % of the minimal wage a) )Tabela 6. Przeciętne miesięczne świadczenia emerytalno-rentowe wypłacane przez ZUS i KRUSwedług województw w 2008 roku (w % płacy minimalnej a) )DetailsWyszczególnienieOld-age pensionsEmeryturySII/ZUSASIF//KRUSDisability pensions in caseof inability to work /Rentyz tytułu niezdolnoścido pracyASIF/SII/ZUS /KRUSSurvivor’s pensionsRenty rodzinneSII/ZUSASIF//KRUSin % of the minimal wage/ w % płacy minimalnejDolnośląskie 129.9 64.4 107.6 61.9 117.0 72.3Kujawsko-pomorskie 122.7 67.9 85.1 60.7 104.9 73.1Lubelskie 117.2 67.3 88.4 61.0 98.4 70.1Lubuskie 119.5 62.3 92.0 61.6 102.8 72.0Łódzkie 121.8 66.7 84.8 59.3 105.1 70.2Małopolskie 126.3 64.6 98.1 58.9 111.1 65.8Mazowieckie 134.0 67.7 92.6 58.6 110.9 66.6Opolskie 125.3 65.5 99.2 62.4 109.7 69.0Podkarpackie 113.0 65.2 81.6 60.3 97.0 66.9Podlaskie 116.9 68.3 92.9 59.6 99.4 68.8Pomorskie 129.7 66.4 99.7 59.4 113.7 69.0Śląskie 160.8 59.2 128.1 59.9 148.4 65.8Świętokrzyskie 117.3 65.7 86.2 59.1 100.4 67.5Warmińsko-mazurskie 119.6 68.3 88.6 61.1 101.0 68.2Wielkopolskie 127.1 66.2 90.4 59.8 109.9 66.6Zachodniopomorskie 126.5 66.2 95.8 61.6 109.2 80.6a) The minimum wage in 2008 was 1126.0 PLN (Rozporządzenie Rady Ministrów…).b) Minimalna płaca w 2008 roku wynosiła 1126,0 zł (Rozporządzenie Rady Ministrów…).Source:Źródło:Own elaboration based on: Kwartalna informacja statystyczna 2009, Informacja o świadczeniachpieniężnych... 2009.Opracowanie własne na podstawie: Kwartalna informacja statystyczna 2009, Informacja o świadczeniachpieniężnych... 2009.as well as employees’ social insurance system, were lower than average remuneration inindividual provinces in 2008.Agricultural old-age pensions constituted from about 23% to about 26% of average salaryin 2008. While occupational old-age pensions – from about 43% to about 62% of theremuneration. It was possible to state, in case of disability pensions paid from ASIF, thattheir level was shaped at 23% of average salary. The same benefits, but paid as a part ofthe employees’ social insurance system were more diversified in provinces. Their amountfluctuated from 31% of average salary in Podkarpackie to 49% in Śląskie. The situation wassimilar in case of employees’ survivors’ pensions. Their average monthly level was about37% of average salary in Podkarpackie and almost 57% in Śląskie. However agriculturalsurvivor’s pensions were lower than the average salary about 69–75% (table 7).Oeconomia 10 (1) 2011