An Economic Analysis of the GRDC Investment in Precision - Grains ...
An Economic Analysis of the GRDC Investment in Precision - Grains ...
An Economic Analysis of the GRDC Investment in Precision - Grains ...

Create successful ePaper yourself
Turn your PDF publications into a flip-book with our unique Google optimized e-Paper software.
2. The Program2.1. ObjectivesSIP 09 was established <strong>in</strong> 2002-03 as a national <strong>in</strong>itiative to <strong>of</strong>fer tangible and significantbenefits (to gra<strong>in</strong>growers) through a comb<strong>in</strong>ation <strong>of</strong>:• better match<strong>in</strong>g <strong>of</strong> land use to land capability,• ability to match landscape/paddock characteristics with optimal agronomicpractice (e.g. zone management),• apply<strong>in</strong>g <strong>in</strong>puts at levels and locations where return will be maximised (e.g. VRTmethods),• ability to match with<strong>in</strong>-season agronomy (e.g. additional fertiliser, pesticides) tomapped variation <strong>in</strong> measured crop performance,• <strong>in</strong>creased value <strong>of</strong> outputs (more gra<strong>in</strong>, or gra<strong>in</strong> targeted at higher valuesegregations or markets),• reduced <strong>of</strong>f-site impacts (recharge, sediment, nutrients, pesticides), and• reduced contribution to greenhouse gas emissions (e.g. lower use <strong>of</strong> fossil fuels,lower nitrous oxide emissions from nitrogen fertiliser).Projects funded with<strong>in</strong> <strong>the</strong> Initiative were also required to:• ensure a coord<strong>in</strong>ated approach that br<strong>in</strong>gs toge<strong>the</strong>r key stakeholders to developworld class research, development and implementation <strong>of</strong> PA <strong>in</strong> Australia, withstrong l<strong>in</strong>kages to overseas work <strong>of</strong> this type;• facilitate tra<strong>in</strong><strong>in</strong>g and support <strong>of</strong> researchers, advisers and growers to ensure <strong>the</strong>reis capacity <strong>in</strong> cropp<strong>in</strong>g regions for consistent and reliable <strong>in</strong>terpretation and use <strong>of</strong>PA <strong>in</strong>formation;• ensure that growers can make sound management decisions based on <strong>the</strong><strong>in</strong>formation generated by PA technologies, and will ga<strong>in</strong> economic returnsthrough better decision mak<strong>in</strong>g;• ensure <strong>the</strong> development <strong>of</strong> a range <strong>of</strong> PA systems ( <strong>in</strong>clud<strong>in</strong>g s<strong>of</strong>tware andmach<strong>in</strong>ery) that are relevant and appropriate for different agroclimatic zones andcropp<strong>in</strong>g systems across Australia; and• facilitate <strong>the</strong> adoption <strong>of</strong> effective systems that produce economic benefits togrowers.2.2. Costs and Associated ProjectsEstimates <strong>of</strong> <strong>the</strong> total <strong>in</strong>vestment by <strong>GRDC</strong> and o<strong>the</strong>rs are provided <strong>in</strong> Table 1 for each <strong>of</strong><strong>the</strong> years specified; <strong>the</strong> total <strong>in</strong>vestment is <strong>the</strong> sum <strong>of</strong> <strong>the</strong> project costs as listed <strong>in</strong> Table2)________________________________________________________________________________Agtrans Research Page 6
Table 1: Estimate <strong>of</strong> <strong>Investment</strong> <strong>in</strong> SIP 09 PA (2002 to 2007, nom<strong>in</strong>al $m)Year end<strong>in</strong>g June <strong>GRDC</strong> Research Totalpartners,farmers2003 1.173 1.951 3.1242004 1.173 1.951 3.1242005 1.173 1.951 3.1242006 1.173 1.951 3.1242007 1.173 1.951 3.124Total 5.864 9.754 15.628Source: <strong>GRDC</strong>. Research partners have contributed fund<strong>in</strong>g to approximately match <strong>the</strong> <strong>GRDC</strong> fund<strong>in</strong>g.Additional fund<strong>in</strong>g is ma<strong>in</strong>ly <strong>in</strong>-k<strong>in</strong>d contributions from <strong>the</strong> farmers <strong>in</strong>volved <strong>in</strong> SIP 09. Fund<strong>in</strong>g has beenassumed to be evenly spread over <strong>the</strong> five years. Totals do not balance due to round<strong>in</strong>g.2.3. Program DescriptionThe program <strong>of</strong> 11 projects <strong>in</strong>cludes five <strong>in</strong> <strong>the</strong> five major gra<strong>in</strong> produc<strong>in</strong>g states todevelop <strong>the</strong> capacity <strong>of</strong> State Government research and extension agencies <strong>in</strong> facilitat<strong>in</strong>gadoption <strong>of</strong> effective PA systems. There are also projects with commercial organisations,CSIRO and <strong>the</strong> University <strong>of</strong> Sydney. The program <strong>in</strong>cluded support<strong>in</strong>g activitiesprovid<strong>in</strong>g resources and spatial data to regional projects.Table 2: List <strong>of</strong> Projects <strong>in</strong> SIP 09Project Project Title and Research Organisation<strong>GRDC</strong>fund<strong>in</strong>g($)PartnerContribution($)CSO00017 <strong>Precision</strong> Agriculture Initiative (CSIRO) 1,200,000 1,084,629CTF00002 <strong>Precision</strong> Agriculture Initiative (CTF741,500 2,365,000Solutions)DAN00054 <strong>Precision</strong> Agriculture Initiative (New South 402,713 1,926,675Wales Department <strong>of</strong> Primary Industries)DAQ00067 <strong>Precision</strong> Agriculture Initiative - Eye <strong>in</strong> <strong>the</strong> 417,852 873,780sky to revolutionise nor<strong>the</strong>rn crop production(Queensland Department <strong>of</strong> PrimaryIndustries and Fisheries)DAS00035 Manag<strong>in</strong>g diseases us<strong>in</strong>g <strong>Precision</strong>552,115 848,506Agriculture (South Australian Research andDevelopment Institute)DAV00030 <strong>Precision</strong> Agriculture Initiative (Department 741,294 886,510<strong>of</strong> Primary Industries Victoria)DAW00084 Diagnostic support and tra<strong>in</strong><strong>in</strong>g for <strong>Precision</strong> 400,000 1,110,024Agriculture (Western Australia Department <strong>of</strong>Agriculture)SFX00001 Gammaradiometric & EM31/38 dataacquisition and distribution for <strong>Precision</strong>259,000 0________________________________________________________________________________Agtrans Research Page 7
Agriculture (Silverfox Solutions)SFX00002 Support for <strong>Precision</strong> Agriculture <strong>in</strong>itiative 61,500 106,500and test<strong>in</strong>g <strong>of</strong> stability zones and pseudoharvest <strong>in</strong>dex measures across core sites(Silverfox Solutions)SPAA0003 Improvement <strong>of</strong> Nutrient Management238,500 302,200through Effective use <strong>of</strong> <strong>Precision</strong>Agriculture Technologies <strong>in</strong> <strong>the</strong> Sou<strong>the</strong>rnAustralian Gra<strong>in</strong>s Industry (Sou<strong>the</strong>rn<strong>Precision</strong> Agriculture Association)US00017 <strong>Precision</strong> Agriculture Initiative (University 850,004 250,000<strong>of</strong> Sydney)TOTAL 5,864,478 9,753,8243. OutputsThe pr<strong>in</strong>cipal outputs for <strong>the</strong> <strong>in</strong>vestment <strong>in</strong>clude new opportunities to comb<strong>in</strong>e PA witho<strong>the</strong>r technology to help growers f<strong>in</strong>e-tune <strong>the</strong>ir sow<strong>in</strong>g and <strong>in</strong>-season decisions and todevelop more susta<strong>in</strong>able cropp<strong>in</strong>g patterns based on land capability. The first fouroutputs <strong>in</strong> <strong>the</strong> follow<strong>in</strong>g list are all part <strong>of</strong> VRT tools and techniques that can be appliedto vary management and <strong>in</strong>puts particularly with<strong>in</strong> paddocks. The last one is on PA atwhole-property and catchment scales.The outputs <strong>in</strong>clude (<strong>GRDC</strong>, 2007a):• guidel<strong>in</strong>es on <strong>the</strong> value <strong>of</strong> new sources, types and scales <strong>of</strong> PA data l<strong>in</strong>ked todiagnosis <strong>of</strong> underly<strong>in</strong>g causes <strong>of</strong> spatial variability <strong>in</strong> yield and gross marg<strong>in</strong>s• decision framework to assist growers/advisers <strong>in</strong> mak<strong>in</strong>g agronomic decisionsbased on data about soil-borne disease <strong>in</strong>oculum levels <strong>in</strong> paddock managementzones• updated and expanded guidel<strong>in</strong>es enabl<strong>in</strong>g growers to undertake on-farm test<strong>in</strong>g<strong>of</strong> new varieties, variable rate application, and o<strong>the</strong>r <strong>in</strong>novations <strong>in</strong> agronomy,us<strong>in</strong>g PA methods• tested methods to comb<strong>in</strong>e paddock/farm management classes with real-time cropsens<strong>in</strong>g (e.g. for weeds, moisture, and N status) to improve <strong>the</strong> pr<strong>of</strong>itability <strong>of</strong>seasonal crop management• extension <strong>of</strong> PA methods to whole-property and catchment scales to improve landmanagement decisionsThe outputs produced by <strong>the</strong> projects conducted with grower groups <strong>in</strong> <strong>the</strong> ma<strong>in</strong> gra<strong>in</strong>produc<strong>in</strong>g regions have been consolidated and <strong>in</strong>tegrated <strong>in</strong> one key output, <strong>the</strong> <strong>Precision</strong>Agriculture Manual (<strong>GRDC</strong>, 2006). The Manual presents <strong>the</strong> key learn<strong>in</strong>gs from <strong>the</strong>project <strong>in</strong> four key stages for growers to progress through.________________________________________________________________________________Agtrans Research Page 8
StageQuestion answered by <strong>the</strong> PA Manual1 Is <strong>the</strong>re spatial variation?2 What are likely causes?3 Is it worth chang<strong>in</strong>g to non-uniform management?4 What needs to be done to manage <strong>the</strong> spatial variation?Simple and tested rules <strong>of</strong> thumb are now available to support decision-mak<strong>in</strong>g onwhe<strong>the</strong>r to vary management with<strong>in</strong> a paddock (i.e. whe<strong>the</strong>r it is likely to beeconomically worthwhile to do so). Key questions that determ<strong>in</strong>e whe<strong>the</strong>r <strong>the</strong>re arelikely to be significant benefits <strong>in</strong>clude:• how big does a paddock need to be? (a Western Australian example is <strong>of</strong> <strong>the</strong> order<strong>of</strong> 60 ha), and• how much yield variation is needed with<strong>in</strong> <strong>the</strong> paddock? (a Western Australianexample is <strong>of</strong> <strong>the</strong> order <strong>of</strong> 1 to 1.5 t/ha).O<strong>the</strong>r key outputs that will underp<strong>in</strong> adoption <strong>of</strong> PA <strong>in</strong>clude <strong>the</strong> development <strong>of</strong> tra<strong>in</strong><strong>in</strong>gmaterials and well-tested and rigorous protocols published <strong>in</strong> <strong>the</strong> lead<strong>in</strong>g <strong>in</strong>ternationalagronomy journal to cut through <strong>the</strong> complexity <strong>of</strong> <strong>the</strong> data analysis (Taylor et al, 2007).The <strong>GRDC</strong> toge<strong>the</strong>r with <strong>the</strong> Cotton Research and Development Corporation and <strong>the</strong>Grape and W<strong>in</strong>e Research and Development Corporation are presently fund<strong>in</strong>g <strong>the</strong>construction <strong>of</strong> tra<strong>in</strong><strong>in</strong>g materials for <strong>in</strong>dustry and tertiary level workshops and courses <strong>in</strong>PA.4. Outcomes and BenefitsThe primary outcome is from gra<strong>in</strong> farmers chang<strong>in</strong>g crop management activities to takeaccount <strong>of</strong> improved knowledge <strong>of</strong> landscape and paddock variability. Farmers will beable to answer <strong>the</strong> key question <strong>of</strong> whe<strong>the</strong>r it is pr<strong>of</strong>itable to vary management with<strong>in</strong> apaddock that previously had to be managed on a uniform basis. Changes apply to landuse for better match<strong>in</strong>g with land suitability, and to crop <strong>in</strong>puts us<strong>in</strong>g VRT. Vary<strong>in</strong>gfertiliser <strong>in</strong>puts by management zones will result <strong>in</strong> a better match between <strong>the</strong> fertiliserapplied and crop requirements, and reduce <strong>of</strong>f-site impacts.A summary <strong>of</strong> <strong>the</strong> pr<strong>in</strong>cipal types <strong>of</strong> benefits and related costs associated with <strong>the</strong>outcomes <strong>of</strong> <strong>the</strong> project is shown <strong>in</strong> Table 3.________________________________________________________________________________Agtrans Research Page 9
Table 3: Categories <strong>of</strong> Benefits from <strong>the</strong> <strong>Investment</strong>BenefitsProductivity and Pr<strong>of</strong>itability• Increased pr<strong>of</strong>itability <strong>in</strong>clud<strong>in</strong>g from time sav<strong>in</strong>gs and from better control <strong>of</strong><strong>in</strong>puts• Opportunities for improved risk management• Development <strong>of</strong> a market for PA technologyEnvironmental• Reduced <strong>of</strong>f-site impacts from excess nutrients and herbicides result<strong>in</strong>g <strong>in</strong>improved water quality and aquatic habitats• Reduced degradation <strong>of</strong> natural resources from improved match between landcapability and land use• Improved capacity to show <strong>in</strong>creased susta<strong>in</strong>ability us<strong>in</strong>g EnvironmentalManagement SystemsSocial• Benefits <strong>in</strong> terms <strong>of</strong> reduced operator fatigue contribut<strong>in</strong>g to improvedoccupational health and safety outcomes, and opportunity to use less skilledlabour for mach<strong>in</strong>ery operation• Streng<strong>the</strong>n<strong>in</strong>g capacity <strong>of</strong> rural regions to use new developments <strong>in</strong><strong>in</strong>formation technology4.1. Public versus Private BenefitsThe benefits readily identified from <strong>the</strong> <strong>in</strong>vestment <strong>in</strong> PA are predom<strong>in</strong>antly privatebenefits and will be captured by gra<strong>in</strong> producers. The benefits associated with naturalresources and lowered contam<strong>in</strong>ants <strong>in</strong> waterways (stemm<strong>in</strong>g from less availablenutrients and herbicides) can be considered public benefits that are sp<strong>in</strong><strong>of</strong>fs from <strong>the</strong>productivity-driven management changes.It is likely that some fur<strong>the</strong>r development <strong>of</strong> PA and its adoption would have occurred if<strong>GRDC</strong> had not supported <strong>the</strong> SIP 09 program. This scenario is explored later wherebenefits from <strong>the</strong> <strong>in</strong>vestment are compared to what would have happened without <strong>the</strong><strong>in</strong>vestment.If <strong>GRDC</strong> did not receive fund<strong>in</strong>g (or received less fund<strong>in</strong>g) from <strong>the</strong> Commonwealth,most <strong>of</strong> <strong>the</strong> SIP 09 projects probably still would have been funded at some lower level. Itis considered <strong>the</strong> <strong>in</strong>vestment was about “<strong>in</strong> <strong>the</strong> middle” <strong>of</strong> <strong>the</strong> list <strong>of</strong> <strong>GRDC</strong> priorities at<strong>the</strong> time <strong>of</strong> <strong>in</strong>vestment. Indications are <strong>the</strong> reduced fund<strong>in</strong>g would have been more at <strong>the</strong>expense <strong>of</strong> <strong>the</strong> State agencies <strong>in</strong>volved <strong>in</strong> SIP 09. Some <strong>of</strong> that <strong>in</strong>vestment wasconsidered more as capacity build<strong>in</strong>g. SIP 09 would <strong>the</strong>n have had a greater emphasis onresearch and work<strong>in</strong>g with commercial partners. This could have made subsequentadoption more dependent on promotion by commercial service agencies. Risk may havebeen greater given that many <strong>of</strong> <strong>the</strong>se are likely to be small firms <strong>in</strong> a new market.________________________________________________________________________________Agtrans Research Page 10
As <strong>GRDC</strong> obta<strong>in</strong>s about 40% <strong>of</strong> its research fund<strong>in</strong>g from <strong>the</strong> Commonwealth, it isestimated that about 60% <strong>of</strong> <strong>the</strong> <strong>in</strong>vestment <strong>in</strong> SIP 009 would have been made if <strong>GRDC</strong>had received no Commonwealth fund<strong>in</strong>g. With reduced Commonwealth fund<strong>in</strong>g, <strong>the</strong>level <strong>of</strong> <strong>in</strong>vestment would have been between 60% and 100% <strong>of</strong> <strong>the</strong> actual <strong>in</strong>vestment.4.2. Distribution <strong>of</strong> Benefits Along <strong>the</strong> Gra<strong>in</strong>s Supply Cha<strong>in</strong>Some <strong>of</strong> <strong>the</strong> benefits from better target<strong>in</strong>g <strong>of</strong> <strong>in</strong>puts and <strong>the</strong> associated higher productionwill be passed along <strong>the</strong> supply cha<strong>in</strong> to gra<strong>in</strong> processors and o<strong>the</strong>r users <strong>of</strong> gra<strong>in</strong><strong>in</strong>clud<strong>in</strong>g consumers. As <strong>the</strong> gra<strong>in</strong>s <strong>in</strong>dustry is predom<strong>in</strong>antly export orientated, benefitswill be captured <strong>in</strong> <strong>the</strong> ma<strong>in</strong> by gra<strong>in</strong> producers. The impact on suppliers <strong>of</strong> <strong>in</strong>puts (suchas fertiliser) is uncerta<strong>in</strong>. The project can be expected to give a significant boost to<strong>in</strong>dustries develop<strong>in</strong>g and support<strong>in</strong>g <strong>the</strong> range <strong>of</strong> electronic technologies on which PA isbased. Much <strong>of</strong> <strong>the</strong> development will be <strong>in</strong> farm<strong>in</strong>g regions.4.3. Benefits to o<strong>the</strong>r Primary IndustriesIn so far as <strong>the</strong>re may have been collaboration with o<strong>the</strong>r primary <strong>in</strong>dustries (e.g. cottonand grapes) it is possible <strong>the</strong>re were some sp<strong>in</strong><strong>of</strong>f benefits from <strong>the</strong> <strong>in</strong>vestment to o<strong>the</strong>rprimary <strong>in</strong>dustries. However, <strong>the</strong>se sp<strong>in</strong><strong>of</strong>fs could have flowed both to and from <strong>the</strong>gra<strong>in</strong>s <strong>in</strong>dustry.4.4. Match with National PrioritiesThe Australian Government’s national and rural R&D priorities are reproduced <strong>in</strong> Table4.Table 4: National and Rural R&D Research Priorities 2007-08Australian GovernmentNational ResearchRural Research PrioritiesPriorities1. <strong>An</strong> environmentally 1. Productivity and add<strong>in</strong>g valuesusta<strong>in</strong>able Australia2. Supply cha<strong>in</strong> and markets2. Promot<strong>in</strong>g and3. Natural resource managementma<strong>in</strong>ta<strong>in</strong><strong>in</strong>g good health3. Frontier technologies forbuild<strong>in</strong>g and transform<strong>in</strong>gAustralian <strong>in</strong>dustries4. Safeguard<strong>in</strong>g Australia4. Climate variability and climatechange5. BiosecuritySupport<strong>in</strong>g <strong>the</strong> priorities:1. Innovation skills2. TechnologySIP 09 has made an important but difficult to quantify contribution to National ResearchPriority 1 and Rural Research Priority 3 through better match<strong>in</strong>g land use to landcapability and reduced nutrient and chemical loss <strong>of</strong>f farms with ensu<strong>in</strong>g water quality <strong>in</strong>waterways and groundwater with potentially enhanced biodiversity implications.________________________________________________________________________________Agtrans Research Page 11
The major contribution however is to Rural Research Priority 1 where higher crop yieldstoge<strong>the</strong>r with lowered <strong>in</strong>put use are be<strong>in</strong>g observed. In this context <strong>the</strong> <strong>in</strong>vestment alsoaddresses Rural Research Priority 4 as seasonal climate predictions can be taken <strong>in</strong>toaccount <strong>in</strong> <strong>the</strong> technologies be<strong>in</strong>g applied.The <strong>in</strong>vestment has made also a large contribution to National Research Priority 3 andhas demonstrated <strong>in</strong>novation skills and new technologies (Support<strong>in</strong>g Rural Researchpriorities). Examples <strong>in</strong>clude use <strong>of</strong> GPS technologies, implements with variable ratecapacity and variable rate controllers.5. Quantification <strong>of</strong> Benefits5.1. The scope <strong>of</strong> SIP 09The <strong>in</strong>itiative, SIP 09, focused on <strong>the</strong> less researched aspects <strong>of</strong> PA, particularly onunderstand<strong>in</strong>g with<strong>in</strong>-paddock variation and on opportunities to use o<strong>the</strong>r than uniformmanagement. The most widely adopted PA tools are GPS position<strong>in</strong>g and guidancesystems, particularly for controll<strong>in</strong>g crop spray<strong>in</strong>g and avoid<strong>in</strong>g overlap. Theaffordability and ease <strong>of</strong> use has <strong>in</strong>creased rapidly <strong>in</strong> <strong>the</strong> last few years. The driv<strong>in</strong>gfactor has been <strong>the</strong> development <strong>of</strong> harvester yield monitors coupled with GPS reveal<strong>in</strong>g<strong>the</strong> patterns <strong>of</strong> yield variability with<strong>in</strong> paddocks.SIP 09 <strong>in</strong>cluded assessments <strong>of</strong> new tools, particularly VRT based on more effectiveyield mapp<strong>in</strong>g. Yield mapp<strong>in</strong>g requires a GPS, a sensor data logger and s<strong>of</strong>tware tocompile a yield map, while variable rate technology (VRT) requires additionally avariable rate controller and an implement with variable rate capability.The focus <strong>in</strong> this evaluation <strong>of</strong> SIP 09 is on <strong>the</strong> benefits aris<strong>in</strong>g from technologies andfrom <strong>in</strong>formation developed by <strong>the</strong> projects <strong>in</strong> SIP 09, ra<strong>the</strong>r than <strong>the</strong> broader benefitsfrom <strong>the</strong> adoption <strong>of</strong> PA. The boundary <strong>of</strong> <strong>the</strong> evaluation is def<strong>in</strong>ed <strong>in</strong> pr<strong>in</strong>ciple clearlyenough. In practice <strong>the</strong> benefits from SIP 09 are only those additional to <strong>the</strong> benefitsbe<strong>in</strong>g realised and accru<strong>in</strong>g as a result <strong>of</strong> a range <strong>of</strong> prior <strong>in</strong>vestments <strong>in</strong> PA by numerousorganisations and by <strong>in</strong>dividual farmers over <strong>the</strong> last decade. A survey at <strong>the</strong> beg<strong>in</strong>n<strong>in</strong>g <strong>of</strong>SIP 09 showed that only one third <strong>of</strong> <strong>the</strong> respondents to <strong>the</strong> survey form <strong>in</strong> <strong>the</strong> <strong>GRDC</strong>publication, “Ground Cover” were us<strong>in</strong>g PA. Yield monitors, GPS guidance andcontrolled traffic farm<strong>in</strong>g systems were used by one half <strong>the</strong> respondents us<strong>in</strong>g PA dur<strong>in</strong>g2003-04 (Price, 2004). In addition to contributions to <strong>the</strong> broader PA approach fromresearch, <strong>the</strong>re have recently been rapid developments <strong>in</strong> mach<strong>in</strong>ery with basic PAcomponents becom<strong>in</strong>g standard on some farm mach<strong>in</strong>ery and with costs fall<strong>in</strong>g rapidly.By 2002 <strong>the</strong>re had been developments <strong>in</strong> some <strong>of</strong> <strong>the</strong> aspects <strong>of</strong> PA, particularly <strong>in</strong>Controlled Traffic and Traml<strong>in</strong><strong>in</strong>g. These applications were to some extent dependent onPA technologies, such as GPS and guidance systems. In some regions, spray<strong>in</strong>gcontractors with GPS can provide a low cost entry to Traml<strong>in</strong><strong>in</strong>g and Controlled Traffic.Guidance systems and yield monitors are <strong>in</strong>creas<strong>in</strong>gly becom<strong>in</strong>g standard items <strong>in</strong> newfarm mach<strong>in</strong>ery. The evaluation will <strong>the</strong>refore assume conservatively that <strong>the</strong> outcomes________________________________________________________________________________Agtrans Research Page 12
<strong>of</strong> SIP 09 will be from adoption <strong>of</strong> <strong>the</strong> newer practices such as VRT by farmers alreadyus<strong>in</strong>g basic PA technologies.SIP 09 will result <strong>in</strong> a wider range <strong>of</strong> benefits than those that can be more easilyquantified by adopt<strong>in</strong>g VRT. Growers who adopt some aspects <strong>of</strong> PA, such as use <strong>of</strong>2 cm GPS or analysis <strong>of</strong> biomass imagery, can ga<strong>in</strong> a range <strong>of</strong> benefits such as anelevation map to help manage frost risk or improve paddock layout, an ability to useshielded sprayers or to sow <strong>in</strong>to <strong>the</strong> <strong>in</strong>ter-row, identification <strong>of</strong> problem areas for closer<strong>in</strong>spection on <strong>the</strong> ground, or simply a greater knowledge <strong>of</strong> which parts <strong>of</strong> <strong>the</strong> paddock orfarm produce <strong>the</strong> biggest share <strong>of</strong> pr<strong>of</strong>it and should <strong>the</strong>refore be <strong>the</strong> highest priority foragronomic management. O<strong>the</strong>r benefits reported by growers <strong>in</strong>volved <strong>in</strong> SIP 09 <strong>in</strong>cludedaccurate area maps <strong>of</strong> paddocks (valuable <strong>in</strong> negotiat<strong>in</strong>g contracted operations), an abilityto measure <strong>the</strong> effectiveness <strong>of</strong> contracted operations such as fertiliser spread<strong>in</strong>g, greaterunderstand<strong>in</strong>g <strong>of</strong> where paddock zones are on fertiliser response curves and hence likelyresponse to fur<strong>the</strong>r nutrient <strong>in</strong>puts, and ability to improve <strong>the</strong> f<strong>in</strong>ancial return fromdisease control methods by target<strong>in</strong>g zones with high <strong>in</strong>oculum levels.Environmental benefits could be substantial from less wastage <strong>of</strong> fertiliser. The majority<strong>of</strong> social benefits from PA emanate from guidance and auto-steer, as opposed to VRT.Such benefits <strong>in</strong>clude reduced fatigue and ability to use less skilled labour.However, all <strong>the</strong>se potential benefits are difficult to assess quantitatively as <strong>the</strong>irapplication and scale will vary widely between locations and <strong>in</strong>dividual cropp<strong>in</strong>genterprises. Hence <strong>the</strong> analysis below deals only with <strong>the</strong> benefits related to greateruptake <strong>of</strong> VRT.5.2. The economic benefits from us<strong>in</strong>g VRTThe benefits arise primarily from chang<strong>in</strong>g from manag<strong>in</strong>g a paddock uniformly tomanag<strong>in</strong>g accord<strong>in</strong>g to variability. The diagnosis <strong>of</strong> <strong>the</strong> underly<strong>in</strong>g factors determ<strong>in</strong><strong>in</strong>gyield variability can be complex. A wide range <strong>of</strong> confus<strong>in</strong>g (at least <strong>in</strong>itially) zonalmaps can be produced, for example based on yield from yield monitors. The yields andgra<strong>in</strong> prote<strong>in</strong> data could <strong>the</strong>n be used to generate gross marg<strong>in</strong>s. O<strong>the</strong>r maps can bereadily purchased from a range <strong>of</strong> crop (biomass) imagery usually available for severalyears previously and <strong>in</strong>dicat<strong>in</strong>g <strong>the</strong> status <strong>of</strong> <strong>the</strong> crop. In some locations, a series <strong>of</strong> mapsover several years might be analysed and syn<strong>the</strong>sised. A high yield<strong>in</strong>g zone <strong>in</strong> one yearcan be low yield<strong>in</strong>g <strong>the</strong> next. <strong>An</strong> analysis over four seasons us<strong>in</strong>g high, medium and lowclusters showed that only 7 per cent <strong>of</strong> one 100 ha paddock was consistently <strong>in</strong> <strong>the</strong> samecluster each year (Brennan et al, 2007). The SIP 09 projects developed guidel<strong>in</strong>es tobreak through <strong>the</strong> complexity, for example def<strong>in</strong><strong>in</strong>g how much <strong>of</strong> a paddock needed to beconsistent from year to year to justify VRT. But <strong>the</strong> extent to which VRT can be appliedgenerally cannot easily be estimated. There are large tracts <strong>of</strong> land used by <strong>the</strong> gra<strong>in</strong>s<strong>in</strong>dustry which at least superficially appear relatively uniform <strong>in</strong> yields.________________________________________________________________________________Agtrans Research Page 13
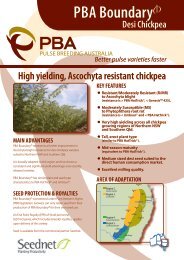
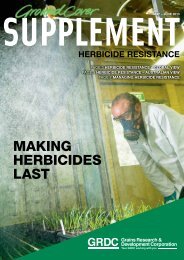
Figure 1: Areas <strong>of</strong> Pr<strong>of</strong>it and Loss for a Paddock <strong>in</strong> Western AustraliaFigure 1 shows areas <strong>of</strong> pr<strong>of</strong>it and loss for a paddock <strong>in</strong> Western Australia, based onaverage gross marg<strong>in</strong>s for five years (<strong>GRDC</strong>, 2006). The gross marg<strong>in</strong> map provides <strong>the</strong>basis for decisions on vary<strong>in</strong>g <strong>in</strong>put rates or o<strong>the</strong>r aspects <strong>of</strong> crop management. Where<strong>the</strong> farmer has confidence <strong>in</strong> <strong>the</strong> underly<strong>in</strong>g environmental factors contribut<strong>in</strong>g to <strong>the</strong>variation, <strong>the</strong> maps can <strong>the</strong>n be used to def<strong>in</strong>e zones where <strong>in</strong>puts can be varied. In <strong>the</strong>example above, <strong>the</strong>re are some areas where average gross marg<strong>in</strong>s are actually negativeand might <strong>the</strong>refore only be pr<strong>of</strong>itable by reduc<strong>in</strong>g some <strong>in</strong>puts. In extreme cases andwhere <strong>the</strong> size and location are suitable, <strong>the</strong>re will be areas where cropp<strong>in</strong>g isdiscont<strong>in</strong>ued and a more susta<strong>in</strong>able land use <strong>in</strong>troduced.The aim <strong>of</strong> a VRT approach is to <strong>in</strong>tegrate a range <strong>of</strong> <strong>in</strong>formation on <strong>the</strong> crop and fromei<strong>the</strong>r paddock-wide or targeted soil measurements to optimise pr<strong>of</strong>itability. Soilelectrical conductivity and digital elevation are two most useful environmental datalayers that only need to be measured once to def<strong>in</strong>e and map variability. Conductivitycan be highly correlated with available soil water, <strong>of</strong>ten a key factor <strong>in</strong> determ<strong>in</strong><strong>in</strong>g yieldvariability. SIP 09 has established a statistical protocol us<strong>in</strong>g readily available freewareto determ<strong>in</strong>e <strong>the</strong> most effective data based on production and environment layers (Tayloret al, 2007). Typically a paddock would <strong>the</strong>n be managed as zones each with its ownoptimum level <strong>of</strong> <strong>in</strong>puts. Test strips and targeted soil sampl<strong>in</strong>g would first determ<strong>in</strong>e <strong>the</strong>optimum levels. The <strong>in</strong>herent complexity will <strong>in</strong>evitably result <strong>in</strong> a lag between <strong>the</strong><strong>in</strong>itial VRT expenditure and result<strong>in</strong>g benefits. The example <strong>in</strong> Table 5 illustrates <strong>the</strong>basics <strong>of</strong> VRT aimed at <strong>in</strong>creas<strong>in</strong>g overall paddock pr<strong>of</strong>itability.With VRT, <strong>in</strong>puts such as fertiliser can be varied by a controller on <strong>the</strong> fertiliser spreader.The zone <strong>of</strong> <strong>the</strong> spreader’s current location is determ<strong>in</strong>ed by a GPS. In <strong>the</strong> Table 5example, <strong>the</strong> optimum fertiliser rate is <strong>in</strong>creased on <strong>the</strong> High Productivity Zone andreduced on <strong>the</strong> Low Productivity Zone. The comparisons are with <strong>the</strong> Medium Zonewhere <strong>the</strong> rate is unchanged. The <strong>in</strong>creased yield from a lower rate <strong>in</strong> <strong>the</strong> Low Zone________________________________________________________________________________Agtrans Research Page 14
esults from excess fertiliser reduc<strong>in</strong>g yield from too rapid early growth and subsequenthay<strong>in</strong>g <strong>of</strong>f and production <strong>of</strong> a high level <strong>of</strong> screen<strong>in</strong>gs.Table 5: Example <strong>of</strong> Changes <strong>in</strong> Inputs and Outputs us<strong>in</strong>g Variable Rate TechnologyCompared with Medium ZoneZones(based on productivity) Increased Fertiliser % Increased Yield %High +50% +10%Medium No change No changeLow -30% +5%Source: Robertson et al (2006)The benefits from VRT will vary between seasons, paddocks, farms and regions. Thebenefits are highly dependent on• <strong>the</strong> temporal and spatial variability <strong>in</strong> yields, and• <strong>the</strong> sensitivity <strong>of</strong> <strong>the</strong> optimal pr<strong>of</strong>it to vary<strong>in</strong>g levels <strong>of</strong> <strong>in</strong>puts.With<strong>in</strong> a paddock, <strong>the</strong> optimal level <strong>of</strong> an <strong>in</strong>put such as nitrogen fertiliser will vary with<strong>the</strong> site with<strong>in</strong> <strong>the</strong> paddock and <strong>the</strong> season. For example <strong>the</strong> optimal level <strong>of</strong> nitrogen <strong>in</strong> adeep soil with a high water hold<strong>in</strong>g capacity will be much higher <strong>in</strong> a good season thanfor a shallow soil <strong>in</strong> a poor season. A capacity to monitor soil water at <strong>the</strong> start <strong>of</strong> <strong>the</strong>season and to forecast seasonal ra<strong>in</strong>fall can <strong>the</strong>refore be important prerequisites if with<strong>in</strong>paddock variability is to be managed by vary<strong>in</strong>g nitrogen rates. These are practices thatare <strong>in</strong>creas<strong>in</strong>gly be<strong>in</strong>g adopted with<strong>in</strong> <strong>the</strong> gra<strong>in</strong> <strong>in</strong>dustry.The sensitivity <strong>of</strong> pr<strong>of</strong>it to <strong>in</strong>put level is shaped by <strong>the</strong> relative prices <strong>of</strong> <strong>the</strong> <strong>in</strong>puts andoutputs toge<strong>the</strong>r with <strong>the</strong> biophysical response <strong>of</strong> <strong>the</strong> crop for <strong>the</strong> specific site and season.In a general sense, <strong>the</strong> response curve is typically flat <strong>in</strong> <strong>the</strong> vic<strong>in</strong>ity <strong>of</strong> <strong>the</strong> optimal level<strong>of</strong> <strong>the</strong> <strong>in</strong>put. For <strong>the</strong> paddock analysed by Brennan et al (2007), apply<strong>in</strong>g nitrogen at onehalf <strong>the</strong> optimal pr<strong>of</strong>it-maximis<strong>in</strong>g rate only reduced pr<strong>of</strong>it by about 10%. Clearly <strong>in</strong>some situations, <strong>the</strong>re will be no return from too much effort <strong>in</strong> f<strong>in</strong>e-tun<strong>in</strong>g <strong>in</strong>puts.Survey results are available for 12 farms represent<strong>in</strong>g <strong>the</strong> major gra<strong>in</strong> regions (Table 6).The first six farms (Robertson et al, 2006) <strong>in</strong>clude three from Western Australia and threefrom New South Wales. The o<strong>the</strong>r six farmers are from South Australia (McCallum,2007). The surveys are based on all additional costs <strong>of</strong> chang<strong>in</strong>g to VRT and <strong>in</strong>cludechanges <strong>in</strong> fertiliser costs, <strong>the</strong> farmers labour costed at $500/day to prepare yield maps,and o<strong>the</strong>r costs ei<strong>the</strong>r capital or annual to purchase additional equipment and maps.________________________________________________________________________________Agtrans Research Page 15
FarmercodeTable 6: Benefits from <strong>Precision</strong> Agriculture and Variable Rate Technologyfor 12 Australian FarmersYears PAexperienceAreaCropped(ha)Capital<strong>Investment</strong><strong>in</strong> PA<strong>in</strong>clud<strong>in</strong>gVRT($/ha)<strong>An</strong>nual Benefit($/ha)VRT O<strong>the</strong>r TotalWA 1 9 2,600 35 16 5 21WA 2 2 5,800 33 7 15 22WA 3 6 3,400 19 1 20 21NSW 1 7 1,250 44 22 8 30NSW 2 8 3,430 28 20 4 24NSW 3 10 4,000 14 7 7 14SA 1 7 3,000 23 7 4 11SA 2 8 1,600 62 5 8 13SA 3 2 2,700 27 0 21 21SA 4 10 2,340 15 10 5 15SA 5 5 4,475 12 8 2 10SA 6 10 1,200 62 9 28 37Average 7 3,000 31 9 11 20Sources: Robertson et al (2007) and McCallum (2007)PA has only a brief history <strong>in</strong> applications <strong>in</strong> Australian farm<strong>in</strong>g and VRT even less. Asdiscussed previously some applications related to PA were beg<strong>in</strong>n<strong>in</strong>g to be more widelyadopted <strong>in</strong> <strong>the</strong> late 1990s and <strong>the</strong>n when SIP 09 began <strong>in</strong> 2002. The farmers <strong>in</strong> <strong>the</strong> surveywere <strong>the</strong>refore clearly pioneers <strong>in</strong> adapt<strong>in</strong>g PA and <strong>in</strong> mak<strong>in</strong>g practical use <strong>of</strong> VRT. Priorto SIP 09 <strong>the</strong>re had only been m<strong>in</strong>or research expenditure on VRT. Early farmerapplications were dependent on farmers develop<strong>in</strong>g comput<strong>in</strong>g skills as needed, andbacked up by advisers and consultants. S<strong>of</strong>tware was <strong>of</strong>ten developed on <strong>the</strong> job oradapted from overseas. Thus <strong>in</strong> 2002 when SIP 09 began <strong>the</strong>re would have been only asmall prior research expenditure or benefits that could be attributed to VRT.The survey <strong>of</strong> benefits from PA shows that benefits from VRT averaged $9/ha with abetween-farm range from zero to $22/ha. The farm with <strong>the</strong> zero VRT benefit had onlyrecently started. The farm with $1/ha benefit was us<strong>in</strong>g yield mapp<strong>in</strong>g to guide <strong>in</strong>puts ononly a small part <strong>of</strong> <strong>the</strong> farm because <strong>of</strong> uncerta<strong>in</strong>ty on benefits <strong>in</strong> o<strong>the</strong>r areas. Benefits<strong>in</strong> <strong>the</strong> ‘O<strong>the</strong>r’ category are primarily from reduced spray overlap. Benefits from reducedspray overlap are now easier to achieve given <strong>the</strong> PA capacity <strong>in</strong> terms <strong>of</strong> guidance andauto-steer that are now standard <strong>in</strong> new mach<strong>in</strong>ery and have <strong>the</strong>refore not been attributedto SIP 09.Variable rate applications <strong>of</strong> herbicide are likely to be an <strong>in</strong>creas<strong>in</strong>g area <strong>of</strong> application <strong>of</strong>VRT <strong>in</strong> <strong>the</strong> future. There was only one example <strong>in</strong> <strong>the</strong> survey <strong>of</strong> a farmer where <strong>the</strong>re________________________________________________________________________________Agtrans Research Page 16
were benefits from reduced herbicide application apart from reductions due tom<strong>in</strong>imis<strong>in</strong>g spray overlap. Weed activated mapp<strong>in</strong>g and spray<strong>in</strong>g systems based on VRTare currently be<strong>in</strong>g developed. Sav<strong>in</strong>gs <strong>in</strong> herbicide are between $20 to $30 per hectare(Brownhill, 2006). The benefits that can be attributed will be limited to technologyalready available. <strong>Investment</strong> additional to SIP 09 may be needed to develop newtechnologies based on VRT.The changes <strong>in</strong> gross marg<strong>in</strong>s need to be reduced by an annual capital allowance basedon extra capital required for VRT. For farmers already set up with key PA components,<strong>the</strong> additional capital costs for VRT are now only <strong>of</strong> <strong>the</strong> order <strong>of</strong> $10,000 which <strong>in</strong>cludesa variable rate controller where not <strong>in</strong>cluded and some <strong>in</strong>itial zone analysis. Thecontroller will be adequate for a range <strong>of</strong> farm sizes. Based on $10/ha for a 1,000 hacropped area and a life <strong>of</strong> 10 years, an approximate annualised capital cost is <strong>of</strong> <strong>the</strong> order<strong>of</strong> $1/ha. A reduction <strong>of</strong> $1/ha results <strong>in</strong> benefits for VRT <strong>of</strong> $8/ha. In some respects,this is a conservative estimate <strong>of</strong> <strong>the</strong> benefits likely to be available <strong>in</strong> future. The surveyfarmers were pioneer<strong>in</strong>g and did not have <strong>the</strong> advantage <strong>of</strong> all outputs from SIP 09. But,<strong>the</strong>y did have atypical skills and levels <strong>of</strong> support not likely to be characteristics <strong>of</strong>adoption more generally. <strong>An</strong>o<strong>the</strong>r factor to take <strong>in</strong>to account is that some <strong>of</strong> <strong>the</strong> farmershad limited data on VRT o<strong>the</strong>r than from trial strips and <strong>the</strong>se may overestimate benefitson larger areas. To ensure a conservative approach, a 25% reduction is warranted to givean assumed benefit <strong>of</strong> $6/ha. In addition to account for <strong>the</strong> time taken to fully trial andimplement VRT, benefits are assumed to lag adoption and <strong>in</strong>crease from zero to $6/haover four years.5.3. Farmers potentially benefit<strong>in</strong>g from SIP 09There is a wide range <strong>of</strong> gra<strong>in</strong> farms particularly <strong>in</strong> terms <strong>of</strong> <strong>the</strong>ir dependence on <strong>in</strong>comefrom gra<strong>in</strong> and on size <strong>of</strong> <strong>the</strong> farm bus<strong>in</strong>ess. Many gra<strong>in</strong> farms have major sheep or beefcattle enterprises <strong>of</strong>ten closely <strong>in</strong>tegrated with gra<strong>in</strong> farm<strong>in</strong>g. Experience with PA hasshown that larger farms are more likely to <strong>in</strong>vest <strong>in</strong> PA, particularly because <strong>the</strong>re areeconomies <strong>of</strong> scale and components <strong>of</strong> PA such as vehicle guidance systems and yieldmonitor<strong>in</strong>g are becom<strong>in</strong>g standard on larger mach<strong>in</strong>ery purchases. A size <strong>of</strong> 1,000 hacropped is suggested as a m<strong>in</strong>imum necessary for a pr<strong>of</strong>itable <strong>in</strong>vestment <strong>in</strong> PA generallyand <strong>in</strong> VRT (<strong>GRDC</strong>, 2006). For ABARE farm surveys <strong>the</strong> Australian gra<strong>in</strong>s <strong>in</strong>dustry istaken to comprise broadacre cropp<strong>in</strong>g and livestock graz<strong>in</strong>g farms. A farm is consideredto be a ‘specialist’ gra<strong>in</strong> farm if more than half <strong>of</strong> total cash receipts are received fromcrop sales. These farms (Table 7) average about 1,000 ha cropped so are a convenientstart<strong>in</strong>g po<strong>in</strong>t for this evaluation.Table 7: Characteristics <strong>of</strong> ‘Specialist’ Gra<strong>in</strong> Farms Potentially Benefit<strong>in</strong>g from SIP 09(ABARE, 2006)Number <strong>of</strong> bus<strong>in</strong>esses 13,293 Capital <strong>Investment</strong>/ha $1,430Area operated (ha) 2,056 Gra<strong>in</strong> sales (% total sales) 84Area cropped (ha) 991 Wheat sales (% total gra<strong>in</strong> sales) 57________________________________________________________________________________Agtrans Research Page 17
The number <strong>of</strong> specialist farms has changed little over <strong>the</strong> last two decades. The averagearea cropped and <strong>the</strong> total area has each <strong>in</strong>creased by about one half over that period.The area cropped on specialist farms is <strong>of</strong> <strong>the</strong> order <strong>of</strong> 13 m ha. The key figure requiredis <strong>the</strong> total gra<strong>in</strong> area potentially managed by VRT. The overall area sown to gra<strong>in</strong>s andoilseeds has been about 20 m ha recently and expected to expand to 24 m ha by 2011-12.(ABARE, 2006). Areas suitable for VRT have <strong>the</strong> follow<strong>in</strong>g characteristics:• Larger farms to justify <strong>the</strong> extra capital and expertise required,• Large paddock sizes (<strong>in</strong>herently more likely on larger farms), and• Variable yields and sufficient manageable variability <strong>in</strong> paddocks to justifydepart<strong>in</strong>g from fixed <strong>in</strong>put rates.SIP 09 had a focus <strong>in</strong> its projects on manag<strong>in</strong>g variability based on better understand<strong>in</strong>g<strong>of</strong> <strong>the</strong> spatial patterns <strong>in</strong> pr<strong>of</strong>itability. The diagnosis <strong>of</strong> <strong>the</strong> patterns has <strong>of</strong>ten beenproblematic. There are many possible causes relat<strong>in</strong>g to:• Previous farm<strong>in</strong>g operations, for example from mach<strong>in</strong>ery compaction,• Variable seasonal and spatial responses to <strong>in</strong>puts such as fertiliser, or• State <strong>of</strong> <strong>the</strong> natural resource, for example soil type, water hold<strong>in</strong>g capacity,topography and dra<strong>in</strong>age.Most VRT will be applied on larger specialist farms. Apart from that <strong>the</strong>re is noconsolidated data and only some observations to go on to determ<strong>in</strong>e areas potentiallysuitable for VRT. A figure <strong>of</strong> 6.5 m ha or 50 per cent <strong>of</strong> <strong>the</strong> area <strong>of</strong> specialist farms hasbeen suggested by two advisers <strong>in</strong>volved <strong>in</strong> SIP 09 as an achievable maximum level <strong>of</strong>adoption. The key assumptions for areas suitable for adoption <strong>of</strong> VRT are <strong>the</strong>reforeassumed to be as follows:• Most adoption will be on specialist gra<strong>in</strong> farms that have a total area <strong>of</strong> 13 m ha.• As adoption approaches 6.5 m ha (equivalent to 50% <strong>of</strong> <strong>the</strong> area cropped onspecialist gra<strong>in</strong> farms), <strong>the</strong> rate <strong>of</strong> adoption will be constra<strong>in</strong>ed by <strong>the</strong> limitedareas rema<strong>in</strong><strong>in</strong>g that are suitable for VRT.5.4. Factors <strong>in</strong>fluenc<strong>in</strong>g <strong>the</strong> rate <strong>of</strong> adoption <strong>of</strong> VRTThe rate at which Australian gra<strong>in</strong> farmers change <strong>the</strong>ir current fixed rate practices andadopt VRT will be determ<strong>in</strong>ed <strong>in</strong>itially by <strong>the</strong>ir awareness <strong>of</strong> <strong>the</strong> technology and <strong>the</strong>irperception <strong>of</strong> <strong>the</strong> benefits. There has been a rapid <strong>in</strong>crease <strong>in</strong> <strong>the</strong> proportion <strong>of</strong> farmerswith <strong>the</strong> basic equipment needed for VRT. Whelan (2007) quotes market penetration <strong>of</strong>30 per cent <strong>of</strong> <strong>the</strong> broadacre/row crop farmers with some form <strong>of</strong> guidance system and 40per cent <strong>of</strong> those with autosteer function. Therefore it can be assumed that <strong>the</strong> farmerslikely to adopt VRT will already have PA capability justified by benefits from variousforms <strong>of</strong> guidance and particularly from sav<strong>in</strong>gs <strong>in</strong> spray overlap.Awareness <strong>of</strong> VRT will be determ<strong>in</strong>ed primarily by <strong>the</strong> strategies <strong>of</strong> <strong>the</strong> agencies<strong>in</strong>volved <strong>in</strong> <strong>the</strong> promotion and servic<strong>in</strong>g <strong>of</strong> VRT and also from farmer contacts with<strong>in</strong><strong>the</strong>ir networks. VRT is assured <strong>of</strong> a high pr<strong>of</strong>ile <strong>in</strong> <strong>GRDC</strong> activities given that itsadoption will <strong>of</strong>ten be dependent on promotion and farmer adoption <strong>of</strong> more general PApractices. The <strong>GRDC</strong> Strategic Plan (<strong>GRDC</strong>, 2007a) has for its objective on adoption <strong>of</strong>practices:________________________________________________________________________________Agtrans Research Page 18
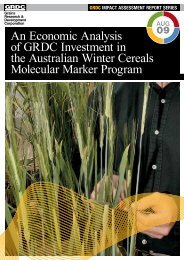
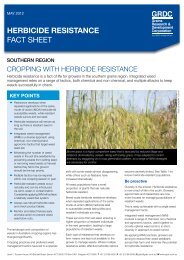
experience but generally a shorter period for paddock-scale VRT. The SIP 09 <strong>in</strong>volved anumber <strong>of</strong> farmers equivalent to about 2 per cent <strong>of</strong> <strong>the</strong> 13,000 specialist farmers who are<strong>the</strong> ma<strong>in</strong> target for VRT adoption. Based on <strong>the</strong>se <strong>in</strong>dications, <strong>the</strong> adoption <strong>of</strong> VRT isassumed to start <strong>in</strong> 2003 to co<strong>in</strong>cide with <strong>the</strong> start <strong>of</strong> <strong>the</strong> SIP 09 <strong>in</strong>vestment.Typical cumulative adoption curves are sigmoidal (a stretched S shape) with <strong>in</strong>itially lowrates as <strong>in</strong>novators trial new technology and <strong>the</strong>n with rates accelerat<strong>in</strong>g as more farmersbecome aware <strong>of</strong> <strong>the</strong> benefits. Rates ultimately decl<strong>in</strong>e as ceil<strong>in</strong>gs are reached or asalternative technology is <strong>in</strong>troduced. The follow<strong>in</strong>g figure for adoption <strong>of</strong> no-till is auseful analogy ( Note <strong>the</strong> data are annual rates and not cumulative). In Western Australiait took 14 years for cumulative adoption to reach 50 per cent <strong>of</strong> respondents. In SouthAustralia adoption was still less than 50 per cent after decades. Concerns on risks andbenefits <strong>in</strong> <strong>the</strong> farmers own situation were major factors determ<strong>in</strong><strong>in</strong>g <strong>the</strong> adoption rates.Figure 1: Stated Time <strong>of</strong> First Adoption <strong>of</strong> No-till by Gra<strong>in</strong> Growers <strong>in</strong> South Australiaand Western Australia (D’Emden and Llewellyn, 2004)In contrast to surveys and reports highlight<strong>in</strong>g <strong>the</strong> potential <strong>of</strong> VRT as an excit<strong>in</strong>g newtechnology, <strong>the</strong>re are reports that question benefits <strong>in</strong> particular environments. Forexample for <strong>the</strong> low and variable ra<strong>in</strong>fall environment <strong>of</strong> <strong>the</strong> Eyre Pen<strong>in</strong>sula:“While VRT sounds promis<strong>in</strong>g, <strong>the</strong> jury is still out <strong>in</strong> this environment. Reduced <strong>in</strong>puts<strong>in</strong> poor perform<strong>in</strong>g areas <strong>of</strong> paddocks may pay <strong>of</strong>f <strong>in</strong> seasons with a tight f<strong>in</strong>ish, buthow much yield would be compromised <strong>in</strong> a good season and how does this affectpr<strong>of</strong>itability over <strong>the</strong> long term?” (Hancock, 2007).In similar ve<strong>in</strong>, Ambrosio et al (2006) reported from a survey <strong>of</strong> Victoriangra<strong>in</strong>farmers that <strong>the</strong>y do not deem variability with<strong>in</strong> a paddock to be sufficientenough to warrant more precise treatment. These results are not unusual with newtechnology and simply demonstrate that farmers and <strong>the</strong>ir advisers reasonably assessnew research as risky until <strong>the</strong>y have better evidence <strong>of</strong> its applicability <strong>in</strong> <strong>the</strong>irenvironment. In Table 8, <strong>the</strong> key factors that contribute to adoption are listed toge<strong>the</strong>r________________________________________________________________________________Agtrans Research Page 20
significant benefit <strong>in</strong> relation to typical gross marg<strong>in</strong>s <strong>of</strong> from $100 to $200/ha. Fur<strong>the</strong>r,<strong>the</strong> benefit allows for a relatively m<strong>in</strong>or <strong>in</strong>itial capital cost <strong>of</strong> <strong>the</strong> order <strong>of</strong> $10/ha so <strong>the</strong>pay-back period will be short, even tak<strong>in</strong>g <strong>in</strong>to account that <strong>the</strong>re is a learn<strong>in</strong>g periodlikely before full benefit is reached. In any case SIP 09 has produced outputs that willmake it much easier for farmers to assess <strong>the</strong> likely benefits and to test without outlay<strong>in</strong>gsignificant resources.Estimates to 2017 <strong>of</strong> likely adoption rates and attribution to SIP 09 have been obta<strong>in</strong>edfrom <strong>the</strong> key researchers and advisers <strong>in</strong>volved (Table 9). As one researcher stated:“Farmers look<strong>in</strong>g to adopt PA <strong>in</strong> <strong>the</strong> future are better positioned to make VRT pay with<strong>in</strong>2-3 years because <strong>of</strong> access to lower cost equipment (yield monitor, VRT equipment) andmore <strong>in</strong>formation on <strong>the</strong> likely f<strong>in</strong>ancial returns”.Table 9: Cumulative Adoption (%) by Specialist Gra<strong>in</strong> Farmers <strong>of</strong> VRT, and Attributionto SIP 09 for ei<strong>the</strong>r Australia, or Specific <strong>GRDC</strong> Regions(estimated by 6 SIP 09 researchers and advisers)Year Australia Nor<strong>the</strong>rn SA WA AustralianAverage(estimated)Adoption (cumulative % <strong>of</strong> Specialist Gra<strong>in</strong> Farmers)2007 4 5 2 2 2 5 42017 50 50 60 20 40 15 40Attribution to SIP 09 (% <strong>of</strong> adoption achieved)2007 90 80 25 100 80 5 802017 90 80 75 85 60 30 70The next section considers <strong>in</strong> more detail <strong>the</strong> likely adoption rates to be achieved tak<strong>in</strong>g<strong>in</strong>to account possible constra<strong>in</strong>ts, particularly paddocks likely to be sufficiently variableto justify VRT. But first, <strong>the</strong> likely <strong>in</strong>fluence <strong>of</strong> a range <strong>of</strong> factors are summarised <strong>in</strong>Table 10.Table 10: Factors Driv<strong>in</strong>g Adoption Rates <strong>of</strong> VRTNegative Factors Reduc<strong>in</strong>gAdoption RatesConflict<strong>in</strong>g messages on likely benefitsand risks <strong>of</strong> VRT for key decisionssuch as fertiliser ratesPerceived complexity <strong>of</strong> <strong>the</strong> technology<strong>in</strong> terms <strong>of</strong> identify<strong>in</strong>g zones for VRTArea ceil<strong>in</strong>g because VRT limited tolarge paddocks with sufficientvariability to shift from uniformPossible Countervail<strong>in</strong>g FactorsIncreas<strong>in</strong>g availability <strong>of</strong> examples <strong>of</strong> benefits<strong>in</strong> standard applications, and <strong>of</strong> examples <strong>of</strong><strong>in</strong>novative uses <strong>of</strong> VRT approachesPA Manual published with tested guidel<strong>in</strong>esreduc<strong>in</strong>g dependence on farmer computer skillsLarger farms have higher average pr<strong>of</strong>itabilityand are more likely to already haveprerequisite technologies (guidance and auto-________________________________________________________________________________Agtrans Research Page 22
managementIn <strong>the</strong> short term, reduced capital<strong>in</strong>vestment follow<strong>in</strong>g drought will limit<strong>in</strong>vestment <strong>in</strong> VRTTime lag <strong>in</strong> gett<strong>in</strong>g operational and <strong>the</strong>limited numbers <strong>of</strong> technical andadvisory support to implement VRTSeasonal variability may dom<strong>in</strong>ate andcomplicate identification <strong>of</strong> zones<strong>in</strong>creas<strong>in</strong>g <strong>the</strong> time taken to set up andma<strong>in</strong>ta<strong>in</strong> <strong>in</strong>formation required tounderp<strong>in</strong> VRTEnvironmental benefits from reduc<strong>in</strong>gfertiliser and herbicide losses by us<strong>in</strong>gVRT undervalued by farmersRis<strong>in</strong>g cost <strong>of</strong> key <strong>in</strong>puts will result <strong>in</strong>an <strong>in</strong>crease <strong>in</strong> areas that are no longersusta<strong>in</strong>ablesteer)Short pay-back period for VRT; capital costsare likely to cont<strong>in</strong>ue to decl<strong>in</strong>e and newmach<strong>in</strong>ery has <strong>in</strong>herent PA capability or willbe readily adapted to VRTBasic PA technology is <strong>in</strong>creas<strong>in</strong>gly becom<strong>in</strong>gaccepted and is standard on new mach<strong>in</strong>ery;<strong>the</strong>re is <strong>in</strong>creas<strong>in</strong>g availability <strong>of</strong> advisers andmach<strong>in</strong>ery dealers with PA/VRT competenceLikely benefits <strong>of</strong> VRT can be assessedwithout major <strong>in</strong>vestmentIncreas<strong>in</strong>g <strong>in</strong>put costs and community concernswith <strong>of</strong>f-site impacts will <strong>in</strong>crease likelybenefits from VRT as a key component <strong>of</strong>Environmental Management SystemsVRT can identify parts <strong>of</strong> farms where landuse is not well matched with land capability5.5. Adoption rates <strong>of</strong> VRT with and without SIP 09Tak<strong>in</strong>g <strong>in</strong>to account <strong>the</strong> range <strong>of</strong> negative and <strong>in</strong> some cases <strong>of</strong>f-sett<strong>in</strong>g positive factorslikely to <strong>in</strong>fluence VRT adoption, a conservative approach is warranted assum<strong>in</strong>g aslower rate than that proposed by researchers and advisers <strong>in</strong> SIP 09 (Table 9). The ratewill also depend on fur<strong>the</strong>r expenditure by <strong>GRDC</strong> and o<strong>the</strong>r agencies and as discussedpreviously a cont<strong>in</strong>u<strong>in</strong>g <strong>in</strong>put is assumed to support VRT education and adoption. Therates <strong>in</strong> Table 11 assume a 22.5 per cent adoption by 2017 compared with 40 per cent <strong>in</strong>Table 9. Approaches developed by SIP 09 are likely to be superseded but provide <strong>the</strong>competitive base on which future benefits are evaluated.For <strong>the</strong> without SIP 09 situation, adoption was assumed to start from zero <strong>in</strong> 2003. By<strong>the</strong>n some farmers were <strong>in</strong>dependently triall<strong>in</strong>g VRT and some cont<strong>in</strong>u<strong>in</strong>g level <strong>of</strong>adoption would have been feasible without SIP 09. However <strong>the</strong> benefits achieved fromisolated cases <strong>of</strong> <strong>in</strong>novative farmers and advisers develop<strong>in</strong>g <strong>the</strong>ir own approaches wouldbe unlikely to be competitive with <strong>the</strong> more efficient approaches developed by SIP 09.Some limited research support for VRT would also have been available, mostly fromagencies that were <strong>in</strong>volved as partners <strong>in</strong> SIP 09 <strong>in</strong> any case. A one third reduction <strong>in</strong><strong>the</strong> benefits, from $6/ha for those farmers us<strong>in</strong>g a SIP 09 approach to $4/ha <strong>in</strong> <strong>the</strong> withoutsituation, is assumed. In <strong>the</strong> without situation, some acceleration <strong>in</strong> <strong>the</strong> rate <strong>of</strong> adoptionis likely as a critical mass <strong>of</strong> experience is built up. As <strong>the</strong> level is still low <strong>in</strong> relation to<strong>the</strong> ceil<strong>in</strong>g <strong>of</strong> about 50 per cent, a slow<strong>in</strong>g down is unlikely by 2032.________________________________________________________________________________Agtrans Research Page 23
With <strong>GRDC</strong> <strong>Investment</strong>Ongo<strong>in</strong>g <strong>in</strong>vestment <strong>in</strong>extension associated withPA<strong>An</strong>nual net benefit toadoptersNumber <strong>of</strong> years betweenadoption and full benefitAdoption2003/04 to 2004/052005/06 to 2006/072007/08 to 2016/172017/18 to 2026/2720027/28 to 2031/32$300,000 per annum for 2007/08 to2016/17Consultantestimate$6/haConsultantestimate based onfarmer survey2 years ConsultantAdoption pa (%) Cumulative (%)0.25 0.51.0 2.52.0 22.52.0 42.50.0 42.5estimateFrom Table 116. ResultsAll past costs and benefits were expressed <strong>in</strong> 2006/07 dollar terms us<strong>in</strong>g <strong>the</strong> CPI. Allbenefits after 2006/07 were expressed <strong>in</strong> 2006/07 dollar terms. All costs and benefitswere discounted to 2006/07 us<strong>in</strong>g a discount rate <strong>of</strong> 5%. The base scenario used <strong>the</strong> bestestimates <strong>of</strong> each variable, notwithstand<strong>in</strong>g a high level <strong>of</strong> uncerta<strong>in</strong>ty for many <strong>of</strong> <strong>the</strong>estimates. The benefit period was def<strong>in</strong>ed as <strong>the</strong> number <strong>of</strong> years after <strong>the</strong> last year <strong>of</strong>R&D <strong>in</strong>vestment.<strong>Investment</strong> criteria were estimated for both total <strong>in</strong>vestment and for <strong>the</strong> <strong>GRDC</strong><strong>in</strong>vestment alone. Each set <strong>of</strong> <strong>in</strong>vestment criteria were estimated for different periods <strong>of</strong>benefits. The <strong>in</strong>vestment criteria were all positive when <strong>the</strong> benefit period exceeded 10years as reported <strong>in</strong> Tables 13 and 14.Table 13: <strong>Investment</strong> Criteria for Total <strong>Investment</strong>(discount rate 5%)Criterion 0 years 5 years 10 years 15 years 20 years 25 yearsPresent value <strong>of</strong> 0.5 12.2 43.1 84.8 128.8 168.8benefits (m$)Present value <strong>of</strong> 18.3 18.3 18.3 18.3 18.3 18.3costs (m$)Net present value -17.8 -6.1 24.8 66.6 110.5 150.5(m$)Benefit cost ratio 0.03 0.66 2.4 4.6 7.0 9.2Internal rate <strong>of</strong>return (%)Negative Negative 15.7 20.4 21.9 22.4________________________________________________________________________________Agtrans Research Page 25
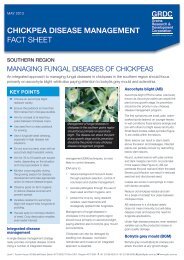
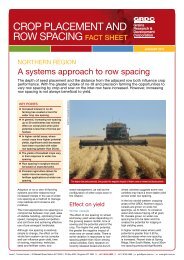
Table 14: <strong>Investment</strong> Criteria for <strong>GRDC</strong> <strong>Investment</strong>(discount rate 5%)Criterion 0 years 5 years 10 years 15 years 20 years 25 yearsPresent value <strong>of</strong> 0.2 4.6 16.2 31.9 48.4 63.4benefits (m$)Present value <strong>of</strong> 6.9 6.9 6.9 6.9 6.9 6.9costs (m$)Net present value -6.7 -2.3 9.3 25.0 41.5 56.5(m$)Benefit cost ratio 0.03 0.66 2.4 4.6 7.0 9.2Internal rate <strong>of</strong>return (%)Negative Negative 15.7 20.4 21.9 22.4Figure 2 demonstrates <strong>the</strong> rate at which net benefits accrue.Figure 2: <strong>An</strong>nual Net Benefit FlowSensitivity <strong>An</strong>alysesSensitivity analyses were carried out on two variables and results are reported <strong>in</strong> Tables15 and 16. Both sensitivity analyses were performed us<strong>in</strong>g a 5% discount rate withbenefits taken over <strong>the</strong> life <strong>of</strong> <strong>the</strong> <strong>in</strong>vestment plus 20 years from <strong>the</strong> year <strong>of</strong> last<strong>in</strong>vestment. All o<strong>the</strong>r parameters were held at <strong>the</strong>ir base values. Table 15 shows <strong>the</strong>sensitivity to <strong>the</strong> annual net benefit per hectare due to adoption <strong>of</strong> <strong>the</strong> technology. Theanalysis assumes that both <strong>the</strong> with and without values change. Table 16 shows <strong>the</strong>sensitivity to adoption. It should be noted that <strong>in</strong> <strong>the</strong> high adoption scenario, <strong>the</strong> adoptionceil<strong>in</strong>g <strong>of</strong> 50% <strong>of</strong> potential adopters is ma<strong>in</strong>ta<strong>in</strong>ed.________________________________________________________________________________Agtrans Research Page 26
Figure 3: Low, Expected and High Adoption7. ConclusionsThe cost benefit analysis demonstrates that <strong>in</strong>vestment <strong>in</strong> better adapt<strong>in</strong>g an emerg<strong>in</strong>gtechnology can be highly pr<strong>of</strong>itable where it has a major role <strong>in</strong> ensur<strong>in</strong>g wide spreadadoption across <strong>the</strong> gra<strong>in</strong>s <strong>in</strong>dustry. The tim<strong>in</strong>g <strong>of</strong> <strong>the</strong> <strong>in</strong>vestment was significant <strong>in</strong> that<strong>the</strong>re had been some early experience <strong>in</strong> PA by <strong>in</strong>novators and this helped clarify whatwere <strong>the</strong> key constra<strong>in</strong>ts to more widespread adoption.VRT is essentially manag<strong>in</strong>g variability with<strong>in</strong> paddocks by adjust<strong>in</strong>g major <strong>in</strong>puts suchas fertiliser to <strong>the</strong>ir optimum pr<strong>of</strong>it level. A syn<strong>the</strong>sis <strong>of</strong> previous yield maps, imageryand soils data can be used to def<strong>in</strong>e zones with<strong>in</strong> paddocks that warrant vary<strong>in</strong>g levels <strong>of</strong><strong>in</strong>puts.As is <strong>the</strong> case for much agricultural research, <strong>the</strong> benefits from a specific <strong>in</strong>vestment are<strong>of</strong>ten difficult to isolate. For this analysis, <strong>the</strong> only benefits quantified were for farmersadopt<strong>in</strong>g VRT. It should be remembered that gra<strong>in</strong> growers adopt<strong>in</strong>g a PA approach mayga<strong>in</strong> significant benefits <strong>in</strong> addition to those due only to use <strong>of</strong> VRT for fertilisers andpesticides.A key assumption was prior adaptation <strong>of</strong> PA capacity particularly as yield monitors andguidance capability have rapidly become standard. Farmers will <strong>in</strong>creas<strong>in</strong>gly have PA________________________________________________________________________________Agtrans Research Page 28
capacity as <strong>the</strong>y replace mach<strong>in</strong>ery. VRT can <strong>the</strong>n be readily adopted at a relativelym<strong>in</strong>or capital cost. Identify<strong>in</strong>g <strong>the</strong> potential to vary <strong>in</strong>puts on a paddock basis has nowbeen simplified by <strong>the</strong> experience and <strong>the</strong> tools developed as part <strong>of</strong> SIP 09.The benefits for VRT were based on conservative estimates <strong>of</strong> <strong>the</strong> <strong>in</strong>creased pr<strong>of</strong>its for asample <strong>of</strong> farms, and <strong>of</strong> <strong>the</strong> total area <strong>of</strong> <strong>the</strong> <strong>in</strong>dustry likely to benefit. The area suitablefor VRT is constra<strong>in</strong>ed to larger paddocks or where <strong>the</strong>re is a manageable level <strong>of</strong>variability. There are significant <strong>of</strong>f-site benefits likely from VRT through reduced<strong>in</strong>puts <strong>of</strong> herbicides and less fertiliser wastage. More generally SIP 09 will improve <strong>the</strong>capacity to better match land use and land capability. These environment benefits werenot quantified. Social benefits <strong>in</strong>clude reduced operator fatigue by be<strong>in</strong>g able toautomatically vary <strong>in</strong>puts.The estimates <strong>of</strong> benefits and <strong>the</strong> rate <strong>of</strong> adoption were conservative but were subject to asensitivity evaluation. The <strong>in</strong>vestment was still pr<strong>of</strong>itable for benefits reduced by onehalf and <strong>in</strong> a separate evaluation with <strong>the</strong> orig<strong>in</strong>al benefits ma<strong>in</strong>ta<strong>in</strong>ed but adoption rateshalved. For <strong>the</strong> low adoption scenario, <strong>the</strong> <strong>in</strong>vestment takes more than a decade beforebenefits exceed costs. This pattern is typical <strong>of</strong> <strong>in</strong>vestments where benefits grow slowlyas determ<strong>in</strong>ed by <strong>the</strong> cumulative levels <strong>of</strong> adoption achieved.The evaluation takes <strong>in</strong>to account <strong>the</strong> likely counterfactual situation <strong>in</strong> order to show <strong>the</strong>difference SIP 09 is expected to make. In <strong>the</strong> absence <strong>of</strong> a SIP 09 approach, a cont<strong>in</strong>u<strong>in</strong>glow but <strong>in</strong>creas<strong>in</strong>g level <strong>of</strong> adoption <strong>of</strong> VRT was assumed but with lower pr<strong>of</strong>itabilitythan achievable follow<strong>in</strong>g SIP 09. The assumption recognises that SIP 09 was designedas a well coord<strong>in</strong>ated national approach <strong>in</strong> contrast to <strong>the</strong> counterfactual characterised bya number <strong>of</strong> <strong>in</strong>efficient and <strong>in</strong>dependent small-scale efforts. SIP 09 was a catalyst able tosyn<strong>the</strong>sise what was be<strong>in</strong>g learnt <strong>in</strong> a range <strong>of</strong> regional applications and test and developgeneric approaches. The major output <strong>of</strong> SIP 09 was <strong>the</strong> recently launched PA Manual, aCD be<strong>in</strong>g widely promoted <strong>in</strong> <strong>the</strong> gra<strong>in</strong>s <strong>in</strong>dustry. The major outcome will cont<strong>in</strong>ue to be<strong>in</strong>creas<strong>in</strong>g areas <strong>of</strong> gra<strong>in</strong> managed for <strong>in</strong>creased pr<strong>of</strong>itability by VRT.8. ReferencesABARE (2006) http://www.abareconomics.com/<strong>in</strong>teractive/ausnz_ag/htm/au_crops.htmAmbrosio, C., L<strong>in</strong>ehan, C. and Ka<strong>in</strong>e, G. (2006) “Understand<strong>in</strong>g adoption <strong>of</strong> precisionagriculture technologies”. Proceed<strong>in</strong>gs <strong>of</strong> APEN International Conference 2006, 6-8March 2006 Beechworth, Victoria, Australia.Brennan, L., Robertson, M., Brown, S., Dalgliesh, N., and Keat<strong>in</strong>g, B. (2007).“<strong>Economic</strong> and Environmental Benefits / Risks <strong>of</strong> <strong>Precision</strong> Agriculture and MosaicFarm<strong>in</strong>g”. A report for <strong>the</strong> Rural Industries Research and Development Corporation,Canberra.Brownhill, D. (2006). “Us<strong>in</strong>g ‘Weedseeker’ spot spray<strong>in</strong>g technology <strong>in</strong> cropp<strong>in</strong>gsystems”. In: Proceed<strong>in</strong>gs <strong>of</strong> <strong>the</strong> 10th <strong>An</strong>nual Symposium on <strong>Precision</strong> Agriculture <strong>in</strong>Australasia, Sydney Australia.________________________________________________________________________________Agtrans Research Page 29
Webb, B., Blackwell P., Reithmuller, G.,and Lemon, J. (2004).”Traml<strong>in</strong>e Farm<strong>in</strong>gSystems”: Technical Manual, Department <strong>of</strong> Agriculture Western Australia.Whelan, B.M. (2007). “Current status and future directions <strong>of</strong> PA <strong>in</strong> Australia”.Proceed<strong>in</strong>gs <strong>of</strong> <strong>the</strong> 2nd Asian Conference on <strong>Precision</strong> Agriculture, Pyeongtaek, Korea,pp 60-71.Wylie, P, (2001). “Assessment <strong>of</strong> <strong>the</strong> Potential Benefits <strong>of</strong> <strong>Precision</strong> Agriculture <strong>in</strong>Australia”. <strong>GRDC</strong> Canberra.9. AcknowledgmentsValuable assistance is acknowledged from <strong>the</strong> program coord<strong>in</strong>ator, Dr Phil Price, and by<strong>the</strong> researchers and advisers around Australia who have been part <strong>of</strong> SIP 09 or <strong>in</strong>volvedgenerally <strong>in</strong> <strong>the</strong> development <strong>of</strong> <strong>Precision</strong> Agriculture.________________________________________________________________________________Agtrans Research Page 31