SOUTH CAROLINA GEOLOGY - Carolina Geological Society
SOUTH CAROLINA GEOLOGY - Carolina Geological Society
SOUTH CAROLINA GEOLOGY - Carolina Geological Society

Create successful ePaper yourself
Turn your PDF publications into a flip-book with our unique Google optimized e-Paper software.
<strong>SOUTH</strong> <strong>CAROLINA</strong><br />
<strong>GEOLOGY</strong><br />
Volume 43 S.C. DEPARTMENT OF NATURAL RESOURCES 2001
Geology of the Inner Piedmont in the Caesars Head and Table Rock<br />
state parks area, northwestern South <strong>Carolina</strong><br />
SPECIAL ISSUE<br />
Devoted to the 2001 Field Trip<br />
of the <strong>Carolina</strong> <strong>Geological</strong> <strong>Society</strong>
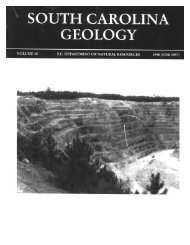
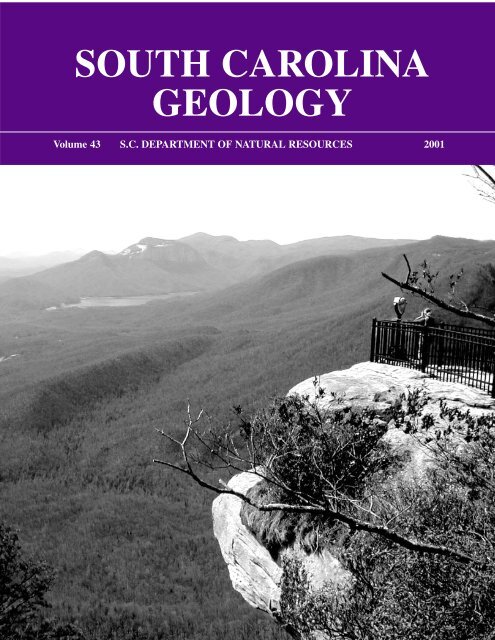
COVER PHOTOGRAPH: View to the southwest across the Piedmont from Caesars Head (3000<br />
ft elevation) toward the Table Rock exfoliation dome. Table Rock Reservoir, built in 1925, serves<br />
as part of water supply for Greenville, South <strong>Carolina</strong>. Reservoir capacity is 9,522,000,000 gallons.<br />
Photograph by Jack Garihan<br />
ii
Board Members<br />
<strong>CAROLINA</strong> GEOLOGICAL SOCIETY<br />
2001 Officers<br />
President Kevin Stewart<br />
Vice-President Neil Gilbert<br />
Secretary-Treasurer Duncan Heron<br />
iii
DEDICATION<br />
ACKNOWLEDGEMENTS<br />
iv
<strong>SOUTH</strong> <strong>CAROLINA</strong> <strong>GEOLOGY</strong><br />
VOLUME 43 2001<br />
JOHN M. GARIHAN, WILLIAM A. RANSON and C. W. CLENDENIN,<br />
Volume Editors<br />
PART I:<br />
PAPERS RELATED TO THE THEME OF THE 2001 <strong>CAROLINA</strong><br />
GEOLOGICAL SOCIETY ANNUAL MEETING:<br />
Geology of the Inner Piedmont in the Caesars Head and Table Rock state parks<br />
area, northwestern South <strong>Carolina</strong><br />
The Cliffs at Glassy<br />
v
PART II:<br />
FIELD TRIP GUIDE<br />
JOHN M. GARIHAN and WILLIAM A. RANSON,<br />
Field Trip Leaders<br />
PART III:<br />
WORKSHOP<br />
BRANNON ANDERSEN, KENNETH SARGENT and DAVID HARGETT,<br />
Workshop Leaders<br />
vi
South <strong>Carolina</strong> Geology, 2001, v. 43, p. 1 – 13.<br />
OBSERVATIONS OF THE SENECA FAULT AND THEIR IMPLICATIONS FOR<br />
THRUST SHEET EMPLACEMENT IN THE INNER PIEDMONT OF THE<br />
<strong>CAROLINA</strong>S<br />
JOHN M. GARIHAN, Department of Earth and Environmental Sciences, Furman University,<br />
Greenville, South <strong>Carolina</strong> 29613<br />
ABSTRACT<br />
Map relationships show that the Seneca and Sugarloaf Mountain thrusts, previously believed to be separate entities in<br />
the Inner Piedmont of the <strong>Carolina</strong>s, are the same Paleozoic thrust. This thrust, referred to here as the Seneca fault, bounds<br />
the Six Mile thrust sheet. An integration of existing map information, regional compilations and new mapping is used to<br />
trace the Seneca fault from near Seneca, South <strong>Carolina</strong>, across the Inner Piedmont to Marion, North <strong>Carolina</strong>. Other map<br />
relationships show that the Seneca fault was folded following its emplacement. The polyphase folding has produced the<br />
complex outcrop patterns and numerous klippen of the Six Mile sheet mapped along the Blue Ridge Front. The Seneca<br />
fault also is offset by younger Paleozoic thrust faults and Mesozoic oblique-slip, brittle faults. Recognition of subsequent,<br />
overprinting deformation allows re-evaluation of the sequence of Inner Piedmont thrusting. This re-evaluation indicates<br />
that early thrust propagation was in-sequence or foreland-younging to the northwest.<br />
INTRODUCTION<br />
Exceptional rock exposures occur in the <strong>Carolina</strong>s along<br />
the balds of the Blue Ridge Front (~3000 ft. elevation). These<br />
exposures are the result of a complex interplay between<br />
Cenozoic tectonic activity and erosion (Citron and Brown,<br />
1979; Hack, 1982; Gable and Hatton, 1983; Clark, 1993;<br />
Clark and Knapp, 2000). Along the Blue Ridge Front,<br />
topography is locally structurally controlled (Garihan and<br />
others, 1997). Steep, linear valleys (up to 2000 feet relief)<br />
are controlled by northeast-trending joints and Mesozoic<br />
brittle faults. Stream incision, however, is “stalled” on<br />
resistant footwall gneisses below the trace of a Paleozoic<br />
thrust. This shallow-dipping thrust is referred to here as the<br />
Seneca fault (Figures 1 and 2).<br />
The Seneca fault lies at the base of the Six Mile thrust<br />
sheet and separates kyanite-grade rocks of the Chauga-<br />
Walhalla thrust sheet from the overlying, higher-grade,<br />
sillimanite-muscovite grade rocks of the Six Mile sheet<br />
(Griffin, 1974, 1977, 1978; Nelson and others, 1987, 1998).<br />
Horton and McConnell (1991) considered the Seneca fault<br />
as their “best mapped” and “best documented” Inner<br />
Piedmont (IP) thrust within the thrust stack of the Greenville<br />
1°x2° quadrangle. Since the Seneca fault is the basal thrust<br />
of the Six Mile thrust sheet, it is a major component of the<br />
regional structural framework of the IP. Hatcher and Hooper<br />
(1992) considered the Six Mile sheet to be a type “C” sheet;<br />
and based on this interpretation, the Seneca fault was<br />
considered to be out-of-sequence and possibly equivalent to<br />
the Toccoa – Shorts Mill thrust at the base of the Alto<br />
Allochthon (Hopson and Hatcher, 1988).<br />
The purpose of this paper is to place the Seneca fault in<br />
a regional context and to document new observations of<br />
mesoscopic features in three exposures of the Seneca fault<br />
in the vicinity of Camp Greenville, South <strong>Carolina</strong>.<br />
1<br />
Integration of the regional relationships and the new<br />
observations is the basis for a re-evaluation of the sequence<br />
of Paleozoic thrusting in the IP.<br />
INNER PIEDMONT RELATIONSHIPS AND THE<br />
SUGARLOAF MOUNTAIN THRUST<br />
The 1993 <strong>Carolina</strong> <strong>Geological</strong> <strong>Society</strong> Annual Field<br />
Trip Guidebook is an excellent reference to the geologic<br />
framework of the rugged portion of the IP southeast of the<br />
Brevard fault zone known as the Columbus Promontory. A<br />
regional lithostratigraphy and a regional thrust stack<br />
sequence (Figure 3) have been proposed for the Columbus<br />
Promontory (Hatcher, 1993; Davis, 1993).<br />
The Sugarloaf Mountain thrust was first described by<br />
Lemmon (1973) and Lemmon and Dunn (1973) as a sharp<br />
fault contact between Inner Piedmont rocks in an unnamed<br />
thrust sheet and underlying Henderson Gneiss. Davis (1993)<br />
correlated those Inner Piedmont rocks with the Poor<br />
Mountain Formation and the upper Mill Spring complex<br />
(equivalent to the Tallulah Falls Formation of Hatcher,<br />
1999a) and referred to the basal fault as the Sugarloaf<br />
Mountain thrust. In the area of Hendersonville, North<br />
<strong>Carolina</strong>, Lemmon (1982) envisioned Sugarloaf Mountain<br />
thrusting during Acadian D 2 deformation, which post-dated<br />
earlier D 1 isoclinal folding, amphibolite grade<br />
metamorphism (M 1 ) and dominant S 1 foliation<br />
development. Lemmon’s D 2 also involved progressive<br />
metamorphism (M 2) , a second isoclinal folding event (F 2 )<br />
nearly coaxial and coplanar to F 1, NE-SE-oriented<br />
subhorizontal rodding of augen in Henderson Gneiss, S 2<br />
foliation development, and Sugarloaf Mountain thrusting<br />
that truncates S 1 .<br />
In the Columbus Promontory, the Tumblebug Creek
2<br />
Figure 1. Generalized geologic and tectonic map of the Inner Piedmont between Zirconia, North <strong>Carolina</strong> and Table Rock, South <strong>Carolina</strong> area. Inset map shows the location of the study<br />
area in the southern Appalachians.
3<br />
Figure 2. Sections across the Blue Ridge Front, showing the folded configuration of the Seneca thrust (S) and the effects of Mesozoic brittle faults. Locations of cross-sections are shown on Figure 1.<br />
Disignations of rock unit are the same as for Figure 1. Short, wavy lines are apparent dips of foliation, projected into the sections.
thrust underlies the Sugarloaf Mountain fault (Figure 3) and<br />
crops out in a foreland position. Davis (1993) described the<br />
Tumblebug Creek thrust and overlying Henderson gneiss<br />
as folded together and transposed in the S 2 direction,<br />
whereas the Sugarloaf Mountain thrust truncated the<br />
Henderson gneiss and the rocks above that thrust are parallel<br />
to S 2 . Based on those observations, the thrust ordering was<br />
suggested to be out-of-sequence.<br />
Geologic map compilations, for example those of<br />
Nelson and others (1998), Hatcher (1999b) and Bream and<br />
others (1999), provide regional information regarding the<br />
continuity of IP features. The compilations show that, to<br />
the southwest, rocks of the Poor Mountain Formation and<br />
the Tallulah Falls Formation (e.g. the Upper Mill Spring<br />
complex) are in the Six Mile sheet, and the Henderson<br />
Gneiss lies in the Chauga-Walhalla sheet. As previously<br />
mentioned, the thrust that separates those IP thrust sheets is<br />
the Seneca fault. Throughout the South <strong>Carolina</strong> Inner<br />
Piedmont, the Seneca fault is mapped at a sharp contact at<br />
LOWER MILL SPRING COMPLEX<br />
(LOWER TALLULAH FALLS FM.)<br />
MILL SPRING THRUST<br />
SUGARLOAF MOUNTAIN THRUST<br />
TUMBLEBUG CREEK THRUST<br />
BREVARD FAULT<br />
Figure 3. Regional lithostratigraphy and thrust sheet stack<br />
sequence for the Columbus Promontory area, North <strong>Carolina</strong><br />
(modified after Davis, 1993).<br />
4<br />
Figure 4. Generalized geologic map of part of the Standingstone Mountain<br />
quadrangle, North <strong>Carolina</strong> and South <strong>Carolina</strong>. Locations of Mulligan’s<br />
View and Camp Greenville are shown. State line is at the top of the Blue<br />
Ridge Front. Index to quadrangles in the study area.<br />
the top of a zone of extreme grain-size reduction in the<br />
underlying Walhalla sheet rocks; overlying Six Mile sheet<br />
rocks do not show this type of deformation. Davis (1993)<br />
offered a similar description of the Sugarloaf Mountain<br />
thrust in the Columbus Promontory. These observations<br />
suggest that the Seneca fault and the Sugarloaf Mountain<br />
thrust are the same thrust.<br />
Over the past six years, I have conducted geologic<br />
mapping, with the assistance of colleagues from Furman<br />
University, in parts of six Inner Piedmont 7.5-minute<br />
quadrangles (Figure 4). These quadrangles are located<br />
immediately to the west-southwest of the North <strong>Carolina</strong><br />
Columbus Promontory, and mapping has focused<br />
principally on the structural details and geometric<br />
configuration of the Seneca fault. Edge-matching of<br />
1:24,000 map information from near Seneca, South <strong>Carolina</strong><br />
(Griffin, 1974, 1977, 1978) across Pickens and northern
5<br />
Figure 5. A) Exposure at Mulligans View. B) Fenced exposure at Camp Greenville.
Figure 6. Block diagram of exposures of the Seneca fault at Camp<br />
Greenville. am – Poor Mountain Formation amphibolite, with minor schist.<br />
gn – Table Rock Suite gneiss.<br />
Greenville counties, South <strong>Carolina</strong>, and Transylvania and<br />
Henderson counties, North <strong>Carolina</strong> (Garihan, 1999a), to<br />
the vicinity of the towns of Hendersonville and Marion,<br />
North <strong>Carolina</strong> (Bream, 1999) shows that the Seneca fault<br />
can be traced into the Columbus Promontory at the base of<br />
Six Mile sheet. Those field relationships verify that the<br />
Sugarloaf Mountain thrust and the Seneca fault are the same<br />
thrust (Figure 1), and I propose that the name Seneca fault<br />
be used to identify this IP thrust.<br />
OBSERVATIONS IN THE STANDINGSTONE<br />
MOUNTAIN QUADRANGLE<br />
Across the six quadrangles studied in the vicinity of<br />
the Columbus Promontory, the Seneca fault was traced by<br />
mapping Six Mile sheet klippen northeastward across the<br />
top of the Blue Ridge Front into the adjoining<br />
Hendersonville quadrangle (Figure 1). In the study area,<br />
the Six Mile sheet has been folded along north-south- and<br />
east-west- to northwest-trending axial surfaces (Garihan and<br />
Ranson, 1999; Garihan, 1999a). Mapping shows that northsouth<br />
and east-west corridors of Walhalla sheet biotite<br />
quartzo-feldspathic gneiss (Table Rock Suite) and biotite<br />
augen gneiss (Henderson Gneiss?) define antiformal warps<br />
of the Seneca fault surface. An example is the Huckleberry<br />
Ridge antiform (Figure 1). These macroscopic folds are part<br />
of a regional dome and basin interference pattern (Garihan,<br />
1999b; Howard and others, 2001; MacLean and Blackwell,<br />
this volume) and may be related to post-metamorphic fold<br />
phases recognized by Hatcher and Butler (1979), Lemmon<br />
(1982), Hopson and Hatcher (1988), and Nelson and others<br />
(1998). Hill and others (1998) show that other continuous,<br />
low-angle thrusts, which can be traced into North <strong>Carolina</strong>,<br />
also are folded.<br />
Within the southwestern part of the Standingstone<br />
Mountain quadrangle (Figure 4), the Six Mile sheet is<br />
deformed by northwest-vergent, overturned folds, with<br />
wavelengths of ~1 kilometer. A combination of rugged<br />
topography (several thousand feet of relief) and a polyphasefolded<br />
Six Mile sheet has produced large klippen in the<br />
Standingstone Mountain quadrangle. Several northwesttrending<br />
windows through one klippe occur at culmination<br />
positions of the folded Seneca fault surface.<br />
6<br />
EXPOSURES ALONG SOLOMON JONES ROAD<br />
To the north-northeast of Caesars Head, small Six Mile<br />
sheet klippen crop out at the top of the Blue Ridge Front<br />
along Solomon Jones Road leading to Camp Greenville.<br />
Along this road, parts of these klippen and the Seneca fault<br />
are exposed in roadcuts and borrow pits at approximately<br />
the same elevation. These man-made exposures allow<br />
detailed observations of deformation that has overprinted<br />
the Seneca fault. Three localities will be described:<br />
Mulligan’s View, the fenced exposure, and the Camp<br />
Greenville roadcut along Solomon Jones Road.<br />
Mulligan’s View exposure<br />
About 1 mile (1.6 km) west of Camp Greenville along<br />
Solomon Jones Road, a cut at Mulligan’s View exposes an<br />
edge of a Six Mile sheet klippe near the top of the Front<br />
(Figure 5A). This cut is approximately 150 feet long and<br />
provides a northwest view of the geologic relationships. A<br />
second exposure, a small borrow pit located immediately<br />
to the west along Solomon Jones Road, shows the same<br />
rock units and similar structural relationships. A line<br />
drawing based on a photocomposite of the exposure is<br />
shown in Figure 5A.<br />
Two rock units are exposed at Mulligan’s View: Six<br />
Mile sheet Poor Mountain Formation (PMF) and Walhalla<br />
sheet Table Rock Plutonic Suite gneiss. Poor Mountain rocks<br />
are dominantly fine- to medium-crystalline, well layered<br />
and well foliated amphibolite, with minor interlayered<br />
schist. Amphibolite with garnet metaquartzite is exposed<br />
uphill, and the amphibolite - metaquartzite association<br />
verifies the rocks are part of the PMF. Soft, saprolitic, gray<br />
Table Rock Plutonic Suite biotite quartzo-feldspathic gneiss<br />
(TRS gneiss) is leucocratic, fine-crystalline, and well<br />
foliated. TRS gneiss also contains several contorted,<br />
discontinuous, irregular masses and layers of schist (feature<br />
A, Figure 5A). Small bodies of pegmatite are adjacent and<br />
subparallel to faults.<br />
Tight to isoclinal, overturned, northwest- to southwestvergent<br />
folds are recognized in the exposure. These folds<br />
are well defined by foliation in the TRS gneiss and<br />
subordinate schistose layers and by the sharp contacts<br />
between PMF amphibolite and TRS gneiss. The mean<br />
attitude of hinges (n = 11) of the tight-isoclinal folds is 14°/<br />
N43°E, and hinges are reasonably consistent in orientation.<br />
The axial surfaces of these northeast-plunging folds dip<br />
gently into the cut, and several axial surfaces can be traced<br />
tens of feet laterally across the exposure. The axial surfaces<br />
of those northeast-plunging folds are re-folded by a younger,<br />
upright fold set (Figure 5A).<br />
Two conspicuous amphibolite bodies are visible in the<br />
exposure; these bodies are referred to as the dark amphibolite<br />
and the layered amphibolite (respectively, B and C,<br />
Figure 5A). The dark amphibolite is approximately 4 ft (1.2<br />
m) wide and runs diagonally up across the center of the cut.<br />
Mesoscopic folding deforms the contacts of the dark<br />
amphibolite and the TRS gneiss. Close inspection shows
Figure 7. Diagrammatic scheme for duplex development along the Seneca<br />
fault in the fenced exposure at Camp Greenville. Dotted line is Seneca<br />
fault.<br />
that deformational foliation of the dark amphibolite is truncated<br />
by these sharp contacts in several places along the<br />
sharp margin, which suggests that the sharp contacts are<br />
the result of shear. A few centimenter-scale, west-vergent,<br />
overturned folds also can be seen in the dark amphibolite at<br />
D. Such folds plunge gently toward N25°W and predate<br />
the prominent N43°E-plunging folds of the exposure.<br />
Three, thin (~5 cm), discontinuous layers of amphibolite<br />
are present within the TRS gneiss near the sharp contact<br />
with the dark amphibolite body at the base of the exposure<br />
(N, Figure 5A). A small rootless isoclinal fold is visible in<br />
one of these amphibolite layers. The rootless nature of the<br />
fold suggests that a phase of folding occurred prior to<br />
development of the N43°E-plunging fold set.<br />
Beneath a shallow-dipping (~15° NW) panel of dark, welllayered,<br />
jointed, and slabby amphibolite with minor schist,<br />
the Seneca fault defines the sharp contact with juxtaposed<br />
TRS gneiss (E, Figure 5A). Locally, a layer of soft, altered<br />
amphibolite up to 6 inches (15 cm) thick lies directly above<br />
the planar fault contact (oriented N80°E, 15°NW).<br />
Deformational foliation in both the amphibolite and TRS<br />
gneiss is essentially parallel at E.<br />
7<br />
Three north-dipping (15°-20°) thrust faults have offset<br />
the Seneca fault (F, G, and H, Figure 5A). The thrust at F<br />
juxtaposes pegmatite westward up and over Poor Mountain<br />
Formation amphibolite, which is tightly folded into a<br />
synform beneath the thrust. The thrust at G cuts amphibolite<br />
layering at a shallow angle and has emplaced a wedge of<br />
TRS gneiss over amphibolite. This thrust duplicates the<br />
Seneca fault, as well as a thickness of PMF. At the top of<br />
the exposure, the thrust at G is parallel to metamorphic<br />
layering, in a manner similar to hidden “bedding plane”<br />
thrusts affecting sedimentary rock sequences (Cloos, 1964).<br />
The thrust at H marked locally by pegmatite juxtaposes a<br />
tight, overturned antiform of TRS gneiss above another<br />
overturned antiform of TRS gneiss (J). The intervening<br />
synform is presumed to have been removed by faulting.<br />
Upward, in the hanging wall of the thrust at H, the Seneca<br />
fault is antiformally folded and overturned about a northeastplunging<br />
fold hinge (K).<br />
An overview of the southwest end of the Mulligan’s<br />
View exposure shows that a fault, similar to the faults found<br />
at F, G, and H, is subparallel to a crenulated phyllonite layer<br />
(L, Figure 5 A) and projects below the level of the exposure.<br />
This fault may be one of a set of younger of faults seen in<br />
this exposure. Fault-related antiformal folds have developed<br />
in PMF amphibolite (M) and amphibolite-gneiss (K)<br />
following emplacement of the Seneca fault. These folds may<br />
be either force folds or drag folds along the younger faults.<br />
Fenced exposure at Camp Greenville<br />
A second set of exposures occurs 0.6 mi (~1 km) east<br />
of Mulligan’s View in Camp Greenville (Figure 5B). These<br />
exposures are along Solomon Jones Road just below the<br />
Camp dining hall. The largest of the exposures is behind a<br />
fenced area (Figure 6) and currently is protected from further<br />
removal of material because it is utilized in the Camp’s<br />
educational programs to illustrate the natural history of the<br />
Southern Appalachians. The second exposure is a small road<br />
cut immediately to the west. The rock units in the exposures<br />
are partly altered and soft as a result of intense weathering<br />
generally developed near the top of the Blue Ridge<br />
escarpment (~3000 ft. elevation). Structural relationships<br />
are more discernible after thunderstorms have washed down<br />
the exposure.<br />
Similar to Mulligan’s View, these man-made cuts below<br />
the dining hall expose an edge of another klippe of the Six<br />
Mile thrust sheet. The fenced exposure offers a view to the<br />
north-northwest; the adjacent roadcut offers a view to the<br />
north. Integration of observations from both exposures<br />
provide a three dimensional perspective of the geology<br />
(Figure 6). The roadcut is described in a following section.<br />
A line drawing of the fenced exposure is shown in Figure<br />
5B. The Seneca fault (A) is mapped at the top of the<br />
uniformly layered gneiss, and it conspicuously divides the<br />
exposure into footwall and hanging wall segments. Other<br />
features are separately lettered.<br />
In the footwall, gray TRS gneiss shows dramatic grain
size reduction and uniform mylonitic layering. Davis (1993)<br />
recognized similar grain size reduction in Henderson Gneiss<br />
beneath the Seneca fault in the Columbus Promontory. A<br />
1-2 inch-thick layer (B) of leucocratic, saccaroidal gneiss<br />
lies just below the Seneca fault. Foliation attitudes in the<br />
footwall TRS gneiss are N40°W, 20 NE.<br />
The Seneca fault surface parallels the foliation attitude<br />
of the footwall TRS gneiss. However, the trace of the fault<br />
rolls in strike and gently steepens left to right across the<br />
exposure from N27°W, 20°NE to N70°W, 30°NE. A layer<br />
of schist lies directly above the fault contact and is generally<br />
less than 1 ft (
constrained. The post-Seneca thrusts cannot be traced away<br />
from the Mulligan’s View exposure with any certainty.<br />
Nonetheless, these younger thrusts likely affect the<br />
distribution of PMF rocks along the margin of the Six Mile<br />
thrust sheet (Garihan, 1999a; Figure 1). Mapping the trace<br />
of the Seneca fault as unbroken lines, for example in the<br />
Slater (Garihan and others, 2000) and Cleveland quadrangles<br />
(Garihan, 2000), probably oversimplifies faulting<br />
complexity. Thrust offsets of the Seneca fault go<br />
unrecognized, but certainly they are present.<br />
Camp Greenville fenced exposure<br />
In this exposure, the Seneca fault is mapped at a sharp<br />
contact which is subparallel to the layered foliation in the<br />
underlying footwall TRS gneiss (Figure 5B). A layer of<br />
schist marks the fault contact. The previously described<br />
duplex lies directly above the schist layer in the upper half<br />
of the exposure.<br />
An overview of the exposure shows that the fault contact<br />
steepens from 5 o to 25 o over a short distance. This change<br />
in dip is interpreted to define the location of a thrust ramp.<br />
Regional cross sections show that the Seneca fault dips<br />
southward at ~5° (Figure 2), with ramps along the thrust<br />
dipping 10°-20° (Garihan, 1999a, 1999b). If these<br />
relationships are representative, the duplex formed at the<br />
ramp during progressive deformation of the Seneca fault.<br />
Duplex development at this ramp is shown diagrammatically<br />
in Figure 7. Three horse blocks were cut from the ramp<br />
during progressive footwall failure. Thrusting of the<br />
underlying horse block unfolded the older, overlying horse<br />
(See Mitra, 1986); unfolding is defined by the gentle curve<br />
of the front of the overlying horse block. Footwall failure<br />
at the ramp explains how the Seneca fault contact (dotted<br />
line, Figure 7D), separating slivers of footwall TRS gneiss<br />
and hanging wall Poor Mountain Formation amphibolite,<br />
was incorporated into the duplex stack. Footwall failure also<br />
implies that this phase of thrusting was exploiting the Seneca<br />
fault surface (Figure 7E).<br />
Thickening or “wadding up” of the schist layer along<br />
the Seneca fault surface occurred below a larger duplex ( J,<br />
Figure 5B; Figure 7F). “Wadding up” of the schist is the<br />
result of subsequent antiformal duplexing, and this younger<br />
duplex stack deforms the overlying duplex. In a study of<br />
mesoscopic thrust ramps, Serra (1977) recognized that<br />
mechanically weak materials accumulated where the fault<br />
surface steepened at a ramp; accumulation and thickening<br />
of weak material was attributed to cataclastic flow.<br />
Progressive footwall failure at the ramp stacked thin horse<br />
blocks of the schist upward and formed the antiformal<br />
duplex.<br />
The structural style of these two duplexes is different.<br />
The larger, overlying duplex is asymmetric and appears<br />
flattened, whereas the underlying, schist antiformal duplex<br />
is symmetric. These differences suggest that the overlying<br />
duplex may have formed under a component of general<br />
shear (flattening and simple shear). The general shear also<br />
9<br />
may have initiated cataclastic flow in the schist layer toward<br />
the ramp during progressive footwall failure. If this is true,<br />
the differences in structural style of the two duplexes<br />
(asymmetric verses symmetric) may indicate that they<br />
formed at different times.<br />
STRUCTURAL CHRONOLOGY<br />
Polyphase deformation of the Seneca fault is recognized<br />
repeatedly in the three exposures along Solomon Jones<br />
Road. As a result, a chronology of IP structural events,<br />
described here as stages, can be pieced together from map<br />
and mesoscopic information. No attempt is made to assign<br />
these deformational stages to either early Paleozoic<br />
(Taconian) or middle Paleozoic (Acadian) orogenic activity.<br />
This chronology is not inclusive and begins with the<br />
emplacement of the Six Mile thrust sheet.<br />
1) Stage Ia: Emplacement of Six Mile thrust sheet.<br />
The Seneca fault is interpreted to have formed as a tectonic<br />
slide conformable with the overturned limb of the Six Mile<br />
fold-thrust nappe, which formed during a major orogenic<br />
event (Griffin, 1971a, 1978). Hinterland to foreland<br />
translation of the nappe resulted in simple shear; associated<br />
deformation produced inclined and recumbent buckle folds,<br />
localized ductile strain, and transposition of layers. Strain<br />
would have been particularly intense at the base of the nappe<br />
(Ramsay and others, 1983); as shearing narrowed, the<br />
Seneca fault formed. Ductile deformation along this<br />
developing thrust resulted in the removal of the intervening<br />
synform as the Six Mile nappe was emplaced over the<br />
Walhalla nappe in an “antiform on antiform” fashion. Grain<br />
size reduction and mylonitization in the footwall TRS gneiss<br />
marks the ductile deformation (transposition) zone that<br />
removed the intervening synform during slide development<br />
(See Howard, this volume).<br />
2) Stage Ib: Late stage development of duplex stack.<br />
Continued, post-collisional deformation narrowed the broad<br />
zone of shearing to form distinct thrust faults (Ramsey and<br />
others, 1983). The sharp, subhorizontal contact at the top<br />
of the zone of extreme grain-size reduction in footwall<br />
Walhalla nappe, which is mapped as the Seneca fault, may<br />
have formed during this stage. Such thrusting also is<br />
interpreted to have developed the duplex at the Camp<br />
Greenville fenced exposure. Observations of that exposure<br />
show duplex development was in-sequence and developed<br />
at a local ramp in the Seneca fault.<br />
3) Stage II: First Post-Seneca fold phase. Following<br />
the emplacement of the Six Mile nappe, the Seneca fault<br />
was overprinted by a fold phase that produced tight,<br />
northwest-vergent, overturned folds. Based on descriptions<br />
of Davis (1993), the Tumblebug Creek fault is deformed by<br />
similar folds. The northwest-vergent folding of both the<br />
Tumblebug Creek and the Seneca faults is interpreted to be<br />
related to this Stage II fold phase, which also sheared the<br />
rocks of the Walhalla and Six Mile nappes into the regional<br />
S 2 foliation direction (Davis, 1993). Observations by<br />
Warlick and others (this volume) of a northwest-vergent
fold in the Seneca fault in The Cliffs at Glassy are considered<br />
supportive evidence for this interpretation. If these<br />
correlations are true, previous suggestions that thrust sheet<br />
emplacement in the IP was out-of- sequence are suspect.<br />
4) Stage III: Additional post-Seneca fold phases.<br />
Based on regional macroscopic patterns, upright to inclined<br />
folds with northerly, northwesterly, and westerly trends were<br />
superimposed on Stage II fold directions (Figures 1, 2, 4, 5<br />
and 6). Stage III deformation also is observable on the<br />
mesoscopic scale in the Solomon Jones roadcut exposure,<br />
where a northwest-vergent fold is re-folded into the westdipping<br />
limb of a small, upright synform. Superimposed<br />
folds within the Six Mile thrust sheet also are recognized<br />
by MacLean and Blackwell (this volume) in Taylors<br />
quadrangle.<br />
5) Stage IV: Post-Seneca thrusting. A younger set of<br />
thrusts developed following Stage Ib faulting. At the<br />
Mulligan’s View exposure, all pre-existing deformational<br />
foliations, thrusts, and folds are offset by these younger<br />
thrusts (Figure 5A). The tight, inclined fault folds associated<br />
with this thrust phase could be confused with older Stage II<br />
folds if the thrusts were not recognized in the exposure.<br />
The small antiformal duplex in schist at the Camp Greenville<br />
fenced exposure may have developed during Stage Ib or<br />
Stage IV.<br />
Mapping of Warlick and others (this volume) on Glassy<br />
Mountain shows that post-Seneca thrusting offsets units in<br />
the Six Mile thrust sheet. Stage IV folds associated with<br />
that thrusting are similar to those seen at Mulligans View –<br />
northwest-vergent, tight, inclined folds (C. W. Clendenin,<br />
2001, personal communication). Recognition of younger<br />
thrusts at Glassy Mountain have generated questions<br />
concerning the emplacement of the Mill Spring thrust in<br />
the progression of regional events.<br />
Recognition of Stage IV thrusting also supports an insequence<br />
interpretation for the emplacement of the regional<br />
thrust sheets. Recent geologic mapping in the Table Rock<br />
and Eastatoe Gap 7.5-minute quadrangles (Garihan and<br />
Ranson, in preparation) has delineated fault relationships<br />
between Six Mile, Walhalla, and structurally lower thrust<br />
sheets, possibly including the Stumphouse Mountain nappe<br />
(See Hatcher, 1999a). An unnamed fault at or near the base<br />
of the Walhalla nappe juxtaposes interlayered TRS gneiss<br />
and amphibolite over Henderson Gneiss along a sharp<br />
regional contact in the Table Rock quadrangle (Figure 2,<br />
cross section E-E’). As part of the thrusted rock packages<br />
beneath the Walhalla thrust sheet in the western IP, two<br />
important zones of ductilely-deformed PMF amphibolite,<br />
biotite gneiss, and garnet mica schist are < 1.5 km wide and<br />
persist for > 80 km along strike. The bounding thrusts<br />
(several faults shown with double sawteeth pattern, Figure<br />
1) are positioned more to the northwest, toward the southern<br />
Appalachian foreland; and based on field relationships, they<br />
truncate the unnamed TRS gneiss-Henderson Gneiss thrust,<br />
located to the southeast (Figure 2, cross section E-E’). These<br />
geologic map relationships and associated cross sectional<br />
10<br />
information indicate in-sequence IP thrusting.<br />
6) Stage V: Mesozoic oblique brittle faulting. Brittle<br />
faulting offsets the Seneca fault in the Camp Greenville<br />
exposures (Figure 6) and is interpreted to be the final stage<br />
of deformation recognizable in the Solomon Jones Road<br />
exposures. Recent mapping of Mesozoic brittle faults in the<br />
Tigerville quadrangle used the trace of the Seneca thrust to<br />
delineate oblique-slip offset, in lieu of distinctive lithologic<br />
markers (Clendenin and Garihan, 2001). The surface trace<br />
of the Seneca fault is offset both left- and right-oblique along<br />
faults which post-date Mesozoic silicification of the Pax<br />
Mountain fault system (Garihan and Ranson, 1992;<br />
Clendenin and Garihan, 2001). Similar stages of brittle<br />
faulting have offset the trace of the Sugarloaf Mountain<br />
(Seneca) fault in the southern Saluda 7.5-minute quadrangle<br />
(Warlick and others, this volume).<br />
SUMMARY<br />
The Seneca fault lies at the base of the Six Mile nappe<br />
in north-northwest South <strong>Carolina</strong> and has been mapped in<br />
the IP for over thirty years (See Griffin, 1969a, 1969b,<br />
1971a, 1971b). Footwall rocks of the underlying Walhalla<br />
nappe may be TRS, Henderson Gneiss, or granitoid, whereas<br />
hanging wall rocks of the Six Mile nappe are either PMF or<br />
Tallulah Falls Formation. Throughout the IP, the Seneca fault<br />
is mapped at a sharp, gently inclined contact at the top of a<br />
zone of extreme grain-size reduction in the footwall. Map<br />
information also shows that the fault can be traced into the<br />
Columbus Promontory, where it is referred to as the<br />
Sugarloaf Mountain thrust.<br />
Field relationships show that younger polyphase<br />
deformation overprinted the IP following fold-thrust nappe<br />
emplacement (See Griffin, 1978). Subsequent folding and<br />
thrusting of the Seneca fault argues against interpretations<br />
that the fault is one of the youngest thrusts in the IP. The<br />
macroscopic and mesoscopic structures described here are<br />
consistent with models of in-sequence thrusting (Boyer and<br />
Elliot, 1982; Mitra, 1986). Studies of cutoff-line map<br />
patterns and folded faults to the west in the Appalachian<br />
Valley and Ridge Province show that thrusting developed<br />
in a hinterland-to-foreland progression (Woodward and<br />
Bates, 1988). This pattern defines in-sequence thrusting,<br />
and tops of thrust ramps are regions of concentrated<br />
imbrication and disharmonic folding (Royse and others,<br />
1975; Harris and Milici, 1977). In-sequence, Stage Ib duplex<br />
thrusting at the top of a small ramp along the Seneca fault<br />
at Camp Greenville mimics these descriptions.<br />
One consequence of an interpretation of in-sequence<br />
IP thrusting is that the Alto Allochthon may not have been<br />
emplaced by a far-traveled, out-of-sequence Seneca fault,<br />
as suggested by Nelson and others (1986). If in-sequence<br />
thrusting is true, the Seneca fault may not have had the<br />
continuity to bridge the present 20 to 25 km-wide gap<br />
between the Alto Allochthon and the eroded edge of the<br />
Six Mile nappe in western South <strong>Carolina</strong> (Figure 1). Other<br />
thrusts in either the Stumphouse Mountain or Walhalla
nappes, which lie in the gap, may be better candidates for<br />
the thrust at the base of the Alto Authochthon. Mapping in<br />
Eastatoe Gap and Table Rock 7.5-minute quadrangles also<br />
shows that different thrusts in the gap are younger Stage IV<br />
thrusts (Garihan and Ranson, 2001). Displacement of the<br />
Seneca fault and Six Mile rocks along Stage IV thrusts is<br />
recognized in the Mulligan’s View exposure, and it is<br />
presently unknown which Six Mile klippen to the northnorthwest,<br />
if any, are actually bounded by Stage IV thrusts.<br />
A Stage IV thrust transporting Six Mile Poor Mountain<br />
Formation rocks to the north-northwest could give the<br />
impression that the Seneca fault lies at the base of Alto<br />
Authochthon and is out-of-sequence. Additional detailed<br />
mapping and accurate dating of IP relationships will be<br />
required to resolve these problems.<br />
ACKNOWLEDGEMENTS<br />
Thanks go to Greg McKee, Camp Director, for access<br />
to exposures at Camp Greenville. I am pleased to<br />
acknowledge the assistance, helpful discussions in the field,<br />
and review of this paper provided by W. A. Ranson, Furman<br />
University. C. W. Clendenin, South <strong>Carolina</strong> <strong>Geological</strong><br />
Survey, provided critical reviews of multiple versions of<br />
the manuscript. My sincere thanks go to these outspoken<br />
geologists and friends for their continued support.<br />
REFERENCES<br />
Boyer, S. E., and D. Elliott, 1982, Thrust systems: American<br />
Association of Petroleum Geologists, v. 66, no. 9,<br />
p.1196-1230.<br />
Bream, B. R., 1999, Geologic map of part of the western<br />
Inner Piedmont in North <strong>Carolina</strong>, unpublished map<br />
compilation, 1:100,000.<br />
Bream, B. R., J. C. Hill, S. D. Giorgis, S. T. Williams, and<br />
R. D. Hatcher, Jr., 1999, New digital geologic 7.5'<br />
quadrangle maps from part of the western Inner<br />
Piedmont of North <strong>Carolina</strong>: <strong>Geological</strong> <strong>Society</strong> of<br />
America, Abstracts with Programs, v. 31, no. 3, p. A-7.<br />
Citron, G. P., and L. D. Brown, 1979, Recent vertical crustal<br />
movements from precise leveling surveys in the Blue<br />
Ridge and Piedmont provinces, North <strong>Carolina</strong> and<br />
Georgia: Tectonophysics, v. 52, p. 223-238.<br />
Clark, G. M., 1993, Quaternary geology and geomorphology<br />
of part of the Inner Piedmont of the southern<br />
Appalachians in the Columbus Promontory upland area,<br />
southwestern North <strong>Carolina</strong> and northwestern South<br />
<strong>Carolina</strong>, in R. D. Hatcher, Jr. and T. L. Davis (editors),<br />
Studies of Inner Piedmont geology with a focus on the<br />
Columbus Promontory: <strong>Carolina</strong> <strong>Geological</strong> <strong>Society</strong><br />
Annual Field Trip Guidebook, p. 67 - 84.<br />
Clark, J. C., and J. H. Knapp, 2000, Evidence of Cenozoic<br />
uplift in the <strong>Carolina</strong>s from drainage morphology:<br />
<strong>Geological</strong> <strong>Society</strong> of America, Abstracts with<br />
Programs, v. 32, no. 2, p. A-11.<br />
11<br />
Clendenin, C. W., and J. M. Garihan, 2001, Timing of brittle<br />
faulting on Pax Mountain: a chicken or the egg question<br />
applicable to Piedmont mapping: <strong>Geological</strong> <strong>Society</strong><br />
of America Abstracts with Programs, v. 33, no. 2, p. A-<br />
18.<br />
Cloos, E., 1964, Wedging, bedding-plane slips, and gravity<br />
tectonics in the Appalachians, in W. D. Lowry (editor),<br />
Tectonics of the Southern Appalachians: Virginia<br />
Polytechnic Institute and State University, Department<br />
of <strong>Geological</strong> Sciences Memoir 1, p. 63-70.<br />
Davis, T. L., 1993, Geology of the Columbus Promontory,<br />
western Inner Piedmont, North <strong>Carolina</strong>, southern<br />
Appalachians, in R. D. Hatcher, Jr. and T. L. Davis<br />
(editors), Studies of Inner Piedmont geology with a<br />
focus on the Columbus Promontory: <strong>Carolina</strong><br />
<strong>Geological</strong> <strong>Society</strong> Annual Field Trip Guidebook,<br />
p. 17-43.<br />
Gable, D. J., and T. Hatton, 1983, Maps of vertical crustal<br />
movements in the conterminous United States over the<br />
last 10 million years, U. S. <strong>Geological</strong> Survey,<br />
Miscellaneous <strong>Geological</strong> Investigations Map 1-1315.<br />
1:5,000,000 – 1:10,000,000.<br />
Garihan, J. M., 1999a, The Sugarloaf Mountain thrust in<br />
the western Inner Piedmont between Zirconia, North<br />
<strong>Carolina</strong> and Pumpkintown, South <strong>Carolina</strong>, in A<br />
Compendium of Selected Field Guides, <strong>Geological</strong><br />
<strong>Society</strong> of America, Southeastern Section Meeting,<br />
March 1999, 17 p.<br />
Garihan, John M., 1999b, The Sugarloaf Mountain thrust<br />
in upstate South <strong>Carolina</strong>: <strong>Geological</strong> <strong>Society</strong> of<br />
America Abstracts with Programs, v. 31, no. 3, p. A<br />
16.<br />
Garihan, John M., 2000, Geologic map of the Cleveland<br />
7.5-minute quadrangle, Greenville and Pickens<br />
counties, South <strong>Carolina</strong>: South <strong>Carolina</strong> Department<br />
of Natural Resources, <strong>Geological</strong> Survey, Open-File<br />
Report 130, 1:24,000.<br />
Garihan, J. M., and W. A. Ranson, 1992, Structure of the<br />
Mesozoic Marietta-Tryon graben, South <strong>Carolina</strong> and<br />
adjacent North <strong>Carolina</strong>, in M. J. Bartholomew, D. W.<br />
Hyndman, D. W. Mogk, and R. Mason (editors),<br />
Basement Tectonics 8: Characterization and<br />
Comparison of Ancient and Mesozoic Continental<br />
Margins: Proceedings of the Eight International<br />
Conference on Basement Tectonics, Kluwer Academic<br />
Publishers, Dordrecht, p. 539-555.<br />
Garihan, J., and W. A. Ranson, 1999, Roadlog and<br />
descriptions of stops in parts of the Table Rock,<br />
Cleveland, and Standingstone Mountain quadrangles,<br />
SC-NC, in A Compendium of Selected Field Guides,<br />
<strong>Geological</strong> <strong>Society</strong> of America, Southeastern Sectional<br />
Meeting, p. 31-39.
Garihan, J. M., and W. A. Ranson, 2001, Geologic transect<br />
across the Table Rock and Eastatoe Gap 7.5-minute<br />
quadrangles, western Inner Piedmont, Greenville and<br />
Pickens counties, SC-NC: <strong>Geological</strong> <strong>Society</strong> of<br />
America America Abstracts with Programs, v. 33, no.<br />
2, p. A-3.<br />
Garihan, J., W. Ranson, C. Vaughan, E. Perry, S. Hicks, and<br />
J. Palmer, 1997, Structural control of erosional<br />
topography across the Blue Ridge Front in the Zirconia<br />
7½-minute quadrangle, Inner Piedmont, SC-NC:<br />
<strong>Geological</strong> <strong>Society</strong> of America Abstracts with<br />
Programs, v. 29, no. 3, p. 18.<br />
Garihan, John M., Kalbas, J., and Clendenin, C. W., 2000,<br />
Geologic map of the Slater 7.5-minute quadrangle,<br />
Greenville County, South <strong>Carolina</strong>: South <strong>Carolina</strong><br />
Department of Natural Resources, <strong>Geological</strong> Survey,<br />
Open-File Report 129. 1:24,000.<br />
Griffin, V. S., Jr., 1969a, Migmatitic Inner Piedmont belt of<br />
northwestern South <strong>Carolina</strong>: South Geology Notes,<br />
v. 13, p. 87-104. South <strong>Carolina</strong> State Development<br />
Board.<br />
Griffin, V. S., Jr., 1969b, Inner Piedmont tectonics in the<br />
vicinity of Walhalla, South <strong>Carolina</strong>: Geologic Notes,<br />
v. 14, no. 4, p. 15-28. South <strong>Carolina</strong> State<br />
Development Board.<br />
Griffin, V. S., Jr., 1971a, Stockwork tectonics in the<br />
Appalachian Piedmont of South <strong>Carolina</strong> and Georgia:<br />
Geologische Rundschau, v. 60, p. 868-886.<br />
Griffin, V. S., 1971b, The Inner Piedmont belt of the southern<br />
crystalline Appalachians: <strong>Geological</strong> <strong>Society</strong> of<br />
America Bulletin, v. 82, p. 1885-1898.<br />
Griffin, V. S., Jr., 1974, Analysis of the Piedmont in<br />
northwest South <strong>Carolina</strong>: <strong>Geological</strong> <strong>Society</strong> of<br />
America Bulletin, v. 85, p. 1123-1138.<br />
Griffin, V. S., Jr., 1977, Preliminary geologic map of the<br />
South <strong>Carolina</strong> Inner Piedmont belt: Geologic Notes,<br />
v. 21 (no. 4), p. 198-204. South <strong>Carolina</strong> State<br />
Development Board.<br />
Griffin, V. S., Jr., 1978, Detailed analysis of tectonic levels<br />
in the Appalachian Piedmont: Geologische Rundschau,<br />
v. 67, p. 180-201.<br />
Hack, J. T., 1982, Physiographic divisions and differential<br />
uplift in the Piedmont and Blue Ridge: U. S. <strong>Geological</strong><br />
Survey Professional Paper 1265, 49 p.<br />
Harris, L. D., and R. C. Milici, 1977, Characteristics of thinskinned<br />
style of deformation in the southern<br />
Appalachians, and potential hydrocarbon traps: U. S.<br />
<strong>Geological</strong> Survey Professional Paper 1018, 40 p.<br />
Hatcher, R. D., Jr., 1993, Perspective on the tectonics of the<br />
Inner Piedmont, southern Appalachians, in R. D.<br />
Hatcher, Jr. and T. L. Davis (editors), Studies of Inner<br />
Piedmont geology with a focus on the Columbus<br />
Promontory: <strong>Carolina</strong> <strong>Geological</strong> <strong>Society</strong> Annual Field<br />
Trip Guidebook, p. 1-16.<br />
12<br />
Hatcher, R. D., Jr., 1999a, Geotraverse across part of the<br />
Acadian orogen in the southern Appalachians, in A<br />
Compendium of Selected Field Guides, <strong>Geological</strong><br />
<strong>Society</strong> of America, Southeastern Section Meeting,<br />
March 1999, 21 p.<br />
Hatcher, R. D., Jr., 1999b, Digital geologic maps of the<br />
eastern Blue Ridge, and part of the Inner Piedmont in<br />
northeastern Georgia, northwestern South <strong>Carolina</strong>, and<br />
southwestern North <strong>Carolina</strong>: map compilation from<br />
various sources. 1:140,800.<br />
Hatcher, R. D., Jr., and J. R. Butler, 1979, Guidebook for<br />
southern Appalachian field trip in the <strong>Carolina</strong>s,<br />
Tennessee, and northeastern Georgia: International<br />
<strong>Geological</strong> Correlation Program – Caledonide Orogen<br />
Project 27: Chapel Hill, North <strong>Carolina</strong>, University of<br />
North <strong>Carolina</strong>, 117 p.<br />
Hatcher, R. D., Jr., and R. J. Hooper, 1992, Evolution of<br />
crystalline thrust sheets in the internal parts of mountain<br />
chains, in K. R. McClay (editor), Thrust Tectonics,<br />
Chapman and Hall, London, p. 217-233.<br />
Hill, J. C., B. R. Bream, and R. D. Hatcher, Jr., 1998,<br />
Structure and stratigraphy of part of the Inner Piedmont<br />
near Marion, North <strong>Carolina</strong>: <strong>Geological</strong> <strong>Society</strong> of<br />
America Abstracts with Programs, v. 30, no. 4, p. 17.<br />
Hopson, J. L., and R. D. Hatcher, Jr., 1988, Structural and<br />
stratigraphic setting of the Alto allochthon, northeast<br />
Georgia: <strong>Geological</strong> <strong>Society</strong> of America Bulletin, v.100,<br />
p. 339-350.<br />
Horton, J. W., Jr., and McConnell, K. I., 1991, The western<br />
Piedmont, in J. W. Horton, Jr. and V. A. Zullo (editors),<br />
The Geology of the <strong>Carolina</strong>s, <strong>Carolina</strong> <strong>Geological</strong><br />
<strong>Society</strong> Fiftieth Anniversary Volume: Knoxville, The<br />
University of Tennessee Press, p. 36-58.<br />
Howard, S, S. Blackwell and J. MacLean, 2001, Polyphase<br />
folding in the Six Mile thrust sheet (Inner Piedmont),<br />
Taylors quadrangle, Greenville County, South <strong>Carolina</strong>:<br />
<strong>Geological</strong> <strong>Society</strong> of America Abstracts with<br />
Programs, v. 33, no. 2, p. A-19.<br />
Lemmon, R. E., 1973, Geology of the Bat Cave and<br />
Fruitland quadrangles and the origin of the Henderson<br />
Gneiss, western North <strong>Carolina</strong>: Chapel Hill,<br />
University of North <strong>Carolina</strong>, unpublished Ph.D.<br />
dissertation, 145 p.<br />
Lemmon, R. E., 1982, Evidence for an Acadian tectonic<br />
event in the western Inner Piedmont, North <strong>Carolina</strong>:<br />
<strong>Geological</strong> <strong>Society</strong> of America, Abstracts with<br />
Programs, v. 14, nos. 1&2, p. 34.<br />
Lemmon, R. E., and D. E. Dunn, 1973, Geologic map and<br />
mineral resources of the Bat Cave quadrangle, North<br />
<strong>Carolina</strong>: North <strong>Carolina</strong> Department of Natural<br />
Resources and Community Development Map GM 202<br />
NW. 1:24,000.<br />
Mitra, Shankar, 1986, Duplex structures and imbricate thrust<br />
systems: geometry, structural position, and hydrocarbon<br />
potential: American Association of Petroleum<br />
Geologists, v. 70, no. 9, p. 1087-1112.
Nelson, A. E., J. W. Horton, Jr. and J. W. Clarke, 1986,<br />
Stacked thrust sheets of the Piedmont and Blue Ridge<br />
Provinces, northeast Georgia and western South<br />
<strong>Carolina</strong>: <strong>Geological</strong> <strong>Society</strong> of America, Abstracts<br />
with Programs, v. 17, p. 674.<br />
Nelson, A. E., J. W. Horton, Jr. and J. W. Clarke, 1987,<br />
Generalized tectonic map of the Greenville 1° x 2°<br />
quadrangle, Georgia, South <strong>Carolina</strong>, and North<br />
<strong>Carolina</strong>: U. S. <strong>Geological</strong> Survey Miscellaneous Field<br />
Studies Map MF-1898. 1:250,000.<br />
Nelson, A. E., J. W. Horton, Jr. and J. W. Clarke, 1998,<br />
Geologic map of the Greenville 1° x 2° quadrangle,<br />
Georgia, South <strong>Carolina</strong>, and North <strong>Carolina</strong>: U. S.<br />
<strong>Geological</strong> Survey Miscellaneous <strong>Geological</strong><br />
Investigations Map I-2175. 1:250,000.<br />
Ramsay, J. G., M. Casey, and R. Klingfield, 1983, Role of<br />
shear in development of the Helvetic fold-thrust belt<br />
of Switzerland: Geology, v. 12, no. 8, p. 439-442.<br />
13<br />
Royse, F., M. A. Warner and D. L. Reese, 1975, Thrust belt<br />
of Wyoming, Idaho, and northern Utah, structural<br />
geometry and related problems, in Symposium on deep<br />
drilling frontiers in the central Rocky Mountains,<br />
Denver, Colorado. Rocky Mountain <strong>Geological</strong><br />
Association, p. 41-54.<br />
Serra, S., 1977, Styles of deformation in the ramp regions<br />
of overthrust faults, in E. L. Heisey, D. E. Lawson, E.<br />
R. Norwood and L. A. Hale (editors), Rocky Mountain<br />
Thrust Belt Geology and Resources, Wyoming<br />
<strong>Geological</strong> Association, 29th Annual Field Conference,<br />
p. 487-498.<br />
Woodward, N. B., and J. W. Bates, 1988, Critical evidence<br />
for southern Appalachian thrust sequence, in G. Mitra<br />
and S. Wojtal (editors), Geometries and mechanisms<br />
of thrusting, with special reference to the Appalachians,<br />
<strong>Geological</strong> <strong>Society</strong> of America, Special Paper 222,<br />
p. 165-178.
South <strong>Carolina</strong> Geology, 2001, v. 43, p. 15 – 24.<br />
PARIS MOUNTAIN PROJECT: PART 1, <strong>GEOLOGY</strong> OF TAYLORS 7.5-<br />
MINUTE QUADRANGLE, GREENVILLE COUNTY, <strong>SOUTH</strong> <strong>CAROLINA</strong><br />
JOHN S. MACLEAN and SETH S. BLACKWELL, Department of Earth and Environmental<br />
Sciences, Furman University, Greenville, SC 29613<br />
ABSTRACT<br />
This study reports the initial findings of a regional project to determine whether or not the Paris Mountain thrust sheet<br />
exists as it has been mapped. The focus area for the study is Taylors 7.5-minute quadrangle, Greenville County, South<br />
<strong>Carolina</strong>. This quadrangle was selected because it covers part of the proposed structural boundary between the Paris<br />
Mountain thrust sheet and the underlying Six Mile thrust sheet.<br />
Mapping shows that the study area can be subdivided into three map segments, which are referred to as the northern,<br />
middle and southern segments. A particular rock assemblage characterizes each map segment. Biotite gneiss with interlayered<br />
amphibolite crops out in the northern segment; sillimanite-mica schist crops out in the middle segment; and migmatitic<br />
mica schist and metagranite crop out in the southern segment. The biotite gneiss assemblage is correlated with the upper<br />
member of the Tallulah Falls Formation, and the mica schists are correlated with the middle member. Mapping also identified<br />
polyphase folding that is comparable to fold phases on a regional scale. No continuous structure is identified in the northern<br />
map segment, where a thrust has been proposed to separate the Paris Mountain and Six Mile thrust sheets.<br />
INTRODUCTION<br />
Stacked, crystalline thrust sheets consisting of mediumto<br />
high-grade metamorphic rock assemblages and intrusive<br />
rocks make up the Inner Piedmont of the <strong>Carolina</strong>s. Recent<br />
geologic maps and map compilations have laid the<br />
groundwork that allows correlation of lithologic units<br />
between the different thrust sheets (Davis, 1993; Hatcher,<br />
1993; Maybin and others, 1998; Nelson and others, 1987,<br />
1998; Garihan, 1999). This map information has expanded<br />
the original descriptions of the fold-nappe structural style<br />
and regional ductile, migmatitic character of the Inner<br />
Piedmont proposed by Griffin (1974, 1978).<br />
Nelson and others (1998) modified Griffin’s (1974,<br />
1978) map interpretations and proposed on their map of<br />
the Greenville 1 o x 2 o quadrangle that the Paris Mountain<br />
thrust sheet (PM) lies on top of the Six Mile thrust sheet<br />
(SM). On their map, the rock assemblage composing the<br />
underlying SM consists of muscovite-biotite schist, biotite<br />
schist, migmatitic sillimanite-mica schist, amphibolite,<br />
biotite gneiss, felsic gneiss, and minor manganiferous schist<br />
and gondite; and the overlying PM consists of sillimanitemica<br />
schist, locally interlayered with amphibolite, quartzite<br />
and garnet-sillimanite schist (Nelson and others, 1998).<br />
Garihan (1999) correlated the SM metamorphic assemblage<br />
with the Tallulah Falls Formation.<br />
Although the rock assemblages of the two thrust sheets<br />
appear to be unrelated, Nelson and others (1998) pointed<br />
out in the text accompanying their map that the thrusts at<br />
the base and roof of PM are largely inferred. Maybin and<br />
others (1998) did not show the PM on their regional<br />
compilation because of the inferred nature of the thrust sheet.<br />
In an effort to resolve this controversy, a multiyear,<br />
cooperative mapping project was organized between the<br />
15<br />
South <strong>Carolina</strong> <strong>Geological</strong> Survey and the Earth and<br />
Environmental Sciences Department of Furman University.<br />
The fundamental purpose of this cooperative project,<br />
referred to as the Paris Mountain Project, is to determine<br />
whether or not PM exists as it is presently mapped. Taylors<br />
7.5-minute quadrangle (TQ), Greenville County, South<br />
<strong>Carolina</strong>, was selected to be the initial study area of this<br />
regional project because the quadrangle covers a part of the<br />
proposed structural boundary between PM and the<br />
underlying SM (Figure 1). In this paper, we discuss the<br />
geology of TQ and report the initial findings of the Paris<br />
Mountain Project.<br />
FIELD RELATIONSHIPS<br />
During the summer of 2000, TQ geology was mapped<br />
in detail at 1:24,000, using standard field techniques.<br />
Although natural outcrops are limited in urbanized areas,<br />
rock is commonly exposed in borrow pits, in house<br />
foundation excavations, along road cuts and under railroad<br />
bridges. Lithologic and structural data were collected at a<br />
variety of such sites, of which the locations were established<br />
by use of a hand-held GPS unit.<br />
In overview, the geology of TQ (Blackwell and<br />
MacLean, 2001; MacLean and Blackwell, 2001) can be<br />
divided into three distinctive rock packages based on<br />
dominant lithologic and structural elements, and the eastwest<br />
trending pattern of these rock packages allows TQ to<br />
be divided into three map segments (Figure 2). A map<br />
segment approach was adopted because the proposed<br />
structural break between PM and SM projected across TQ<br />
as a curving, east-west line.
Figure 1. Regional location map of a portion of the Inner Piedmont, Greenville and Spartanburg counties, South <strong>Carolina</strong>, showing Taylors quadrangle<br />
in relation to surrounding quadrangles and thrust sheets. Quadrangles are: Slater (Garihan and others, 2000), Paris Mountain (Niewendorp and others,<br />
1997) and Greer (Maybin, 1998). Rock units: bgn-amp – biotite gneiss with amphibolite and hornblende gneiss; sms – sillmanite-mica schist; mgr –<br />
metagranite; d – diabase; ms – migmatitic schist. Symbols: dash –contact between rock units; line with sawteeth – thrust fault, with sawteeth on up side.<br />
Northern map segment<br />
The northern map segment (NMS) of TQ contains two<br />
distinct lithologies: biotite gneiss and amphibolite (Figure<br />
2). Biotite gneiss, the dominant rock type, is sparingly<br />
interlayered with hornblende gneiss and amphibolite. Where<br />
exposed in pavements, polyphase folding can be recognized.<br />
NMS biotite gneiss is typically medium- to coarsely<br />
crystalline and well-foliated, with 1-5 mm layers of biotite<br />
alternating with 0.5- to 3-cm layers of quartz and feldspar.<br />
Garnet may be recognized in some hand specimens. The<br />
compositional layering is most often planar, although locally<br />
folded. Layering ranges from thin (
Figure 2. Generalized geological map of Taylors quadrangle, showing<br />
lithologic units, macroscopic structural features and locations of cross<br />
sections. Rock units: bgn – biotite gneiss; am – amphibolite and hornblende<br />
gneiss; sms – sillimanite-mica schist; ms – migmatitic schist; mgr – biotite<br />
metagranite; gtd – granitoid; d – diabase. Line with sawteeth – small,<br />
southwest-directed thrust faults, with sawteeth on up side. ER – East<br />
Riverside Park; EH – Eastside High School; CF – Christian Fellowship<br />
Church; MC – Mountain Creek Church; J – Jubilee Church; PC – Pebble<br />
Creek Golf Course; WM – West Main fault; SM – Suber Mills.<br />
macroscopic fold, referred to here as the Lake Cunningham<br />
synform, is present in the eastern half of the NMS (Figures<br />
2 and 5). Stereoplot analysis of deformational foliations<br />
indicates that the Lake Cunningham synform has a gentle<br />
easterly plunge (17°/ N88°E).<br />
Middle map segment<br />
The principal lithology in the middle map segment<br />
(MMS) of TQ is sillimanite-mica schist (Figure 2).<br />
Psammitic biotite gneiss is interlayered with the sillimanitemica<br />
schist, and both lithologies are intruded by granitoid.<br />
MMS sillimanite-mica schist does not crop out in many<br />
streams; it is found in railroad cuts, road cuts, slope<br />
exposures and borrow pits. Exposed surfaces commonly<br />
exhibit a thin, orange, weathered rind. Where exposure is<br />
limited, this lithology was mapped by the presence of<br />
abundant mica buttons in the soil.<br />
In hand specimens of MMS sillimanite-mica schist,<br />
three different lithologies can be recognized on the basis of<br />
percentage of sillimanite: 1) muscovite-sillimanite-biotite<br />
schist (25-50% sillimanite); 2) muscovite-biotite-sillimanite<br />
schist (~50-70% sillimanite); and 3) migmatitic mica schist<br />
17<br />
(
A<br />
C<br />
E F<br />
G<br />
18<br />
B<br />
D<br />
Figure 3. Photomicrographs with sillimanite (S), muscovite (M), quartz (Q), plagioclase<br />
(P), epidote (E), biotite (B), feldspar (F), and hornblende (H). A) Biotite gneiss, showing<br />
bundles of prismatic sillimanite retrograding to muscovite. Long dimension field<br />
of view is ~6mm. B) Muscovite coronas outline sillimanite, from Figure 3, A. Long<br />
dimension field of view is ~1mm. C) Hornblende gneiss, with higher relief epidote, biotite,<br />
feldspar and hornblende. Mafic minerals are aligned. Long dimension field of view is ~1mm.<br />
D) Chevron folds in sillimanite-mica schist. Folds are of PC fold phase. Long dimension<br />
field of view is ~6mm. E) Chevron fold in sillimanite-mica schist showing muscovite<br />
porphyroblast, along axial plane of chevron fold; coarse flakes of biotite andsillimanite<br />
needles are bent. Long-dimension field of view is ~6mm. F) Complex folding in sheared<br />
sillimanite-mica schist. Dashes are local schistosity traces. Long dimension field of view is<br />
~6mm. G) Multiple foliations and folding in sillimanite-mica schist. Long dashes are<br />
transposing foliations. Long-dimension field of view is ~6mm.
A<br />
C<br />
Figure 4 A) Superimposed folding in Taylors quadrangle along the Enoree River. Wade Hampton (WH) fold phase deforms Enoree (E) fold phase. B)<br />
Suber Mills (SM) fold in sillimanite-mica schist. Upright, isoclinal fold. C) Pebble Creek (PC) fold phase, showing the chevron character of the<br />
sillimanite mica schist. D) Sillimanite-mica schist and granitoid juxtaposed by imbricate faulting; location is along Southern Railway right-of-way.<br />
In this study, SM folds are considered to be the oldest fold<br />
phase and are designated F 1 . SM folds are rootless, isoclinal,<br />
intrafolial folds that occur in diverse attitudes as a result of<br />
refolding (Figure 4 B). PC folds (F 2 ) also display widely<br />
variable attitudes, and these tight to isoclinal folds are found<br />
in upright to recumbent positions. Harmonic, parasitic F 2<br />
folds display a chevron fold style (Figure 4 C). Both ER<br />
(F 3 ) and WH (F 4 ) folds (Figure 4 A) are open, upright folds,<br />
which trend east-west and north-south, respectively. WH<br />
folds have refolded ER folds at nearly right angles, and have<br />
19<br />
B<br />
D<br />
produced conspicuous dome and basin structures in<br />
pavement exposures (Howard and others, 2001). ER folds<br />
plunge either east or west and WH folds plunge either north<br />
or south, depending on their location on larger macroscopic<br />
folds. A synoptic stereoplot of mesoscopic fold hinges<br />
(Figure 6 A) is used to correlate the hinges with their<br />
associated fold phases.<br />
The two macroscopic fold phases are T (F 5 ) and G (F 6 ),<br />
and both overprint the older, mesoscopic fold phases. G<br />
folds are characterized by north-plunging hinges, and T folds
Table 1<br />
Fold style Toxaway Dome NW Greenville Columbus Promontory Greer, SC Greer-Taylors, SC<br />
This Study<br />
Hatcher, 1977 Nelson, 1985 Davis, 1993 Griffin, 1974 Bramlett and<br />
Griffin, 1978<br />
Rootless F 1 F 1 F 1 Primary? Primary?<br />
Suber Mills<br />
isoclinal (Walhalla)<br />
Tight to F 2 F 2 F 2 and F 3 ? Primary? Primary<br />
Pebble Creek<br />
isoclinal F 3 NW vergent to<br />
chevrons crenulations? recumbent<br />
(Walhalla)<br />
Upright E-W F 4 F 3 Secondary<br />
Enoree<br />
trending<br />
Upright NNW F 4 and F 5 ? F 3 Secondary Cross-folds?<br />
Wade Hampton<br />
trending<br />
Map scale F 4 ? Overturned<br />
Greer<br />
Antiform<br />
Map scale F 4 ? Overturned<br />
Taylors<br />
Antiform<br />
after Howard and others ( 2001)<br />
are characterized by east-plunging hinges. On stereoplot<br />
analysis, the statistical hinge (beta) of the Taylors synform<br />
is oriented ~19°/ N78°E (Figure 6, B), whereas the Greer<br />
antiform hinge is oriented ~31°/N13°E (Figure 6 C). The<br />
Greer antiform refolds the Taylors synform in the eastern<br />
part of the MMS (Figure 2). The previously described<br />
macroscopic folds in the NMS are either T or G.<br />
Small, northwest-striking, west-verging thrust faults occur<br />
in the MMS (Figure 2) and offset all the described fold<br />
phases. Along the old Southern Railway and Seaboard<br />
Railway rights-of-way near the western edge of TQ, these<br />
thrusts crop out as a set of imbricates that juxtapose a series<br />
of sillimanite-mica schist and granitoid horse blocks (Figure<br />
4 D). In other localities, single thrusts juxtapose sillimanitemica<br />
schist against sillimanite-mica schist.<br />
Southern map segment<br />
Metagranite, psammitic biotite gneiss and migmatitic<br />
mica schist crop out in the southern map segment (SMS,<br />
20<br />
Figure 2). Poor exposure and deep weathering hamper<br />
mapping in this map segment; nonetheless, temporary<br />
excavations at construction sites provide excellent bedrock<br />
exposure. Metagranite occurs primarily in the eastern<br />
portion of the SMS, whereas migmatitic mica schist crops<br />
out in the western portion. In most localities, SMS<br />
metagranite is mapped on the basis of yellow-orange, sandytextured,<br />
quartzo-feldspathic soil. Hand specimens of<br />
metagranite are composed of medium- to coarsely<br />
crystalline microcline, plagioclase, and quartz with finely<br />
crystalline biotite (~15-20%). Although texturally similar<br />
to the MMS granitoid, the SMS metagranite contains ~10%<br />
more biotite. Commonly, no distinct foliation is seen in the<br />
SMS metagranite; but a faint shear foliation of sparsely<br />
aligned biotite occurs locally. SMS migmatitic mica schist<br />
is similar to that described in the MMS. Biotite psammitic<br />
gneiss (gray gneiss) is more massive in the SMS and<br />
probably has origins related to the migmatitic mica schist.<br />
SMS gray gneiss and metagranite commonly occur together
21<br />
Figure 5. Interpretive cross sections A-A’ and B-B’. Rock-unit designations are the same as in Figure 2. Locations of cross sections are shown on Figure 2. Dashed lines represent<br />
apparent dips projected into the line of each cross section. Cross sections are at different scales. No vertical exaggeration. SM – Suber Mills fold.
Figure 6. A) Synoptic, equal-area stereoplot of 37 mesoscopic hinges measured throughout Taylors quadrangle. The hinges are grouped to indicate<br />
individual fold phases. WH – Wade Hampton fold phase; E – Enoree fold phase. B) Southern hemisphere, equal-area stereoplot of poles to foliation in<br />
sillimanite mica schist along the axial trace of the Taylors synform. The synform plunges 19°/ N78°E. C) Southern hemisphere, equal-area stereoplot of<br />
poles to foliation in sillimanite mica schist along the trace of the Greer antiform. The antiform plunges 30°/N13°E.<br />
in exposures; and, as a result of poor exposure, the two<br />
rocks are mapped as a single unit in the eastern portion of<br />
the SMS. Field relationships, however, suggest that the<br />
metagranite intruded both the SMS gray gneiss and<br />
migmatitic mica schist bodies.<br />
Diabase dikes crosscut SMS metagranite (Figure 2) and<br />
can be traced into the MMS. These discontinuous (?) dikes,<br />
recognized along strike for 1.5 to 2 km, appear to be<br />
arranged in an en echelon pattern. The dikes are oriented<br />
22<br />
~N50°W, similar to the regional N45°-50°W strike of<br />
diabase dikes originally mapped across Greenville County<br />
by Koch (1968). All of the diabase dikes are assumed to be<br />
early Jurassic in age (Ragland, 1991).<br />
DISCUSSION<br />
TQ lies between two 7.5-minute quadrangles recently<br />
mapped by geologists of the South <strong>Carolina</strong> <strong>Geological</strong><br />
Survey: Niewendorp and others (1997) mapped Paris
Mountain quadrangle (PMQ) to the west, and Maybin<br />
(1998) mapped Greer quadrangle (GQ) to the east. These<br />
three quadrangles encompass the proposed northern<br />
boundary of PM. A compilation of parts of the baseline<br />
maps of these quadrangles, as well as part of Slater 7.5minute<br />
quadrangle (SQ; Garihan and others, 2000), is shown<br />
in Figure 1. The unnamed basal thrust of PM proposed by<br />
Nelson and others (1998) is also shown on the compilation.<br />
An overview shows that the hook-like trace of the proposed<br />
basal thrust is located essentially in the middle of the NMS<br />
(Figure 1). Our mapping shows that the NMS is characterized<br />
by biotite gneiss with sparsely interlayered amphibolite<br />
and that the MMS is predominately sillimanite-mica schist.<br />
These map units fit the descriptions of the rock assemblages<br />
defined by Nelson and others (1998) for the SM and PM,<br />
respectively. Thrust faults have been mapped along their<br />
mutual contact on PMQ (Niewendorp and others, 1997). It<br />
is common practice in Inner Piedmont mapping to draw a<br />
fault at a pronounced lithologic change, and MMS<br />
sillimanite-mica schist is structurally above NMS biotite<br />
gneiss on TQ (Figure 5 cross sections). Although there is a<br />
pronounced lithologic change, we find no conclusive<br />
evidence for a thrust contact between NMS biotite gneiss<br />
and MMS sillimanite-mica schist on TQ. Mapping shows<br />
that foliation strikes are parallel in these rock units. This<br />
parallelism of foliation suggests that NMS biotite gneiss<br />
and MMS sillimanite-mica schist are not faulted along their<br />
contact. Field relationships also show that this contact is<br />
folded just south of the Lake Cunningham synform where<br />
the proposed thrust and contact roughly coincide (Figures<br />
1 and 2). A folded contact is confirmed in GQ where Maybin<br />
(1998) duplicated Bramlett and Griffin’s (1978) mapping.<br />
If a thrust does not exist between NMS biotite gneiss<br />
and MMS sillimanite-mica schist on TQ, other explanations<br />
should be explored. To the northwest in SQ, Garihan and<br />
others (2000) mapped NMS biotite gneiss and amphibolite<br />
in the SM (Figure 1). As previously mentioned, the rock<br />
assemblages of the SM are correlated with the Tallulah Falls<br />
Formation (Garihan, 1999). The Tallulah Falls Formation<br />
has been subdivided into three distinct lithostratigraphic<br />
members, and these divisions can be described as follows<br />
without reference to protolith: a lower amphibolite-rich<br />
member, a middle aluminous schist member, and an upper<br />
amphibolite-poor member (Hopson and Hatcher, 1988). In<br />
his study of the Columbus Promontory, Davis (1993)<br />
described similar lithologic relationships by characterizing<br />
the upper amphibolite-poor member as dominantly a thick<br />
sequence of migmatitic biotite gneiss and metagraywacke,<br />
containing pods and lenses of amphibolite. Davis (1993)<br />
also reported that amphibolite in the lower amphibolite-rich<br />
member is generally more coarsely crystalline and more<br />
massive, and that it occurs in large pods and sill-like<br />
stringers.<br />
On the basis of these regional descriptions of the<br />
members of the Tallulah Falls Formation, we propose that<br />
23<br />
the NMS biotite gneiss and interlayered amphibolite<br />
correlate with the upper amphibolite-poor member and that<br />
the MMS sillimanite-mica schist and the SMS migmatitic<br />
mica schist correlate with the middle aluminous schist<br />
member. These correlations are tentative because Davis<br />
(1993) did not specify the abundance of amphibolite in the<br />
Tallulah Falls members. Our correlation of NMS rocks with<br />
the upper Tallulah Falls Formation is based primarily on<br />
the relative scarcity of amphibolite, which is, roughly<br />
estimated to be less than 15% of the rock package across<br />
NMS.<br />
If these correlations are correct, the rocks in the NMS<br />
are tightly folded or overturned because field relations show<br />
MMS sillimanite-mica schist is structurally above NMS<br />
biotite gneiss (Figure 5). The presence of such macroscopic<br />
folding implies that the geology of TQ was initially<br />
deformed by a north-northwest-verging SM structure. This<br />
interpretation is consistent with observations of macroscopic<br />
recumbent relationships in the SM just to the north in<br />
southern Tigerville quadrangle (Clendenin and Garihan, in<br />
preparation). Bramlett and Griffin (1978) recognized<br />
numerous fold phases in the southwest corner of GQ. Those<br />
fold phases include: rootless, intrafolial isoclinal folds;<br />
northwest-vergent, recumbent, tight to isoclinal folds;<br />
upright, north-northeast-trending cross folds; and<br />
macroscopic, inclined antiforms (Bramlett and Griffin,<br />
1978, their Figure 2, p. 35). All of these fold phases are<br />
seen in TQ. Folds similar to the SM, PC, E, and WH fold<br />
phases have been reported from the Toxaway Dome<br />
(Hatcher, 1977), the northwestern Greenville 1° x 2° sheet<br />
(Nelson, 1985), and the Columbus Promontory (Davis,<br />
1993). The fold phases recognized in TQ are compared to<br />
those observations in Table 1.<br />
The thrust faults in TQ, striking N45°-55°W (Figure<br />
2), may be related to the thrusts mapped in PMQ (Figure<br />
1). These thrust faults are brittle structures and locally are<br />
marked by slickenlines. Arrangement and structural style<br />
of these thrusts suggests that the faults may be part of either<br />
an imbricate or duplex macroscopic thrust stack. At present,<br />
however, more work is required to understand the nature of<br />
these thrusts and the nature of the PM.<br />
ACKNOWLEDGEMENTS<br />
The South <strong>Carolina</strong> <strong>Geological</strong> Survey and Furman<br />
University provided financial and logistical support for<br />
geologic mapping of Taylors quadrangle. Seth S. Blackwell<br />
was supported by the 2000 American Association of State<br />
Geologists Mentored Field Experience Program, under the<br />
sponsorship of the South <strong>Carolina</strong> <strong>Geological</strong> Survey, and<br />
John S. MacLean was supported by a Furman Advantage<br />
Research Fellowship. The writers thank C.W. Clendenin<br />
and C. S. Howard for their patience during field mapping<br />
and discussions of TQ and J. M. Garihan, W. A. Ranson, C.<br />
W. Clendenin, Arthur Maybin and Irene Boland for helpful<br />
reviews.
REFERENCES<br />
Blackwell, Seth S., and John S. MacLean, 2001, Geologic<br />
map of the western half of Taylors 7.5 minute<br />
quadrangle, Greenville county, South <strong>Carolina</strong>: South<br />
<strong>Carolina</strong> <strong>Geological</strong> Survey Open-File Report 133.<br />
1:24,000.<br />
Bramlett, K., and V. S. Griffin, Jr., 1978, Geology of the<br />
Greer and Greenville-Spartanburg Airport area, South<br />
<strong>Carolina</strong>: South <strong>Carolina</strong> <strong>Geological</strong> Survey, Geologic<br />
Notes, v. 22, p. 32-39.<br />
Davis, T. L., 1993, Geology of the Columbus Promontory,<br />
western Inner Piedmont, North <strong>Carolina</strong>, Southern<br />
Appalachians, in R. D. Hatcher, Jr., and T. L. Davis<br />
(editors), Studies of Inner Piedmont geology with a<br />
focus on the Columbus Promontory: <strong>Carolina</strong><br />
<strong>Geological</strong> <strong>Society</strong> Annual Field Trip Guidebook, p.<br />
17-43.<br />
Garihan, J. M., 1999, The Sugarloaf Mountain thrust in the<br />
western Inner Piedmont between Zirconia, North<br />
<strong>Carolina</strong> and Pumpkintown, South <strong>Carolina</strong>, in A<br />
Compendium of Selected Field Guides, <strong>Geological</strong><br />
<strong>Society</strong> of America, Southeastern Section Meeting,<br />
March 1999, 17 p.<br />
Garihan, J. M., J. L. Kalbas, and C. W. Clendenin, Jr., 2000,<br />
Geology of the Slater 7.5-minute quadrangle,<br />
Greenville County, South <strong>Carolina</strong>: South <strong>Carolina</strong><br />
<strong>Geological</strong> Survey Open-File Report 129, 1:24,000.<br />
Griffin, V.S., Jr., 1974, Analysis of the Piedmont in northwest<br />
South <strong>Carolina</strong>: <strong>Geological</strong> <strong>Society</strong> of America<br />
Bulletin, v. 85, p. 1123-1138.<br />
Griffin, V. S., Jr., 1978, Detailed analysis of tectonic levels<br />
in the Appalachian Piedmont: Geologische<br />
Rundschau,v. 67, p. 180-201.<br />
Hatcher, R. D., Jr., 1977, Macroscopic polyphase folding<br />
illustrated by the Toxaway dome, eastern Blue Ridge,<br />
South <strong>Carolina</strong>-North <strong>Carolina</strong>: <strong>Geological</strong> <strong>Society</strong> of<br />
America Bulletin, v. 88, p. 1678-1688.<br />
Hatcher, R. D., Jr., 1993, Perspective on the tectonics of the<br />
nner Piedmont, southern Appalachians, in R. D.<br />
Hatcher, Jr., and T. L. Davis (editors), Studies of Inner<br />
Piedmont geology with a focus on the Columbus<br />
Promontory: <strong>Carolina</strong> <strong>Geological</strong> <strong>Society</strong> Annual Field<br />
Trip Guidebook, p. 1-16.<br />
Hopson, J. L., and R. D. Hatcher, Jr., 1988, Structural and<br />
stratigraphic setting of the Alto allochthon, northeast<br />
Georgia: <strong>Geological</strong> <strong>Society</strong> of America Bulletin, v.100,<br />
p. 339-350.<br />
24<br />
Howard, S., S. Blackwell, and J. MacLean, 2001, Polyphase<br />
folding in the Six Mile thrust sheet (Inner Piedmont),<br />
Taylors quadrangle, Greenville County, South <strong>Carolina</strong>:<br />
<strong>Geological</strong> <strong>Society</strong> of America, Abstracts with<br />
Programs, p. A-19.<br />
Koch, N. C., 1968, Ground-water resources of Greenville<br />
County, South <strong>Carolina</strong> State Development Board,<br />
Bulletin No.38, 72 p. MacLean, John S., and Seth S.<br />
Blackwell, 2001, Bedrock geologic map of the eastern<br />
half of Taylors 7.5 minute quadrangle, Greenville<br />
county, South <strong>Carolina</strong>: South <strong>Carolina</strong> <strong>Geological</strong><br />
Survey Open-File Report 134. 1:24,000.<br />
Maybin, A.H., III, 1998, Bedrock geology of the Greer 7.5minute<br />
quadrangle, Greenville and Spartanburg<br />
counties, South <strong>Carolina</strong>: South <strong>Carolina</strong> <strong>Geological</strong><br />
Survey Open-File Report 113, 1:24,000.<br />
Maybin, A. H., III, C. W. Clendenin, Jr., and D. L. Daniels,<br />
1998, Structural features of South <strong>Carolina</strong>. South<br />
<strong>Geological</strong> Survey General Geologic Map Series 4,<br />
1:500,000.<br />
Nelson, A. E., 1985, Major tectonic features and structural<br />
elements in the northwest part of the Greenville<br />
quadrangle, Georgia: U. S. <strong>Geological</strong> Survey Bulletin<br />
1643, 22 p.<br />
Nelson, A. E., J. W. Horton, Jr., and J. W. Clarke, 1987,<br />
Generalized tectonic map of the Greenville 1° x 2°<br />
quadrangle, Georgia, South <strong>Carolina</strong>, andNorth<br />
<strong>Carolina</strong>: U. S. <strong>Geological</strong> Survey Miscellaneous Field<br />
Studies Map MF-1898. 1:250,000.<br />
Nelson, A. E., J. W. Horton, Jr., and J. W. Clarke, 1998,<br />
Geologic map of the Greenville 1° x 2° quadrangle,<br />
Georgia, South <strong>Carolina</strong>, and North <strong>Carolina</strong>: U. S.<br />
<strong>Geological</strong> Survey Miscellaneous <strong>Geological</strong><br />
Investigations Map I-2175. 1:250,000.<br />
Niewendorp, C. A., C. W. Clendenin, W. R. Dorr, III, and<br />
A. H. Maybin, 1997, Geologic map of the Paris<br />
Mountain 7.5-minute quadrangle South <strong>Carolina</strong><br />
<strong>Geological</strong> Survey Open-File Report 99. 1:24,000.<br />
Ragland, P. C., 1991, Mesozoic igneous rocks, in J. W.<br />
Horton, Jr. and V. A. Zullo (editors), The Geology of<br />
the <strong>Carolina</strong>s, <strong>Carolina</strong> <strong>Geological</strong> <strong>Society</strong> Fiftieth<br />
Anniversary Volume: Knoxville, The University of<br />
Tennessee Press, p. 171-190.
South <strong>Carolina</strong> Geology, 2001, v.43, p. 25 - 35.<br />
TRANSPOSITION STRUCTURES ON GLASSY MOUNTAIN, SALUDA<br />
7.5-MINUTE QUADRANGLE, GREENVILLE COUNTY, <strong>SOUTH</strong> <strong>CAROLINA</strong><br />
C. SCOTT HOWARD, South <strong>Carolina</strong> Department of Natural Resources - <strong>Geological</strong> Survey, 5 Geology<br />
Road, Columbia, SC 29212<br />
ABSTRACT<br />
Glassy Mountain (Saluda 7.5-minute quadrangle) contains rocks of the Henderson Gneiss, the Mill Spring complex<br />
(Tallulah Falls Formation equivalents) and the Poor Mountain Formation. These units contain a variety of transposition<br />
structures: intrafolial folds, stacked folds, foliation scallops, ausweichungsclivage, foliation enclaves, umfaltungsclivage<br />
and extensional crenulation cleavage. Outcrop and hand-specimen analysis of the transposition structures indicates at least<br />
one cycle of transposition that can be recognized. Additionally, the most recent transposition structure (extensional<br />
crenulation cleavage) suggests a down-to-the-southeast movement direction for the upper limb of a large recumbent nappe,<br />
possibly related to northwest movement of the nappe. These structures are significant because they detail an early history<br />
of isoclinal folding events in the Inner Piedmont similar to other early folding events in the northern and central Appalachians.<br />
INTRODUCTION<br />
Varieties of transposition structures have been<br />
identified on Glassy Mountain (Saluda, North <strong>Carolina</strong> -<br />
South <strong>Carolina</strong> 7.5-minute quadrangle). These structures<br />
transpose foliation and compositional layering, possibly in<br />
more than one transposition event. They are most noticeable<br />
in narrow, near-planar zones tens of centimeters wide that<br />
transect decimeter-thick zones containing foliations with a<br />
different orientation. Surrounding rocks show evidence for<br />
multiple folding events as seen in occasional Type III<br />
interference folds. Transposition is recognized through a<br />
spectrum of individual structures, including intrafolial folds,<br />
stacked recumbent folds, foliation scallops,<br />
auschweichungsclivage, composite foliation and enclaves,<br />
discrete mylonitized zones and probable zones of<br />
umfaltungsclivage, and extensional crenulation cleavages.<br />
Transposition is a process that realigns S-surfaces into<br />
a new orientation, but the fabric elements that make up the<br />
“new” foliation are the same as for the original S-surface.<br />
In earlier definitions, the contribution of new mineral<br />
crystallization was minimal. E. Knopf and Ingerson (1938,<br />
p. 189) translated Bruno Sander’s term “umfaltung” as<br />
transposition, which is a complex term used to describe a<br />
flexural slip process in layered rocks. The Alpine geologist<br />
Albert Heim (cited by E. B. Knopf, 1931) recognized<br />
intermediate stages of transposition, which he termed<br />
“ausweichungsclivage”, but he also recognized the<br />
contributions of neocrystallization to the new S-surface<br />
development. Williams’ (1983) succinct explanation of<br />
transposition forms the basis for ideas used in this paper.<br />
Transposition, as described in this paper, results from<br />
isoclinal folding that reorients an earlier S-surface into a<br />
new orientation, or possibly into the same orientation as<br />
the old. The fabric elements of the original S-surfaces are<br />
preserved, albeit in different arrangements. Additionally,<br />
these transposition zones (foliations) may also have<br />
25<br />
experienced crystal-plastic deformation, which could be the<br />
source of recrystallization and possibly new mineral growth.<br />
Although transposition surfaces initially form as reoriented<br />
S-surfaces, continued shearing in the transposition plane<br />
can lead to strong differential movements between adjacent<br />
zones and to the development of a foliated mylonite. The<br />
implicit factor is that transposition structures are produced<br />
by elevated pressure and temperature, typical of<br />
metamorphic rocks.<br />
Transposition structures on Glassy Mountain<br />
collectively detail different parts of a transposition cycle,<br />
possibly more than one. A transposition cycle occurs during<br />
a progressive simple shear deformation. Folding rotates<br />
layering into parallelism with the shear zone boundaries<br />
(Mawer and Williams, 1991). This cycle can progress<br />
entirely, or it can be incomplete. Later, an incomplete cycle<br />
can start again and then go to completion, or not. Based on<br />
observed field relations, these may be some of the oldest<br />
structural elements visible in and around Glassy Mountain<br />
(cf. Davis, 1993; Yanagihari, 1993), although elements of<br />
the most recent transposition structures may be younger.<br />
Detailed work on mineral assemblages could ascertain more<br />
accurately the ages of these structures relative to events such<br />
as peak metamorphism. The early history of this part of the<br />
southern Appalachians appears to include periods of<br />
repeated isoclinal folding, which is a commonly interpreted<br />
theme used to produce stacked nappe and thrust systems<br />
throughout the Appalachians (Drake, 1980; Stanley and<br />
Ratcliffe, 1985).<br />
PREVIOUS STUDIES<br />
Davis (1993) and Yanagihara (1993) compiled the<br />
geology in the Columbus Promontory in North <strong>Carolina</strong>,<br />
and Hatcher (1998) compiled maps for a large area of the<br />
Inner Piedmont. Both of these compilations are based on
Figure 1. Regional geologic map simplified from Horton and McConnell<br />
(1991) and Hatcher (1998). Rectangular area is approximate location of<br />
Saluda 7.5-minute quadrangle. Abbreviations: BFZ, Brevard fault zone;<br />
LSZ, Lowndesville shear zone; KMSZ, Kings Mountain shear zone; SF,<br />
Seneca fault at the base of Six Mile thrust sheet; H, Henderson Gneiss;<br />
SMT, Sugarloaf Mountain thrust; W, Walhalla nappe complex; MTS, Mill<br />
Springs thrust sheet; random dashed line area, Caesars Head “Granite”.<br />
existing maps, and therefore there are uneven data gaps.<br />
Garihan (1999) mapped several of the adjoining quadrangles<br />
at 1:24000 scale. The work by Warlick and others (this<br />
volume) focused exclusively on the geology of Glassy<br />
Mountain. The basic tectonic models concerning this area<br />
derive from the work of Davis (1993). His model consisted<br />
of an established stratigraphy used to define thrust sheets<br />
bounded by major faults.<br />
GEOLOGIC SETTING<br />
Warlick and others (this volume) mapped the area<br />
around Glassy Mountain on the basis, primarily, of<br />
exposures at The Cliffs at Glassy, a new residential<br />
community on the mountain. Interpretation of the<br />
compilations by Davis (1993) and Hatcher (1998) suggests<br />
that Glassy Mountain is south of the Mill Spring thrust sheet<br />
(Figure 1).<br />
Warlick and others (this volume) mapped biotite gneiss<br />
and metagraywacke of the upper portion of the Mill Spring<br />
complex, and amphibolite, quartzite and schist of the Poor<br />
Mountain Formation in and around Glassy Mountain. The<br />
rocks are part of the Sugarloaf Mountain thrust sheet bound<br />
below by the Sugarloaf Mountain thrust (Davis, 1993). The<br />
Sugarloaf Mountain thrust sheet (Lemmon, 1973) is<br />
structurally beneath the Mill Spring thrust sheet (Figure 2).<br />
New mapping by Warlick and others (this volume) indicates<br />
that the Sugarloaf Mountain thrust passes through the middle<br />
of Glassy Mountain, so the lower part of the mountain<br />
exposes the Henderson Gneiss in the thrust’s footwall. Davis<br />
(1993) described the Henderson Gneiss within the<br />
Tumblebug Creek thrust sheet. Garihan (this volume)<br />
suggests it is part of the Walhalla nappe, and that the<br />
Sugarloaf Mountain thrust sheet is equivalent to the Six Mile<br />
thrust sheet. The recent development at The Cliffs at Glassy<br />
has provided an unparalleled opportunity to view fresh<br />
exposures that reveal significant structures at different levels<br />
in these thrust sheets.<br />
The recognition of probable Henderson Gneiss within<br />
the study area is based on petrographic similarities (C.<br />
Warlick, personal communication, 2001) and mapped,<br />
NW SW<br />
Figure 2. Schematic lithotectonic stratigraphic diagram from the Columbus Promontory, NC (after Davis, 1993). Interpretation by Garihan correlating<br />
SMT with Seneca fault shown. Abbreviations: BFZ, Brevard fault zone; TCT, Tumblebug Creek thrust; SMT, Sugarloaf Mountain thrust; MST, Mill<br />
Spring thrust.<br />
26
Figure 3. Southern portion of Saluda, South <strong>Carolina</strong> 7.5-minute quadrangle. Locations of described outcrops. Coordinates in UTM NAD 1927 (Grid<br />
blocks 1000 meters), contour interval 12 meters. SMT is approximate trace of Sugarloaf Mountain thrust from Warlick and others (this volume).<br />
lateral continuity of the unit in the Saluda and Zirconia<br />
quadrangles with the rocks in the Hendersonville, NC<br />
quadrangle (Garihan, 1999). Most transposition structures<br />
are found in the Henderson Gneiss, which is a biotite augen<br />
gneiss with a multitude of fabric forms (Warlick and others,<br />
this volume). Previous studies of the Henderson Gneiss<br />
interpreted it as part of the nonmigmatitic zone of the<br />
27<br />
Walhalla nappe (Griffin, 1978) or as part of the Chauga<br />
belt (Hatcher, 1972). Garihan (1999) also mapped the<br />
Sugarloaf Mountain thrust bringing the upper Mill Spring<br />
complex rocks over the Henderson Gneiss several<br />
quadrangles to the west and south; he described the thrust<br />
contact as folded. Garihan (personal communication, 2001)<br />
correlated the Sugarloaf Mountain thrust with the Seneca
fault (base of the Six Mile thrust sheet). Correlation of<br />
these two thrusts and their respective thrust sheets suggests<br />
that the Mill Spring complex is equivalent to the Tallulah<br />
Falls Formation (cf. Hatcher, 1993).<br />
Structural studies on Glassy Mountain are based on<br />
Griffin’s (1978) tectonic model involving a series of stacked<br />
fold nappes. Using Griffin’s model of recumbent fold<br />
geometry, Warlick and others (this volume) studied the<br />
distribution of vergence in asymmetric parasitic folds. They<br />
proposed that the Glassy Mountain area was also affected<br />
by recumbent and near-recumbent folding. Their analysis<br />
of parasitic fold vergence indicates that the nappe fold axis<br />
trends approximately N50°-70°E with a northwest vergence<br />
and that the early isoclinal fabric is disrupted by later<br />
oblique-slip faults. They recognized that transposition<br />
structures, which postdate these folds, were present in the<br />
augen gneiss units. The possible effects of transposition<br />
on their vergence studies were not addressed.<br />
The mesoscopic evidence for early isoclinal folding<br />
is nearly obliterated. Intact isoclinal folds are seldom<br />
recognized. The main foliation ranges from a compositional<br />
layering in the biotite gneisses to a mylonitic foliation. The<br />
nature of the compositional layering has not been<br />
investigated; however, the presence of rare intrafolial<br />
isoclines and fishhook folds of the compositional layering<br />
suggests a transposition origin for the layering. Another<br />
possibility is that layering resulted from in situ magmatic<br />
injections parallel to the foliation (cf. Lucas and St-Onge,<br />
1995).<br />
28<br />
Metamorphic studies by Davis (1993) indicate second<br />
sillimanite conditions (approximately 4 kb, 600° C) for parts<br />
of the Sugarloaf Mountain thrust sheet, which overlies the<br />
Henderson Gneiss. These elevated pressure and temperature<br />
conditions are more than sufficient to form ductile structures<br />
through crystal-plastic processes. The transposition<br />
structures found on Glassy Mountain and throughout the<br />
Piedmont are ductile structures.<br />
The effects of younger, brittle deformation are<br />
significant. Glassy Mountain lies within the Marietta-Tryon<br />
graben (Garihan and Ranson, 1992). Effects of Mesozoic<br />
crustal extension have rearranged the configuration of<br />
Paleozoic thrust traces along steeply dipping faults with<br />
histories of multiple movements. Retro-deforming the latest<br />
brittle structures would allow a more accurate reconstruction<br />
of the Paleozoic geometry of this area. Because the<br />
transposition structures exist at the mesoscopic scale, the<br />
brittle deformation probably affects their orientation but not<br />
their kinematic significance.<br />
TRANSPOSITION STRUCTURES<br />
Varieties of transposition structures, including a newly<br />
recognized form, are found on Glassy Mountain. The<br />
discussion here illustrates the spectrum of structures caused<br />
by transposition, analyzes the structures, suggests<br />
mechanisms for the formation of these structures, interprets<br />
the significance of individual structures and develops a<br />
tectonic model that illustrates past nappe kinematics.<br />
Locations of outcrops examined are shown in Figure 3.<br />
Figure 4. Intrafolial fold of remnant foliation (r) in Henderson augen Gneiss. Long limb (l) parallel to transposition plane (t). Pencil is approximately<br />
13.5 cm long. Location: GM-2.
Figure 5. Series of stacked recumbent folds in Henderson Gneiss. Bottom limbs are approximately parallel to transposition zone (t). Quarter for scale.<br />
Location: GM-1 (not on Glassy Mountain), Tigerville 7.5-minute quadrangle (UTM 0380067/3886108).<br />
Intrafolial folds or floating noses<br />
“Floating noses” is a term is used to describe remnants<br />
of tight to isoclinal folds that have been dismembered. Two<br />
varieties are commonly found. The first is a complete fold<br />
system: two hinges and three limbs (Figure 4). Typically,<br />
one or two limbs will lie parallel to the transposition foliation<br />
and the other limb (short limb in asymmetric fold) will lie<br />
at an angle. The more open the fold, the more angular some<br />
of the foliation relations between the dominant foliation<br />
(transposition foliation) and the remnant foliation direction.<br />
This can result in a composite foliation (see Foliation<br />
enclave discussion below; Tobisch and Paterson, 1988). The<br />
second variety involves a dismembered fold hinge with one<br />
long limb and a very small piece of the second limb. The<br />
result is an asymmetrical fishhook fold. These angular<br />
relationships are similar to many aspects of S-C fabrics and<br />
may suggest a more fundamental relation between S-C<br />
fabrics and transposition. Such folds can occur at the<br />
microscopic scale, and the occurrence of such folds suggests<br />
that transposition is nearly complete. Outcrop-scale<br />
foliation remnants can be a few centimeters to several meters<br />
wide.<br />
Stacked folds<br />
Stacked folds tend to be inclined to recumbent sets of<br />
folds. The space between fold axial surfaces is reduced, or<br />
appressed, by stacking and flattening (Figure 5). Several<br />
sets of folds are “piled” together, with no apparent plane of<br />
separation. At some stage of development, the set of “piled”<br />
folds is truncated parallel to one limb, and this truncation is<br />
a zone of transposition.<br />
29<br />
Foliation scallops<br />
Foliation scallops are a newly recognized variation of<br />
intrafolial folds. The structure occurs in layered anisotropic<br />
rocks where the axial traces of tight to isoclinal folds are<br />
nearly parallel to the strike of transposition foliation. The<br />
scalloping is caused by the transposition foliation dissecting<br />
wide intrafolial fold hinge zones of the early foliation, or<br />
compositional layering (Figure 6). The scallops are fold<br />
hinge zone remnants. This is an advanced stage of stacked<br />
folds, where transposition has continued. They are most<br />
noticeable when hinge zones are wide (1-10 cm) and the<br />
Figure 6. Schematic of foliation scallop based on observations on Glassy<br />
Mountain and other areas. Pavement view of fold hinge zones (f) truncated<br />
by transposition zones (t). Fold hinge zones have gentle to horizontal<br />
dips and are separated by transposition zones with steeper dips. Pencil is<br />
approximately 13 cm long.
Figure 7. Auschweichungsclivage (pseudo-crenulation cleavage) in<br />
Henderson Gneiss. Classic example of intrafolial folds separated by<br />
transposition zones. Pencil is approximately 13.5 cm long. Location:<br />
GM-2.<br />
hinge line nearly parallels the foliation strike. Weathering<br />
accentuates this effect of the layers lying between the<br />
transposition planes. Scallops are a type of tectonic striping,<br />
but instead of intersecting planar layers of fold limbs and<br />
developing a lineation, scallops are a 3-D intersection<br />
structure.<br />
30<br />
Pseudo-crenulation cleavage or ausweichungsclivage<br />
The mesoscopic structure is formed by zones of<br />
harmonic intrafolial folds, with both limbs present. The<br />
limbs curve into and merge with the transposition plane<br />
(Figure 7). This classic structure has aspects of a discrete<br />
crenulation cleavage: buckle folds of quartzo-feldspathic<br />
material (crenulations) abruptly truncated by M (mica)<br />
domains with an entirely new fabric not in the QF (quartzfeldspar)<br />
domains.<br />
Foliation enclaves and composite foliation<br />
The remnants of pretransposition folds and foliations<br />
are commonly aligned at an angle to the transposition<br />
foliation in the Henderson Gneiss. These remnants typically<br />
occur in small elliptical pods that are stretched out and<br />
surrounded by the main foliation planes. These enclaves<br />
may be millimeters to meters in length. In many places, it<br />
is possible to trace the earlier foliation plane, as defined by<br />
aligned minerals, into the transposition foliation direction<br />
(Figure 8). This indicates that the transposition foliation FI<br />
consists of some of the same fabric elements as the early<br />
foliation, which is interpreted to result from incomplete<br />
transposition. This is also the form of composite foliation<br />
(Tobisch and Paterson, 1988), where elements of earlier<br />
foliations, along with newly developed elements, constitute<br />
the main foliation.<br />
Transitional mylonitic/phyllonitic structures or<br />
umfaltungsclivage<br />
One of the more interesting features of transposition<br />
structures is their association with mylonitic and phyllonitic<br />
fabrics. Figure 9 shows porphyroclast relations in the<br />
Figure 8. Foliation enclave in Henderson Gneiss. Remnants of early fabric completely enclosed by transposition zones. Intrafolial folds no longer<br />
visible as transposition has completely removed them. Quarter for scale. Location: GM-2.
Figure 9. Umfaltungsclivage zones - transposition zones that have progressed into mylonitization zones. Sheared porphyroclasts in highly transposed<br />
and mylonitized zones both above and below early foliation enclave. Pencil is 14.3 cm long. Location: GM-2.<br />
transposition zones. The sense of shearing and the presence<br />
of dynamic recrystallization in this example, and the<br />
majority of other transposition zones found on Glassy<br />
Mountain, indicate mylonitization as the dominant process<br />
once the fold limbs were sheared. Bruno Sander described<br />
similar fabric relationships as umfaltungsclivage, especially<br />
as the amount of mylonitization increased relative to the<br />
preexisting fabric. These zones show grain-size reduction<br />
features, and they exhibit typical shear fabrics such as<br />
kinematic indicators indicative of high strain. On the<br />
mesoscopic scale, zones of transposed rock can be traced<br />
into parallel and strongly mylonitized layers. On Glassy<br />
Mountain, it is difficult to distinguish where transposition<br />
ends and mylonitization begins.<br />
Extensional crenulation cleavage<br />
At one location (GM-4, Figure 3), a spectacular<br />
example of large-scale extensional crenulation cleavage cuts<br />
through an outcrop also containing zones of auschweichungsclivage.<br />
A spaced cleavage tens of centimeters wide<br />
transects compositional layering in the augen gneiss. Lowamplitude,<br />
nearly symmetrical open buckles of the<br />
compositional layering have formed. The limbs of these<br />
buckles are thinned, and the ends are being dragged into<br />
the plane of the spaced cleavage. An 8-cm thick, competent<br />
pegmatitic or intrusive quartzo-feldspathic layer shows this<br />
transposition effect (Figure 10). This extensional fabric<br />
transposes the same early fabric as the buckle-style<br />
transposition structures. These two transposition surfaces<br />
appear to be coplanar, but at GM-4 the extensional cleavage<br />
surfaces are restricted to the limb of a mesoscopic fold.<br />
Motion on northeast-striking planes at GM-2 is tops down<br />
to the southeast, which is significantly different from the<br />
northwest-verging fold model proposed for the buckle<br />
transpositions and the thrust nappe system. These<br />
31<br />
orientations are considered to be largely unaffected by brittle<br />
deformation because they are consistent throughout the area.<br />
ANALYSIS OF STRUCTURES<br />
The previous descriptions of mesoscopic structures<br />
indicate that transposition processes have contributed to the<br />
development of the main foliation in the Henderson Gneiss,<br />
which postdates the augen-biotite foliation. In the<br />
Henderson Gneiss, it is significant that there appears to be<br />
an increase in strain intensity as the Sugarloaf Mountain<br />
thrust surface is approached (C. W. Clendenin, personal<br />
communication, 2001). This is evident through closer<br />
spacing of transposition zones, significant grain size<br />
reduction and the presence of mylonitic foliations.<br />
The presence of intrafolial folds indicates that preexisting<br />
S-surfaces were folded. In the case of the Henderson Gneiss,<br />
folds of the compositional layering occur between<br />
transposition planes. Commonly, the shearing along limbs<br />
has been so intense that the transposition foliation has<br />
proceeded towards a zone of mylonitization.<br />
The early stages of transposition involve a significant<br />
amount of shortening. The isoclinal folds are initiated<br />
through buckling. This folding is modeled as a simple shear<br />
phenomenon (Ghosh, 1966). As folding proceeds, the folds<br />
lock up and cease to tighten by buckling. At this stage,<br />
they begin to overturn in the shear direction (i.e. verge).<br />
The next stage in fold tightening is through flattening caused<br />
by the stacking of recumbent folds. The folds are appressed,<br />
and areas between folds are obliterated. Prior to the limbs<br />
being sheared out into the transposition foliation, several<br />
folds can be stacked on top of each other (Figure 4).<br />
Morphologically, crenulations and transposed folds are<br />
similar. Williams (1983) detailed the history of correlating<br />
compressive crenulation cleavage with transposition<br />
structures, but a formalized recognition of this relation has
Figure10. Zone of extensional crenulation cleavage (lower left) in Henderson Gneiss; gray layer is a buckled and extended quartzo-feld spathic layer.<br />
Cascading asymmetric foliation approximately parallel to buckle-style-crenulation transposition zones. Extension of foliation indicates tops to the<br />
southeast. Hammer is 40 cm long. Location: GM-4.<br />
never been made, although Williams (1983) alluded to it.<br />
The lack of a formal terminology is probably because<br />
compressive crenulation cleavage has been exclusively<br />
ascribed to buckling instabilities in anisotropic rocks,<br />
whereas transposition is described as a shearing<br />
phenomenon. As mentioned, Heim (cited in E. Knopf, 1931)<br />
first used the term “ausweichungsclivage” to describe a slip<br />
cleavage that transposes an S-surface, which would make it<br />
a passive slip mechanism. Gray (1980) has demonstrated<br />
that passive slip is not a valid mechanism for crenulation<br />
formation. Experimental and theoretical studies indicate<br />
that shortening through layer parallel strain and layer<br />
buckling are significant in the formation of both structures<br />
(cf. Ghosh, 1966, Cosgrove, 1976, Rowan and Kligfield,<br />
1992). A distinguishing characteristic between crenulations<br />
and transposition may be absent; they are genetically and<br />
morphologically similar. Crenulation cleavage could be an<br />
32<br />
early stage structure prior to the development of<br />
transposition. The contribution of recrystallization and new<br />
mineral growth in the formation of a new foliation is a point<br />
of debate. Sander’s term “umfaltungsclivage” specifically<br />
precludes neomineralization during transposition; however,<br />
Mawer and Williams (1991) considered neocrystallization<br />
to be an important component of cyclic transposition.<br />
The angle between the early and later transposition<br />
foliation primarily depends on the original orientation of<br />
the early foliation to the boundaries of the transposition<br />
foliation. As demonstrated by Rajlich (1993), nearly<br />
perpendicular relations can lead to high-angle enclaves, and<br />
oblique angles will lead to angular relations that are nearly<br />
coincident with the transposition foliation. Ultimately, it<br />
may become difficult to ascertain the presence of<br />
transposition, because angular differences between the<br />
original foliation and the transposition foliation no longer
exist. Transposition homogenizes all preexisting fabric<br />
elements. Therefore, the presence of intrafolial folds,<br />
regardless of scale, may be the only clue that transposition<br />
has occurred. The angular relationships between the two<br />
foliations may prove useful as a kinematic indicator, similar<br />
to the use of S-C fabrics and shear bands in mylonitic rocks.<br />
E. B. Knopf (1931) also described the association of<br />
mylonitization and sheared out folds. The common relation<br />
is for the long limbs of intrafolial folds to taper off parallel<br />
to the transposition foliation and exhibit grain-size reduction<br />
of the quartzo-feldspathic component. Sander’s (cited in<br />
E. B. Knopf, 1931) description of umfaltungsclivage as a<br />
structure that is completely transposed is, therefore,<br />
pertinent. Theoretically, if this were the case, then all that<br />
should remain is a mylonitic fabric. In support of this, on<br />
Glassy Mountain several localities were found where the<br />
intermediate foliation enclaves are surrounded by thick<br />
zones of mylonitic augen gneiss.<br />
Yassaghi and others (2000) also described the relation<br />
between transposition and mylonitization. They noted a<br />
close spatial relation, where mylonitic rocks grade into<br />
transposed zones. These observations suggest a continuum<br />
and a partitioning of deformation concentrated in the limb<br />
areas of folds.<br />
Collectively, the transposition structures described here<br />
suggest at least one complete transposition cycle (cf. Tobisch<br />
and Paterson, 1988). This cycle starts with simple shear<br />
buckling of an original layering (?) that proceeds through a<br />
stage of isoclinal folding. As the fold limbs rotate into the<br />
shear plane, the limbs are sheared out, defining the new<br />
transposition foliation. As folds are stacked and limbs begin<br />
to shear out, discrete zones of folds (crenulations?) are<br />
isolated between the transposition surfaces. This was<br />
originally recognized as ausweichungsclivage. As shearing<br />
continued in the transposition surface, folds were obliterated<br />
to the point where only remnant layers at an angle to the<br />
transposition surface are left. These are recognized as<br />
foliation enclaves and composite foliations. The final stage<br />
of transposition occurs as the zones widen, completely<br />
imposing the new fabric orientation on all previous elements.<br />
This constitutes Sander’s umfaltungsclivage, and it is the<br />
final stage of a transposition cycle. Importantly, however,<br />
transposition cycles do not necessarily finish before they<br />
start again. Overall, transposition is a way of<br />
accommodating a large amount of shortening through<br />
folding and mylonitization. Ramsay and others (1983)<br />
recognized similar processes in the lower Helvetic nappes<br />
of Switzerland.<br />
On Glassy Mountain, transposition foliations in the<br />
Henderson Gneiss can be found merging or grading into<br />
parallel zones of mylonitization. These transitions suggest<br />
a genetic relation between the two. These zones are similar<br />
to Sander’s umfaltungsclivage, and they suggest that once<br />
transposition reorients a surface it does not stop there. Once<br />
a surface is transposed, it continues to shear along the new<br />
foliation plane. A change in the stress field or a perturbation<br />
33<br />
in the surface could lead to the development of another fold<br />
set, and another cycle of transposition could begin. Under<br />
the appropriate pressure and temperature conditions, this<br />
shearing should naturally lead to processes of mylonitization<br />
and phyllonitization, depending on original rock<br />
composition.<br />
The most interesting transposition structures on Glassy<br />
Mountain are the large-scale extensional crenulation<br />
cleavages found at location GM-4. This location is just<br />
below the Sugarloaf Mountain thrust contact (approximately<br />
16 m) in the Henderson Gneiss. The occurrence of an<br />
extensional crenulation cleavage system approximately<br />
parallel to what is interpreted as a simple shear buckling<br />
system (the compressive transposition foliation) is difficult<br />
to explain, but three scenarios can be envisioned.<br />
(1) The structures are not contemporaneous. Just<br />
as in a transposition cycle, not all adjacent structures are<br />
the same age, nor do all similar structures form at the same<br />
time. These extensional structures are later (younger) than<br />
the main compressive transposition structures, which<br />
probably formed contemporaneously with the northwestverging<br />
folds. The down-to-the-southeast direction of the<br />
extensional crenulation cleavages is associated with the<br />
upper limb of a nappe system (fold or thrust). During the<br />
spreading phase of nappe emplacement, the back portion<br />
of a nappe undergoes extension. These extensional<br />
structures are part of an extensional and collapse phase.<br />
They are related to the nappe emplacement, but are late<br />
kinematic. Visual analysis of the mineral assemblages in<br />
these two different transposition zones indicates that they<br />
contain similar minerals. The apparent similarity of mineral<br />
assemblages supports a contemporaneous origin.<br />
(2) Alternatively, these extensional structures<br />
developed during a reversal of the stress field, and they<br />
reflect the effects of a localized change in the instantaneous<br />
strain field. The distribution and orientation of these<br />
extensional structures would have to be considered in a<br />
larger context to fully address this question. Such a solution<br />
would also have to address why these two foliations are<br />
essentially coplanar.<br />
(3) Finally, as a corollary of the first idea, Dennis<br />
(1991) presented an idea that the central Piedmont suture<br />
might be a low-angle detachment fault, analogous to lowangle<br />
normal faulting that exhumes metamorphic core<br />
complexes in the western United States. He proposed that<br />
this fault might reach back to the “Chauga belt,” to which<br />
the Henderson Gneiss is traditionally assigned. Although<br />
this is an interesting idea, the location of one small zone of<br />
extension does not locate the major fault plane. Additionally,<br />
if the fault were a normal fault, on Glassy Mountain it would<br />
place higher-grade metamorphic rocks on top of lower-grade<br />
rocks (Sugarloaf Mountain thrust sheet on top of Tumblebug<br />
Creek thrust sheet, or, more traditionally, Six Mile nappe<br />
on top of non-migmatitic Wahalla nappe). This juxtaposition<br />
of high-grade rocks on low-grade rocks is not characteristic<br />
of denudational (normal) faults.
SUMMARY<br />
Varieties of transposition structures are recognized in<br />
the Henderson Gneiss on Glassy Mountain. Individual<br />
structures represent stages in the development process of<br />
transposition. A more comprehensive definition of<br />
transposition is proposed that accounts for its progressive<br />
nature. In its early stages, transposition involves shearbuckle<br />
folding, but later stages in a cycle do not have to<br />
start a new fold system (however, they may). In the internal<br />
portions of an orogen, transposition zones in the advanced<br />
stages of development can develop into zones of<br />
mylonitization. Because of the elevated pressure and<br />
temperature conditions, processes of dynamic<br />
recrystallization dominate in the shear planes developed<br />
during transposition. On Glassy Mountain it is possible to<br />
recognize at least one complete transposition cycle, from<br />
initial isoclinal folding, through alignment of fold limbs in<br />
the shear plane, to a final stage of mylonitization coaxial<br />
with the transposition surface. This final stage has<br />
progressed significantly so that the major foliation has a<br />
dominantly mylonitic fabric.<br />
ACKNOWLEDGEMENTS<br />
I thank Cameron Warlick for first showing me these<br />
structures on Glassy Mountain, and for a preprint of his<br />
geologic map and report of Glassy Mountain. Discussions<br />
in the field with C. W. Clendenin (South <strong>Carolina</strong> <strong>Geological</strong><br />
Survey) and J. M. Garihan (Furman University) significantly<br />
improved my understanding of the geologic framework of<br />
this area. Constructive reviews by Garihan and D. P.<br />
Lawrence provided helpful suggestions for its improvement.<br />
Support for this study was provided by the South <strong>Carolina</strong><br />
Department of Natural Resources – <strong>Geological</strong> Survey.<br />
REFERENCES<br />
Cosgrove, 1976, The formation of crenulation cleavage:<br />
Journal of the <strong>Geological</strong> <strong>Society</strong> of London, v. 132,<br />
p. 155-178.<br />
Davis, T. L., 1993, Geology of the Columbus Promontory,<br />
western Piedmont, North <strong>Carolina</strong>, southern<br />
Appalachians, in T. L. Davis and R. D. Hatcher, Jr.<br />
(editors), Studies of Inner Piedmont geology with a focus<br />
on the Columbus Promontory: <strong>Carolina</strong> <strong>Geological</strong><br />
<strong>Society</strong> Field Trip Guidebook, 1993, p. 17-43.<br />
Dennis, A. J., 1991, Is the central Piedmont suture a low<br />
angle normal fault?: Geology, v. 19, p. 1081-1084.<br />
Drake, A. A., Jr., 1980, The Taconides, Acadides, and<br />
Alleghenides in the central Appalachians, in D. R. Wones<br />
(editor), The Caledonides in the USA, Proceedings,<br />
IGCP Project 27-Caledonide Orogen, 1979 Meeting:<br />
Blacksburg, Virginia Polytechnic Institute and State<br />
University Memoir 2, p. 179-187.<br />
34<br />
Garihan, J. M., 1999, The Sugarloaf Mountian thrust in the<br />
western Inner Piedmont between Zirconia, North<br />
<strong>Carolina</strong> and Pumpkintown, South <strong>Carolina</strong>, in A Compendium<br />
of Selected Field Guides: <strong>Geological</strong> <strong>Society</strong><br />
of America, Southeastern Section meeting, p.22-39.<br />
Garihan, J. M., and W. A.Ranson, 1992, Structure of the<br />
Mesozoic Marietta-Tryon graben, South <strong>Carolina</strong> and<br />
adjacent North <strong>Carolina</strong>, in M. J. Bartholomew, D.<br />
W.Hyndman, and R. Mason (editors), Basement<br />
Tectonics 8: Characterization and Comparison of<br />
Ancient and Mesozoic Continental Margins:<br />
Proceedings of the Eighth International Conference on<br />
Basement Tectonics, Kluwer Academic Publishers,<br />
Dordrecht, p. 539-555.<br />
Griffin, V. S., Jr., 1978, Detailed analysis of tectonic levels<br />
in the Appalachian Piedmont: Geologische Rundschau,<br />
v. 67, p. 180-201.<br />
Ghosh, S.K., 1966, Experimental tests of buckling folds in<br />
relation to strain ellipsoid in simple shear deformations:<br />
Tectonophysics, v. 32, p. 169-185.<br />
Hatcher, R. D., Jr., 1972, Developmental model for the<br />
southern Appalachians: <strong>Geological</strong> <strong>Society</strong> of America<br />
Bulletin, v. 83, p. 2735-2760.<br />
Hatcher, R. D., Jr., 1993, Perspective on the tectonics of the<br />
Inner Piedmont, southern Appalachians, in T. L. Davis<br />
and R. D. Hatcher, Jr. (editors), Studies of Inner<br />
Piedmont geology with a focus on the Columbus<br />
Promontory: <strong>Carolina</strong> <strong>Geological</strong> <strong>Society</strong> Field Trip<br />
Guidebook, 1993, p. 1-16.<br />
Hatcher, R. D., Jr., 1998, Geologic map of the northern part<br />
of the Appalachian Inner Piedmont: University of<br />
Tennessee Department of <strong>Geological</strong> Sciences, Studies<br />
in Geology, Special Map Publication Series no. 5, scale<br />
1:316,800.<br />
Horton, J. W., Jr., and K. I. McConnell, 1991, The western<br />
Piedmont, in J. W. Horton, Jr. and V. A. Zullo (editors),<br />
The Geology of the <strong>Carolina</strong>s: Knoxville, Tennessee,<br />
The University of Tennessee Press, p. 36-58.<br />
Knopf, E. B., 1931, Retrogressive metamorphism and<br />
phyllonitization: American Journal of Science, fifth<br />
series, v. 21, p. 1-27.<br />
Knopf, E. B., and E. Ingerson, 1938, Structural petrology:<br />
<strong>Geological</strong> <strong>Society</strong> of America Memoir, no. 6, 270 p.<br />
Lemmon, R. E., 1973, Geology of the Bat Cave and<br />
Fruitland quadrangles and the origin of the Henderson<br />
Gneiss, western North <strong>Carolina</strong> [Ph. D. dissertation]:<br />
Chapel Hill, University of North <strong>Carolina</strong>, 145 p.<br />
Lucas, S. B., and M. R. St-Onge, 1995, Syn-tectonic<br />
magmatism and the development of compositional<br />
layering, Ungava Orogen (northern Quebec, Canada):<br />
Journal of Structural Geology, v. 17, p. 475-491.<br />
Mawer, C. K., and P. F. Williams, 1991, Progressive folding<br />
and foliation development in a sheared, coticule-bearing<br />
phyllite: Journal of Structural geology, v. 13, p. 539-<br />
555.
Rajlich, P., 1993, Riedel shear: a mechanism for crenulation<br />
cleavage: Earth-Science Reviews, v. 34, p. 167-195.<br />
Ramsay, J. G., M. Casey, and R. Kligfield, 1983, Role of<br />
shear in development of the Helvetic fold-thrust belt of<br />
Switzerland, Geology, v. 11, p. 439-442.<br />
Rowan, M. G., and R. Kligfield, 1992, Kinematics of largescale<br />
asymmetric buckle folds in overthrust shear: an<br />
example from the Helvetic nappes in K. R. McClay<br />
(editor), Thrust Tectonics: Chapman and Hall, New<br />
York, p. 165-173.<br />
Stanley, R. S., and N. M. Ratcliffe, 1985, Tectonic synthesis<br />
of the Taconian orogeny in western New England:<br />
<strong>Geological</strong> <strong>Society</strong> of America Bulletin, v. 96, p. 1227-<br />
1250.<br />
Tobisch, O. T., and S. R. Paterson, 1988, Analysis and<br />
interpretation of composite foliations in areas of<br />
progressive deformation: Journal of Structural Geology,<br />
v. 10, p. 745-754.<br />
Warlick, C. M., C. W. Clendenin, and J. W. Castle, 2001,<br />
Geology of The Cliffs at Glassy development, southern<br />
Saluda 7.5-minute quadrangle, Greenville County, South<br />
<strong>Carolina</strong>: South <strong>Carolina</strong> Geology, v. 43, this volume.<br />
35<br />
Williams, P. F., 1983, Large scale transposition by folding<br />
in northern Norway: Geologische Rundschau, v. 72, p.<br />
589-604.<br />
Yanagihara, G. M., 1993, Evolution of folds associated with<br />
D2 and D3 deformation and their relationship<br />
withshearing in a part of the Columbus Promontory,<br />
North <strong>Carolina</strong>, in T. L. Davis and R. D. Hatcher, Jr.<br />
(editors), Studies of Inner Piedmont geology with a<br />
focus on the Columbus Promontory: <strong>Carolina</strong><br />
<strong>Geological</strong> <strong>Society</strong> Field Trip Guidebook, 1993, p. 45<br />
53.<br />
Yassaghi, A., P. R. James, and T. Flottmann, 2000,<br />
Geometric and kinematic evolution of asymmetric<br />
ductile shear zones in thrust sheets, southern Adelaide<br />
Fold-Thrust Belt, South Australia: Journal of Structural<br />
Geology, v. 22, p. 889-912.
South <strong>Carolina</strong> Geology, 2001, v. 32, p. 37 - 47.<br />
<strong>GEOLOGY</strong> OF THE CLIFFS AT GLASSY DEVELOPMENT, <strong>SOUTH</strong>ERN<br />
SALUDA 7.5-MINUTE QUADRANGLE, GREENVILLE COUNTY, <strong>SOUTH</strong><br />
<strong>CAROLINA</strong><br />
CAMERON M. WARLICK, Department of <strong>Geological</strong> Sciences, Box 340976, Clemson University,<br />
Clemson, SC 29634-0976,<br />
C. W. CLENDENIN, South <strong>Carolina</strong> Department of Natural Resources-<strong>Geological</strong> Survey, 5 Geology<br />
Road, Columbia, South <strong>Carolina</strong> 29210, and<br />
JAMES W. CASTLE, Department of <strong>Geological</strong> Sciences, Box 340976,Clemson University, Clemson,<br />
SC 29634-0976<br />
ABSTRACT<br />
Part of the southern Columbus Promontory, within the Inner Piedmont Subprovince, was mapped in the vicinity of<br />
The Cliffs at Glassy, a major residential development on Glassy Mountain, Greenville County, South <strong>Carolina</strong>. The map<br />
area is within the Saluda 7.5-minute quadrangle, and mapping shows that lithostratigraphic and structural relations within<br />
the Columbus Promontory are more complex than previously recognized. Three principal lithostratigraphic units crop out<br />
in the area: the Henderson Gneiss, upper Mill Spring complex and Poor Mountain Formation. The contact between the<br />
Henderson Gneiss and the overlying, upper Mill Spring complex – Poor Mountain Formation sequence is a thrust contact,<br />
which is mapped as the Sugarloaf Mountain thrust. Toward the fault contact, the underlying Henderson Gneiss exhibits<br />
extreme grain-size reduction; the fault is mapped at the top of a layer of mylonitic gneiss that is overlain by relatively<br />
undeformed, porphyroblastic, granitoid gneiss. The contact between the upper Mill Spring complex and the overlying<br />
Poor Mountain Formation is also a thrust contact. Fold vergence and thrust contacts indicate that the upper Mill Spring<br />
complex and the Poor Mountain Formation are both overturned and non-conformable.<br />
Three periods of oblique-slip brittle faulting are recognized in The Cliffs at Glassy. The initial period is defined by<br />
pods of silicified cataclasite, whereas younger periods of left- and right-oblique-slip brittle faulting are unsilicified. The<br />
identification of down-to-the-south faulting along the south face of Glassy Mountain implies that an east-northeast-trending<br />
branch of the Marietta-Tryon graben may be present between Glassy Mountain and Pax Mountain.<br />
INTRODUCTION<br />
Although the Inner Piedmont Subprovince of the<br />
Piedmont Province has been studied extensively, its<br />
deformational history has not been fully deciphered. One<br />
problem is that few detailed, large-scale geologic maps of<br />
the region have been completed. As more map information<br />
becomes available, subtle complexities will be recognized<br />
and placed into a regional context.<br />
The focus of our study is the Glassy Mountain area,<br />
which lies on the southern margin of the Columbus<br />
Promontory in Greenville County, South <strong>Carolina</strong> and is<br />
within the southern half of the Saluda 7.5-minute<br />
quadrangle (Figure 1). Previous studies show that the<br />
deformational history of the Inner Piedmont is complicated<br />
by a fold-nappe stack (Griffin, 1978), by Paleozoic<br />
polyphase deformation (Hatcher, 1989) and by younger<br />
brittle faulting (Garihan and others, 1990). Within the Inner<br />
Piedmont, these three superimposed relations are known<br />
to occur within the Columbus Promontory (Davis, 1993).<br />
Originally termed the Hendersonville Bulge by Hack<br />
(1982), the Columbus Promontory extends 40 km southeast<br />
of the Brevard Fault Zone and is defined by a southeastward<br />
protrusion of the Blue Ridge Escarpment. In a regional study<br />
37<br />
of the Columbus Promontory, Davis (1993) mapped and<br />
compiled the geology of the quadrangles in North <strong>Carolina</strong><br />
as far south as the South <strong>Carolina</strong> state line (Figure 1).<br />
Glassy Mountain is currently being developed as The<br />
Cliffs at Glassy, which will eventually include more than<br />
800 residences as well as an 18-hole golf facility. As a result,<br />
the Blue Ridge Rural Water Company, which is responsible<br />
for providing water to the development, recognized that an<br />
understanding of the geologic framework is fundamental<br />
for locating additional groundwater resources. The purposes<br />
of our field study were to establish the lithostratigraphic<br />
and structural relations found in The Cliffs at Glassy and to<br />
decipher those relations based on comparisons with the<br />
surrounding area. Those findings are now being applied to<br />
groundwater exploration, and the results will be reported<br />
in a companion paper.<br />
Although geologic mapping has been or is being<br />
conducted at 1:24,000 to the north, south, and west of The<br />
Cliffs of Glassy, the southern half of Saluda 7.5-minute<br />
quadrangle had not been mapped in detail and preserved<br />
relations were unknown. Because The Cliffs of Glassy was<br />
separated from previously mapped areas, known map units<br />
could not be extended directly from adjoining areas. To
Figure 1. Regional map showing the 7.5-minute quadrangles that cover the Columbus Promontory. The hachured pattern outlines The Cliffs at<br />
Glassy in Saluda 7.5-minute quadrangle. Faults that make up the Marietta-Tryon and Pax Mountain fault systems are shown (modified after Garihan<br />
and others, 1990).<br />
avoid correlation errors, the area was first mapped and then<br />
interpreted using known relations. The information in this<br />
paper on The Cliffs of Glassy is presented in that fashion,<br />
and observations from specific locations are described.<br />
MAPPING APPROACH<br />
Quantitative field mapping was conducted, and<br />
observation sites were located with GPS control and the<br />
observation sites were transferred onto the 1983 provisional<br />
topographic map of Saluda 7.5-minute quadrangle. Access<br />
to The Cliffs at Glassy is via an extensive, new residential<br />
road system, which provides numerous exposures from<br />
South <strong>Carolina</strong> Highway 11 northward to Rich Mountain<br />
(Figure 2). Many of the field observations were made from<br />
those exposures. Mapping was confined to the area south<br />
of the Greenville Watershed property line.<br />
Mapping follows Griffin’s (1978) interpretation that the<br />
Inner Piedmont is characterized by a northwest-vergent,<br />
fold-nappe stack. Accurate mapping of lithostratigraphic<br />
relationships within such an area is dependent on whether<br />
the sequence is interpreted as upright or overturned. We<br />
38<br />
attempted to document fold vergence in each exposure that<br />
was mapped, in order to determine lithostratigraphic facing.<br />
Vergence, as used in this study, refers to the horizontal<br />
direction of movement toward which the upper component<br />
of rotation is directed when a fold is viewed in profile (Bell,<br />
1981). Bell (1981, p. 198) stated: “This definition has the<br />
advantage over descriptions of fold asymmetry as ‘S’- or<br />
‘Z’-shaped, or ‘sinistral or dextral’, in that the vergence is<br />
independent of fold plunge variations.” Observations of<br />
mesoscopic fold vergence were used to determine whether<br />
units are upright or overturned with respect to the northwestvergent,<br />
recumbent-fold model of Griffin (1978).<br />
FIELD OBSERVATIONS<br />
Six mappable lithologies are recognized in The Cliffs<br />
at Glassy. The most prevalent is biotite augen gneiss (augen<br />
gneiss), which is well exposed in road cuts along South<br />
<strong>Carolina</strong> Highway 11 at lower elevations on the southern<br />
slopes of Glassy Mountain. This lithology is composed of<br />
biotite, quartz, and feldspar; the unit is dark gray to black<br />
because of its high biotite content. The color and the
The Cliffs at Glassy<br />
presence of augen distinguish the augen gneiss from other<br />
gneisses on the mountain. The augen, up to 4 cm in length,<br />
are predominantly microcline with occasional quartz<br />
envelopes, and they occur within and concordant with<br />
foliation.<br />
At Location 1 (Figure 3), augen gneiss is deformed<br />
into an L-tectonite marked by a west- directed pervasive<br />
lineation without penetrative foliation. A line of sight<br />
39<br />
perpendicular to lineation shows northwest-vergent folds<br />
with thickened noses and attenuated limbs. The folds may<br />
be rootless and bound by transposition shear planes. This<br />
fold style and vergence are commonly observed in the augen<br />
gneiss.<br />
At Location 2, road construction has produced an<br />
extensive south-facing exposure. Rootless, recumbent<br />
isoclinal folds and disharmonic folds are exposed within
the augen gneiss at this location (Figures 3 and 4). The augen<br />
gneiss also shows grain-size reduction upward into a layer<br />
of finely crystalline mylonitic gneiss near the top of the<br />
exposure. This mylonitic gneiss layer cuts foliation at a<br />
shallow angle below a grassy slope above the exposure.<br />
Subvertical fault planes cut the entire exposure at the west<br />
end of this roadcut. Slickenside orientations and chatter<br />
marks on the subvertical fault planes (N68 o E, 69 o N) indicate<br />
right-lateral, down-to-the-north motion. These right-lateral<br />
faults offset E-W-striking faults with down-to-the-south<br />
slickenside orientations and chatter marks (Figure 5).<br />
Mapping in the immediate area shows that the southern slope<br />
of the mountain is cut by multiple, subparallel faults and<br />
fault zones (Figure 2). These fault zones strike N50 o E to<br />
40<br />
N80 o E, are roughly parallel to the southern escarpment and<br />
are commonly marked by springs.<br />
To the west, at Location 3 (Figure 3), grain size is<br />
reduced over a relatively small vertical distance (~25 m) in<br />
the augen gneiss. The increasingly sheared and flattened,<br />
augen fabric indicates that deformation increases upward.<br />
Progressive shearing has deformed the augen gneiss, at the<br />
base of the exposure, to a finely crystalline, mylonitic gneiss<br />
at the top of the exposure. A thin, weathered pegmatite marks<br />
the top of the mylonitic gneiss layer in the overlying grassy<br />
slope.<br />
Similarly, augen gneiss displays progressive shearing<br />
and grain-size reduction uphill along an access road at<br />
Location 4 (Figure 3), where mylonitic gneiss overlies
sheared augen gneiss. The layer of mylonitic gneiss at<br />
Location 4 ends abruptly in a series of N55 o E- to N60 o Estriking,<br />
subvertical faults; chatter marks on these faults<br />
indicate left-lateral, down-to-the-south motion. Less<br />
deformed augen gneiss is exposed to the north of these<br />
faults. A short distance uphill, augen gneiss again displays<br />
41<br />
progressive shearing and grain-size reduction. Porphyroblastic<br />
granitoid gneiss is exposed above a mylonitic gneiss<br />
layer, which overlies sheared augen gneiss.<br />
At Location 5, in the eastern reaches of The Cliffs at<br />
Glassy (Figure 3), augen gneiss again displays disharmonic<br />
folding and upward grain-size reduction. At the east end of
this approximately 30-m-long exposure, the augen gneiss<br />
has a gentle southeast-dipping foliation (N18 o W, 10 o E).<br />
Halfway across the exposure, the foliation steepens and rolls<br />
into a near-vertical (N20 o W, 70 o E) orientation. West-vergent<br />
monoclinic folds flatten as the foliation steepens. The<br />
overlying mylonitic gneiss layer is subvertical to overturned<br />
at the west the end of the exposure. Granitoid gneiss overlies<br />
the mylonitic gneiss and crops out immediately to the west<br />
of the exposure. Spatial relations between these features<br />
define a macroscopic, west-vergent, inclined fold.<br />
Granitoid gneiss or biotite gneiss of variable thickness<br />
overlies augen gneiss throughout The Cliffs at Glassy.<br />
Granitoid gneiss is medium- to coarsely crystalline, is light<br />
gray to buff white and is locally porphyroblastic. This gneiss<br />
can be differentiated from the underlying augen gneiss by<br />
its lighter color, lower biotite content and discordant<br />
orientation of porphyroblasts relative to foliation.<br />
Porphyroblasts are 2 to 5 cm in diameter and are composed<br />
of feldspar and quartz. Granitoid gneiss forms the<br />
pronounced balds and cliffs on the southern face of Glassy<br />
Mountain. Biotite gneiss overlies granitoid gneiss on many<br />
peaks in the western part of The Cliffs at Glassy, such as<br />
Bryant Mountain (Figure 2). When compared to granitoid<br />
gneiss, biotite gneiss is generally darker, is more finely<br />
crystalline, has alternating quarto-feldspathic and biotiterich<br />
layers to 4 cm thick and commonly lacks feldspar<br />
porphyroblasts. Biotite gneiss also contains pods of calcsilicate<br />
rock and sparse, thin amphibolite layers. The<br />
amphibolite layers appear to occur in nearly the same<br />
stratigraphic position when traced laterally and are<br />
considered marker horizons within the biotite gneiss.<br />
At Location 6, the geologic relationship between the<br />
two gneissic lithologies is defined where granitoid gneiss<br />
is clearly intrusive into biotite gneiss (Figures 3 and 6). No<br />
such intrusive relations have been recognized in the<br />
underlying augen gneiss within The Cliffs of Glassy area.<br />
At Location 7, granitoid gneiss is in fault contact with the<br />
biotite gneiss. Comparison of Locations 6 and 7 suggests a<br />
42<br />
down-to-the-north motion on the fault. At Location 8,<br />
immediately southeast of Rich Mountain, biotite gneiss is<br />
deformed into a series of mesoscopic, east-vergent folds<br />
(Figure 7). The folds are rooted, and fold noses are only<br />
slightly thickened as compared to limbs. We consider these<br />
folds as the most spectacular within the rocks of The Cliffs<br />
at Glassy.<br />
Lithostratigraphic relationships change abruptly to the<br />
north of the Clubhouse onto Rich Mountain (Figures 2 and<br />
3). At Location 9, amphibolite associated with mica schist<br />
is found to the north of a subvertical fault. At Location 10,<br />
amphibolite to the east abuts biotite gneiss with calc-silicate<br />
rock to the west along the road. The amphibolite is medium<br />
to dark gray and has faint quartzofeldspathic layering. Small,<br />
mesoscopic, east-vergent folds can be seen where such<br />
layers are thicker (Figure 8) and where the rock has a<br />
pronounced gneissic texture.<br />
Directly to the northeast at Location 11 (Figures 2 and<br />
3), mica schist overlies amphibolite. Thin layers of quartzite<br />
occur in the mica schist. At this location, the hinge of a<br />
west-vergent inclined fold is exposed in an unpaved section<br />
of the road, and laminated amphibolite crops out above the<br />
mica schist in the grassy slope. At Location 12, the folded<br />
sequence of mica schist and amphibolite ends abruptly at<br />
another northeast-striking, subvertical fault. Across this<br />
fault, biotite gneiss is again exposed.<br />
At Location 13 (Figure 3), west-northwest-vergent<br />
thrusts cut the biotite gneiss. Thrusting is defined by an<br />
abrupt change in foliation; foliation orientations in the<br />
hanging wall are steep (~50 o N) relative to nearly horizontal<br />
foliations in the underlying footwall. Thrust planes may be<br />
rehealed by aplite (Figure 9). Thrusting at this location has<br />
emplaced biotite gneiss over biotite gneiss. Amphibolite<br />
crops out in the grassy slope above the juxtaposed layers of<br />
biotite gneiss. At Location 14, this faulted sequence ends<br />
against another northeast-striking, subvertical fault. Across<br />
this fault, biotite gneiss is overlain by mica schist;<br />
amphibolite is again exposed above and to the west of the
mica schist. At Location 15, that sequence also ends abruptly<br />
at another northeast-striking, subvertical fault. Across this<br />
fault, laminated amphibolite overlies biotite gneiss. At<br />
Location 16, thin quartzofeldspathic layers in the<br />
amphibolite display small mesoscopic, east-vergent folds<br />
(Figure 8). It should be noted that, when two of the three<br />
other fault-bounded sequences of mica schist and<br />
amphibolite described above are traced westward, each<br />
sequence appears to be juxtaposed horizontally with biotite<br />
gneiss. The fourth sequence lies on top of Rich Mountain,<br />
and relations with biotite gneiss to the west are<br />
indeterminate.<br />
Fault relations are also exposed in the western part of<br />
The Cliffs at Glassy. At Location 17 (Figures 2 and 3), pods<br />
of silicified cataclasite are present in the biotite gneiss. These<br />
pods can be traced northeast to other silicified pods near<br />
the Clubhouse. The projected trend of the pods was used to<br />
define the previously mapped Hogback Mountain fault that<br />
is interpreted to have down-to-the-north, left-lateral motion<br />
(Garihan and others, 1990).<br />
Our mapping shows that two unsilicified faults also<br />
occur at Location 17 (Figure 3), with one of the faults south<br />
of the silicified pod and the other to the north. The<br />
orientation of the fault south of the silicified pod is N28 o E<br />
and subvertical; offset on the biotite gneiss-granitoid gneiss<br />
contact indicates left-lateral slip. A second fault (N67 o E,<br />
85 o N) offsets both the previously described fault and the<br />
silicified cataclasite right-laterally. The amphibolite marker<br />
at this location is also offset right-laterally along this fault,<br />
and differences in elevation of the marker suggest downto-the-south<br />
motion. To the north, on Bryant Mountain at<br />
Location 18, another down-to-the-south, right-lateral fault<br />
offsets the amphibolite marker. At Location 19, a third downto-the-south<br />
fault offsets both the biotite gneiss – granitoid<br />
gneiss contact and the amphibolite marker by more than 30<br />
meters.<br />
To the east at Location 20 (Figures 2 and 3), one of the<br />
43<br />
Bryant Mountain faults is exposed in a north-south roadcut.<br />
In this case, the exposure shows that a mapped fault may<br />
consist of a set of eight or more inline fault strands (Figure<br />
10). These inline strands strike N55 o E to N80 o E and dip<br />
75 o + both north and south. The principal fault in this set is<br />
located in a small hollow next to the exposure and is marked<br />
by a spring. This structural style of multiple inline faults,<br />
which are mapped as a single fault, was first recognized at<br />
Location 2.<br />
DISCUSSION<br />
Geologic relationships<br />
Integration of our field observations with previously<br />
described regional relationships shows both similarities and<br />
marked differences. Griffin (1974, 1978) defined the Inner<br />
Piedmont as a composite stack of northwestward-vergent<br />
fold-nappes composed of metamorphic rocks and igneous<br />
intrusions of various ages. Hatcher (1993) pointed out that<br />
this interpretation, after having been scrutinized for many<br />
years, appears to be correct. From north to south, the foldnappe<br />
stack, as originally defined by Griffin (1974, 1978),<br />
consists of the Non-migmatic belt, the Walhalla nappe, the<br />
Six-Mile nappe, the Star nappe, and the Southeast Flank<br />
(Griffin, 1978). Griffin (1974) proposed ‘tectonic slides’ or<br />
thrusts as the boundaries between nappes. Nelson and others<br />
(1998) subsequently modified Griffin’s designations; and<br />
the names Chauga belt, Walhalla nappe, Six Mile nappe,<br />
Paris Mountain thrust sheet and Laurens thrust sheet are<br />
currently used by Inner Piedmont geologists.<br />
In his study of the Columbus Promontory, Davis (1993)<br />
applied the names Chauga belt and Walhalla nappe to<br />
different rock packages, and he interpreted more detailed<br />
lithostratigraphic and structural relations within these<br />
delineated nappes. The three major lithostratigraphic units<br />
defined within the Columbus Promontory are the Henderson<br />
Gneiss, Mill Spring complex and Poor Mountain Formation.<br />
Davis (1993) found the stratigraphic relationships between<br />
the three units to be unclear because of the difficulty in<br />
determining the nature of the contacts between the units.<br />
Garihan (1999) subsequently suggested that the Poor<br />
Mountain – Mill Spring sequence is largely upright.<br />
The Henderson Gneiss is the most prominent unit in<br />
the Columbus Promontory and ranges in composition from<br />
granite to quartz monzonite (Lemmon and Dunn, 1973).<br />
Augen up to 3 cm in length characterize the rock and are<br />
composed of white microcline. Locally, Henderson Gneiss<br />
is intruded by granitoid, which can be differentiated from<br />
Henderson Gneiss by its lighter color, lower biotite content<br />
and lack of augen. Garihan (1999) traced augen gneiss,<br />
which is interpreted as Henderson Gneiss, southward from<br />
the Hendersonville, North <strong>Carolina</strong> area into the Slater<br />
quadrangle (Figure 1). New edge-matching between the<br />
Slater and Tigerville quadrangles demonstrates that the<br />
Henderson Gneiss can be extended to the northern edge of<br />
Tigerville quadrangle (Clendenin and Garihan, in
preparation). Edge-matching between the Saluda and<br />
Tigerville quadrangles along South <strong>Carolina</strong> Highway 11<br />
indicates that augen gneiss mapped within The Cliffs at<br />
Glassy is correlative with Henderson Gneiss.<br />
The Mill Spring complex is locally migmatitic and<br />
contains pegmatites concordant with foliation, sparse pods<br />
and lenses of amphibolite, and a distinctive calc-silicate<br />
rock (Davis, 1993; Garihan, 1999). Davis (1993) divided<br />
the Mill Spring complex into the lower Mill Spring complex<br />
and the upper Mill Spring complex. The lower Mill Spring<br />
complex consists of biotite gneiss, granitoid gneissmetagraywacke,<br />
coarsely crystalline amphibole gneiss, and<br />
finely to medium-crystalline amphibolite (Davis, 1993).<br />
The lower unit is differentiated from the upper Mill Spring<br />
complex by its relative abundance of amphibolite. The<br />
upper Mill Spring complex consists of a variety of gneissic<br />
lithologies (Davins, 1993?) and commonly forms the<br />
dramatic cliffs and balds within the Columbus Promontory<br />
(Davis, 1993). However, in the western reaches of the<br />
Columbus Promontory, the upper Mill Spring complex is<br />
predominately a porphyroblastic gneiss (Davis, 1993). The<br />
porphyroblastic granitoid gneiss and the biotite gneiss<br />
recognized within The Cliffs at Glassy Mountain fit the<br />
description of the upper Mill Spring complex by Davis<br />
(1993) and Garihan (1999). The presence of porphyroblastic<br />
44<br />
granitoid gneiss indicates that this lithology, which had been<br />
recognized in this unit only in the western part of the<br />
Columbus Promontory, extends southeastward into The<br />
Cliffs at Glassy. Our field observations also indicate that<br />
pods of calc-silicate rock are commonly present within<br />
granitoid gneiss and biotite gneiss.<br />
Davis (1993) divided the Poor Mountain Formation into<br />
three mappable members, which are, in ascending<br />
stratigraphic order: interlayered amphibolite and quartzite<br />
(amphibolite-quartzite), garnet-mica schist with quartzite<br />
(mica schist) and laminated amphibolite-hornblende gneiss<br />
(laminated amphibolite). The lower, amphibolite-quartzite<br />
member is discontinuous. Amphibolite layers are finely to<br />
medium-crystalline and have quartzofeldspathic layering.<br />
Quartzite layers range from light yellow-white to dark<br />
brown-black and are composed predominantly of quartz.<br />
The mica schist member is composed primarily of biotite,<br />
muscovite and sillimanite, and it is purple to reddish brown<br />
or light gray, depending on composition. Layers of light<br />
yellow to brown quartzite and pods of high-calcium marble<br />
may occur in the mica schist member. The mica schist<br />
member commonly occurs on many of the peaks in the<br />
southern Columbus Promontory (Davis, 1993). The upper,<br />
laminated amphibolite member crops out primarily in the<br />
southern portion of the Columbus Promontory (Davis, 1993;
Figure 1). The amphibolites of this member are finely to<br />
medium-crystalline, are dark gray to black and are<br />
commonly laminated with quartzofeldspathic layers. The<br />
layering in the amphibolites produces some of the most<br />
pronounced mesoscopic folds within the Columbus<br />
Promontory (Davis, 1993). The mica schist and laminated<br />
amphibolite units that overlie the upper Mill Spring complex<br />
in The Cliffs at Glassy are mapped as Poor Mountain<br />
Formation. These two rock units (mica schist and laminated<br />
amphibolite) are correlated with the upper two members of<br />
Davis’(1993) Poor Mountain Formation.<br />
Thrust faulting<br />
Previous mapping shows that the major lithostratigraphic<br />
units are arranged throughout the Columbus<br />
Promontory in a predictable order within three principal<br />
thrust sheets (Figure 11). These three thrust sheets are<br />
bounded in ascending order by the Tumblebug Creek thrust,<br />
Sugarloaf Mountain thrust and Mill Spring thrust (Davis,<br />
1993). Henderson Gneiss has been emplaced over Poor<br />
Mountain Formation rocks by the Tumblebug Creek thrust.<br />
45<br />
The overlying Sugarloaf Mountain thrust has emplaced Poor<br />
Mountain Formation and upper Mill Spring complex over<br />
Henderson Gneiss. The structurally highest thrust, the Mill<br />
Spring thrust, has emplaced lower Mill Spring complex over<br />
Poor Mountain Formation and upper Mill Spring complex.<br />
Mapping by Garihan (1999) to the west and south of<br />
The Cliffs at Glassy shows that the Sugarloaf Mountain<br />
thrust is the principal fault in the area (Figure 11). The fault<br />
contact is characterized by extreme grain-size reduction in<br />
the underlying Henderson Gneiss (Davis, 1993; Garihan,<br />
1999). Field relationships to the west of the Columbus<br />
Promontory suggest that the Sugarloaf Mountain thrust is<br />
analogous to the Seneca fault (Garihan, 2000, personal communication),<br />
which separates the Six Mile nappe from the<br />
underlying Walhalla nappe (Griffin, 1974, 1978). If this<br />
interpretation is correct, the Poor Mountain – upper Mill<br />
Spring sequence in The Cliffs at Glassy is in the Six Mile<br />
nappe, and the underlying Henderson Gneiss is in the<br />
underlying Walhalla nappe. Although Davis (1993) did not<br />
recognize the Sugarloaf Mountain thrust as folded, Garihan<br />
(1999) demonstrated that the fault surface is complexly
folded near Camp Greenwood, Standingstone Mountain 7.5quadrangle.<br />
In The Cliffs at Glassy, the contact between the<br />
Henderson Gneiss and overlying upper Mill Spring complex<br />
also is characterized by progressive shearing and grain-size<br />
reduction in the underlying Henderson Gneiss, in which<br />
the upper limit is marked by a layer of finely crystalline,<br />
mylonitic gneiss. The Sugarloaf Mountain thrust is mapped<br />
at the top of this mylonitic gneiss layer (Figures 2 and 12).<br />
The overlying upper Mill Spring complex can be<br />
differentiated from the underlying mylonitic Henderson<br />
Gneiss by the presence of large, round, relatively<br />
undeformed porphyroblasts above the contact. Field<br />
relationships indicate that the Sugarloaf Mountain thrust is<br />
folded at Location 5 (Figure 3). West-northwest fold<br />
vergence is consistent with fold vergence mapped at Camp<br />
Greenville approximately nine km to the west of The Cliffs<br />
at Glassy (Garihan, 1999).<br />
Our mapping shows that the contact between members<br />
of the Poor Mountain Formation and the underlying upper<br />
Mill Spring complex is also a thrust (Figures 2 and 12).<br />
Thrusting along this contact in the Six Mile sheet may<br />
explain why the lower, amphibolite-quartzite member in<br />
the Poor Mountain Formation is discontinuous and why the<br />
Poor Mountain Formation locally rests directly on<br />
Henderson Gneiss. Aplite intrusion locally along thrust<br />
planes (Figure 9) suggests that some movement may have<br />
occurred prior to metamorphism. East-vergent folds in the<br />
biotite gneiss of the upper Mill Spring complex and in the<br />
laminated amphibolite member of the Poor Mountain<br />
Formation are consistent with overturning within the<br />
northwest-vergent, fold-nappe structural style of the Inner<br />
Piedmont (Figures 7 and 8). Thrust contacts and fold<br />
vergence also show that the Poor Mountain Formation –<br />
upper Mill Spring sequence should not be generalized as<br />
conformable and largely upright.<br />
Oblique-slip brittle faulting<br />
The southern reaches of the Columbus Promontory are<br />
cut by a large brittle fault system, known as the Marietta-<br />
Tryon fault system (Figure 1), that bounds a northeasttrending<br />
graben (Garihan and others, 1988, 1990; Garihan<br />
and Ranson, 1992). At least 21 faults and splays make up<br />
this fault system, which bounds a graben that varies from<br />
17 km to more than 20 km wide. The graben is defined by<br />
down-to-the-south displacement along the northern<br />
boundary faults and by down-to-the-north displacement<br />
along the southern boundary faults. The strike of the faults,<br />
splays and associated cataclasite zones is N50 o E to N70 o E<br />
(Garihan and others, 1990). Repeated zones of brecciation,<br />
silicification, and vein-filling and both right- and left-oblique<br />
slip indicate polyphase movement (Garihan and others,<br />
1990; Clendenin and Garihan, 2001). Many of the proposed<br />
faults mapped within the Inner Piedmont and Marietta-<br />
Tryon fault system have been based on the projected traces<br />
of zones of silicified cataclasite.<br />
46<br />
The periods of brittle faulting can be deciphered from<br />
the established lithostatigrahic relations. Three generations<br />
of brittle faulting are exposed in The Cliffs at Glassy. The<br />
first generation is defined by pods of silicified cataclasite.<br />
The younger generations, in contrast, are characterized by<br />
unsilicified, left- and right-oblique-slip, brittle faults.<br />
Analysis of Slickensides suggests that offset along<br />
northeast-striking faults is left-oblique, whereas offset along<br />
east-northeast-striking faults is right-oblique. At Location<br />
17, a younger, right-oblique fault offsets both silicified<br />
cataclasite and a left-oblique fault (Figure 2 and 3). Fault<br />
relations at Location 4 indicate that the Sugarloaf Mountain<br />
thrust is offset six meters by down-to-the-south, left-oblique<br />
faults. The down-to-the-south faults are offset by rightoblique,<br />
down-to-the-north faults at Location 2 (Figure 12).<br />
The offsetting relationships at Locations 17 and 2 suggest<br />
that left-oblique displacement was followed by right-oblique<br />
displacement. The proposed sequence of faulting is<br />
consistent with kinematic indicators identified by Garihan<br />
and others (1990) and with observations of the Pax Mountain<br />
fault system by Clendenin and Garihan (2001).<br />
Faults exposed on Rich Mountain (Figures 2, 3 and<br />
12) are displaced in several directions. At Location 9, the<br />
displacement of biotite gneiss and the appearance, across<br />
the fault, of Poor Mountain Formation mica schist and<br />
laminated amphibolite members indicate left-oblique, downto-the-north<br />
offset. At Location 12, the displacement of<br />
the Poor Mountain Formation – upper Mill Spring thrust<br />
contact and the reappearance, across the fault, of upper Mill<br />
Spring complex biotite gneiss indicate right-oblique, downto-the-south<br />
offset. At Location 14, the lateral displacement<br />
of the Poor Mountain Formation – upper Mill Spring thrust<br />
contact and the juxtaposition of mica schist and laminated<br />
amphibolite against biotite gneiss indicate left-oblique,<br />
down-to-the-north offset. At Location 15, the lateral<br />
displacement of the Poor Mountain Formation – upper Mill<br />
Spring thrust contact and the reappearance, across the fault,<br />
of the laminated amphibolite member indicate left-oblique,<br />
down-to-the-north offset Down-to-the-north relationships<br />
are consistent with a stepping into the Marietta-Tryon<br />
graben, which lies to the north of Glassy Mountain,<br />
according to Garihan and others (1990).<br />
Fault relationships are quite complex on the south side<br />
of Glassy Mountain, where left-oblique slip faults have<br />
displaced the Sugarloaf Mountain thrust down to the south<br />
(Figure 2 and 12). Down-to-the-north, right-oblique<br />
movement along younger fault strands tends to obscure these<br />
fault relations as well as the preserved stratigraphic<br />
relationships as observed at Location 5. Garihan and others<br />
(1990) showed that the Cross Plains and Pax Mountain<br />
faults, which lie south of Glassy Mountain, are down-tothe<br />
north. If these relationships are true, the down-to-thesouth<br />
faulting identified along the south face of Glassy<br />
Mountain implies that an east-northeast trending branch of<br />
the Marietta-Tryon graben occur between Glassy Mountain<br />
and Pax Mountain.
CONCLUSIONS<br />
The preserved lithostratigraphic relationships in The<br />
Cliffs of Glassy are comparable with many of those<br />
previously established within the Columbus Promontory.<br />
Some relationships are more complex than previously<br />
recognized. Additional detailed study of adjoining areas is<br />
needed. Recognition of structural facing and brittle faulting<br />
need to be considered in interpretations of the structural<br />
history of the area.<br />
The mapping has implications for understanding the<br />
groundwater resources of The Cliffs at Glassy. The locations<br />
of springs were used in geologic mapping as indirect data<br />
points to locate subvertical, brittle fault strands in areas of<br />
poor exposure. For example, common springs along the<br />
south face of Glassy Mountain were used to identify fault<br />
strands there. Information from the geologic mapping of<br />
The Cliffs at Glassy is being integrated with data from new<br />
water wells on the mountain. This information should help<br />
enhance the groundwater supply for this residential<br />
community, and it will be reported in a forthcoming paper.<br />
ACKNOWLEDGEMENTS<br />
The writers thank Jack Garihan, Clark Niewendorp,<br />
Scott Howard, Lee Mitchell and Will Doar for helpful<br />
discussions and fields visits, Malynn Fields for cartography<br />
and Lynn Clendenin for manuscript preparation. The writers<br />
gratefully acknowledge the financial support of the Blue<br />
Ridge Rural Water Company and they especially thank Larry<br />
Benson and Bates Collins of that company. The writers<br />
thank Ray Christopher and Jack Garihan for their helpful<br />
reviews. The South <strong>Carolina</strong> <strong>Geological</strong> Survey provided<br />
logistical support. This paper is based in part on work for<br />
the senior author’s Master’s thesis, which is in preparation<br />
at the Department of <strong>Geological</strong> Sciences at Clemson<br />
University.<br />
REFERENCES<br />
Bell, A. M., 1981, Vergence: An evaluation: Journal of<br />
Structural Geology, v. 3, no. 3, p.197-202.<br />
Clendenin, C. W., and J. M. Garihan, 2001, Timing of brittle<br />
faulting on Pax Mountain: Achicken or the egg question<br />
applicable to Piedmontmapping: <strong>Geological</strong> <strong>Society</strong> of<br />
America, Abstracts with Programs, v. 33, p. A-19.<br />
Davis, T. L., 1993, Geology of the Columbus Promontory,<br />
western Inner Piedmont, North <strong>Carolina</strong>, southern<br />
Appalachians, p. 17-43, in R.D. Hatcher, Jr. and T.L.<br />
Davis (editors), Studies of Inner Piedmont geology with<br />
a focus on the Columbus Promontory:<strong>Carolina</strong><br />
<strong>Geological</strong> <strong>Society</strong> Annual Field Trip Guidebook.<br />
Garihan, J. M., 1999, The Sugarloaf Mountain thrust in the<br />
Western Inner Piedmont between Zirconia, North<br />
<strong>Carolina</strong>, and Pumpkintown, South <strong>Carolina</strong>, 9 p., in A<br />
Compendium of Selected Field Guides, <strong>Geological</strong><br />
<strong>Society</strong> of America: Southeastern Section Meeting<br />
Guidebook.<br />
47<br />
Garihan, J. M., W. A. Ranson, M. S. Preddy, and T. D.<br />
Hallman, 1988, Brittle faults, lineaments, and cataclastic<br />
rocks in the Slater, Zirconia, and part of the Saluda 7<br />
½-minute quadrangles, northernGreenville County,<br />
South <strong>Carolina</strong> and adjacent Henderson and Polk<br />
Counties, North <strong>Carolina</strong>, p. 266-350, in D.T. Secor<br />
(editor), Southeastern <strong>Geological</strong> Excursions,<br />
<strong>Geological</strong> <strong>Society</strong> of America: Southeastern Section<br />
Meeting Guidebook.<br />
Garihan, J. M., W. A. Ranson, K. A. Orlando, and M. S.<br />
Preddy, 1990, Kinematic history of Mesozoic faults in<br />
northwestern South <strong>Carolina</strong> and adjacent North<br />
<strong>Carolina</strong>: South <strong>Carolina</strong> Geology, v. 33, p. 19-32.<br />
Garihan, J. M., and W. A. Ranson, 1992, Structure of the<br />
Mesozoic Marietta-Tryon graben, South <strong>Carolina</strong> and<br />
adjacent North <strong>Carolina</strong>, p. 539-555, in M. J.<br />
Bartholomew, D. W. Hyndman, D. W. Mogk, and R.<br />
Mason (editors), Basement Tectonics 8: Characterization<br />
and Comparison of Ancient andMesozoic Continental<br />
Margins: Proceedings of the Eight International<br />
Conference on Basement Tectonics, Dordrecht,<br />
Germany, Kluwer Academic Publishers.<br />
Griffin, V. S., Jr., 1974, Analysis of the Piedmont in<br />
northwest South <strong>Carolina</strong>: <strong>Geological</strong> <strong>Society</strong> of<br />
America Bulletin, v. 85, p. 1123-1138.<br />
Griffin, V. S., Jr., 1978, Detailed analysis of tectonic levels<br />
in the Appalachian Piedmont:Geologisches Rundschau,<br />
v. 67, p. 180-201.<br />
Hack, J. T., 1982, Physiographic divisions and differential<br />
uplift in the Piedmont and Blue Ridge: U.S. <strong>Geological</strong><br />
Survey Professional Paper 1265, 49 p.<br />
Hatcher, R. D., Jr., 1989, Tectonic synthesis of the U.S.<br />
Appalachians, Chapter 14, p. 511-535, in R. D. Hatcher,<br />
Jr., W. A. Thomas and G. W. Viele (editors), The<br />
Appalachian-Ouachita orogen in the United States: The<br />
Geology of North America, v. F-2, Boulder, Colorado,<br />
<strong>Geological</strong> <strong>Society</strong> of America.<br />
Hatcher, R. D., Jr., 1993, Perspective on the tectonics of the<br />
Inner Piedmont, southern Appalachians, p. 1-16, in R.<br />
D. Hatcher, Jr. and T. L. Davis (editors), Studies of Inner<br />
Piedmont geology with a focus on the Columbus<br />
Promontory: <strong>Carolina</strong> <strong>Geological</strong> <strong>Society</strong> Annual Field<br />
Trip Guidebook.<br />
Lemmon, R. E., and D. E. Dunn, 1973, Geologic map and<br />
mineral resources of the Bat Cave quadrangle, North<br />
<strong>Carolina</strong>: North <strong>Carolina</strong> Department of Natural<br />
Resources and Community Development Map GM 202<br />
NW, scale 1:24000.<br />
Nelson, A. E., J. W. Horton, Jr., and J. W. Clarke, 1998,<br />
Geologic map of the Greenville 1 o x 2 o quadrangle,<br />
Georgia, South <strong>Carolina</strong>, and North <strong>Carolina</strong>: U.S.<br />
<strong>Geological</strong> Survey Miscellaneous <strong>Geological</strong><br />
Investigations Map I-2175, scale 1:250,000.
South <strong>Carolina</strong> Geology, 2001, v.43, p. 49 -56.<br />
EXPLORING FOR GROUND WATER AND FRACTURE SYSTEMS WITH<br />
THE WADI IN THE <strong>SOUTH</strong> <strong>CAROLINA</strong> PIEDMONT<br />
H. LEE MITCHELL, South <strong>Carolina</strong> Department of Natural Resources – Land, Water & Conservation<br />
Division, Hydrology Section, Piedmont Regional Office, 301 University Ridge, Suite 4800,<br />
Greenville, SC 29601<br />
ABSTRACT<br />
Groundwater resources in the Piedmont of South <strong>Carolina</strong> are becoming increasingly more difficult to locate, while<br />
at the same time demand for water supply is growing because of continued urban expansion into rural areas. The WADI,<br />
a surface geophysical water-prospecting instrument, has been successfully used in recent years to locate ground water.<br />
Two case studies presented here demonstrate the use of the WADI to locate a well site with a high yield and to delineate<br />
a fault zone at the base of a thrust sheet.<br />
INTRODUCTION<br />
The need to locate features that focus groundwater<br />
resources in the Piedmont of South <strong>Carolina</strong> has become<br />
important for continued successful socio-economic<br />
development. The growing abundance of private residences<br />
and small businesses means conventional procedures cannot<br />
be readily applied to locate wells. Over the past several<br />
years, a geophysical instrument, the WADI, has been used<br />
with positive results in the South <strong>Carolina</strong> Piedmont to locate<br />
water-bearing fracture zones. The instrument has also been<br />
used to locate contacts between different rock units.<br />
Growing development and urban sprawl into rural areas<br />
in the Piedmont has increased the need for dependable water<br />
supplies. Shallow saprolite wells or low-yielding bedrock<br />
wells formerly were considered adequate for domestic use.<br />
However, four years of drought in the Piedmont of South<br />
<strong>Carolina</strong> has reduced available water supply, and increased<br />
consumption has created a greater demand. When there was<br />
an adequate water supply, well drillers generally succeeded<br />
in their first attempts to drill a producing well. However, as<br />
increasing urban development spreads across the Piedmont,<br />
there has been a rise in the number of dry or low-yielding<br />
wells. There is also an increasing demand for higheryielding<br />
wells. To accommodate the demand, deeper wells<br />
are being drilled and more wells are likely to be drilled.<br />
Use of the WADI increases the likelihood of locating higheryielding<br />
wells in the Piedmont, and it has increased the<br />
percentage of successful first-time well sites. The probability<br />
of locating the most favorable water-bearing sites in the<br />
once-rural areas is enhanced by the technique.<br />
FIELD PROCEDURES<br />
WADI is the brand name for an instrument<br />
manufactured by ABEM Instrument AB (Sundyberg,<br />
Sweden). The WADI is a passive electromagnetic (EM)<br />
receiver that measures the secondary magnetic field<br />
generated by the interference of very low frequency (VLF)<br />
radio waves with subsurface electrical conductors, such as<br />
water-bearing fracture zones. Transmitted VLF signals are<br />
in the 15 to 30 kilohertz range, with wavelengths between<br />
10 to 20 kilometers. VLF stations are located worldwide,<br />
but only three transmitters operated by the U. S. Navy are<br />
useful in South <strong>Carolina</strong>: Cutler, Maine; Jims Creek,<br />
Washington; and Aguada, Puerto Rico. Another transmitter<br />
is located at Lualualei, Hawaii, but its signal strength is<br />
rarely adequate for use in South <strong>Carolina</strong>.<br />
The use of VLF signals for groundwater exploration is<br />
straightforward. VLF stations transmit a radio signal with a<br />
49
horizontal magnetic field that travels parallel to the ground.<br />
When a subsurface conductor is encountered, a secondary<br />
magnetic field is induced (Figure 1). The WADI identifies<br />
the secondary magnetic field by measuring the two typical<br />
VLF components, called Real (that is, in-phase or tilt angle)<br />
and Imaginary (that is, out-of-phase or quadrature). These<br />
VLF components are ratios of the secondary (vertical)<br />
magnetic field to the primary (horizontal) magnetic field<br />
(Harrigan, 1992). The Real component is measured when<br />
the primary field is at its maximum, or in-phase angle. The<br />
Imaginary component consists of the same measurements<br />
when the primary field is shifted 90 degrees from its<br />
maximum, or out-of-phase angle.<br />
For optimum results, WADI traverses are conducted as<br />
nearly perpendicular as possible to: 1) a suspected bedrock<br />
groundwater source (for example: a draw, valley, stream,<br />
known fault, or other linear feature); and 2) the direction of<br />
transmittal of the radio signal (that is, the bearing of the<br />
suspected feature must be approximately parallel to the<br />
direction of the radio signal). The WADI allows for some<br />
variation, but it cannot exceed 30 degrees on either side of<br />
the direction of the signal. Although this constraint in theory<br />
could pose a problem to successful use of the system, in<br />
fact it does not. This is because the VLF transmitting stations<br />
used are located to the northeast (Cutler, ME; N42°E; 24.0<br />
kHz), the northwest (Jims Creek, WA; N52°W; 24.8 kHz),<br />
and southeast (Aguada, PR; S45°E; 28.4 kHz), and most of<br />
the structures surveyed in the Piedmont of South <strong>Carolina</strong><br />
strike either northeast-southwest or northwest-southeast.<br />
One factor limiting use of the WADI is the nature of<br />
the saprolite. If it is very thick, clayey, and water saturated,<br />
it acts as a conductive layer that may mask underlying<br />
fractures. Nonetheless, most saprolite resistivity apparently<br />
is high enough that the WADI can be used in much of the<br />
South <strong>Carolina</strong> Piedmont. In addition, the target feature must<br />
have the following characteristics: 1) a dip greater than 30°;<br />
2) at least 50 m length; 3) at least 10 m height; 4) at least 1<br />
m thickness; and 5) higher conductivity than surrounding<br />
rocks (Harrigan, 1992). Moreover, the area being surveyed<br />
must be at least 50 miles from a VLF transmitter, which is<br />
not a problem in South <strong>Carolina</strong>. Certain factors that can<br />
overwhelm, interfere with, or mimic natural anomalies must<br />
be avoided or accounted for. These include power lines<br />
(overhead or buried), water lines, gas lines, metal fences,<br />
paved roads, and buildings, as well as other man-made<br />
features. Even equipment such as a GPS receiver can<br />
interfere with the VLF reception by the WADI.<br />
Along a selected traverse, a VLF reading is taken every<br />
5 or 10 m. The WADI automatically stores in memory the<br />
measurements and presents a continuous plot on its LCD<br />
screen. The length of the traverse line should be at least<br />
200 m, but slightly shorter lines are usable to a limited extent.<br />
Although anomalies can be detected with only one profile,<br />
it is better if more than one line is surveyed. Ideally, three<br />
to five parallel traverse lines are run, generally 20 to 50 m<br />
apart. Multiple lines allow comparison of suspected<br />
50<br />
anomalies in different profiles and allow an estimation of<br />
the general strike of an anomaly if it can be correlated across<br />
two or more profiles. When the location of a favorable<br />
anomaly is found, the dip angle and the direction of dip<br />
commonly can be determined. Dip angle is critical in<br />
determining which side of a surface feature to drill so that<br />
its subsurface continuation is intercepted in a well.<br />
Numbered flags are placed at the beginning and end of<br />
each traverse line, and at 50-m intervals along the profile.<br />
Flagging the intervals greatly simplifies subsequent<br />
correlation of WADI anomalies with their locations in the<br />
field. The only drawback to the flags is their occasional<br />
susceptibility to being chewed upon and moved by cows in<br />
pastures and deer in wooded areas. In recent years, locating<br />
the flags with GPS control has increased the accuracy of<br />
locating anomalies—notwithstanding the flags moved or<br />
consumed by animals.<br />
To analyze the data, the WADI uses a filtering algorithm<br />
that simplifies interpretation of the received measurements.<br />
The Real component of a subsurface conductor is displayed<br />
as a peak in the resulting profile. Anomalies close to the<br />
ground surface are sharply peaked, whereas deeper<br />
anomalies show broader, more rounded peaks. The<br />
Imaginary component on the plots can be used to<br />
differentiate between very good conductors (man-made<br />
features such as water lines or power cables) and the desired<br />
poor conductors, as water-bearing zones (Harrigan, 1992).<br />
CASE STUDIES<br />
The WADI has been used successfully to find ground<br />
water resources throughout the South <strong>Carolina</strong> Piedmont,<br />
although not without some failures. In general, the WADI<br />
has helped to locate productive wells in previously<br />
unsuccessful areas or in areas where conventional<br />
methodology would not have sited a well. The WADI<br />
certainly is useful where the geology is poorly known.<br />
Elsewhere, it has been useful in confirming or
supplementing geological map information. The following<br />
case studies combine the use of the WADI and geologic<br />
map information in the South <strong>Carolina</strong> Piedmont, with<br />
successful results.<br />
Granny Apple Farm, Laurens County, South <strong>Carolina</strong><br />
During the mapping of the Laurens North 7.5-minute<br />
quadrangle (Niewendorp, 1996) in Laurens County,<br />
geologists from the South <strong>Carolina</strong> <strong>Geological</strong> Survey traced<br />
a N70°E-striking brittle fault system across the Granny<br />
Apple farm, located east of Little Knob (Clendenin and<br />
others, 2001; Figure 2). The area is underlain by metagranite<br />
and biotite gneiss with interlayeredamphibolite. Soon after<br />
the geologic mapping was completed, the manager of the<br />
farm asked for help in locating a suitable site for a well. It<br />
was to supply water for the farm’s processing and packing<br />
operations. The request was referred to the Hydrology<br />
Section’s Greenville Office of the South <strong>Carolina</strong><br />
Department of Natural Resources - Land, Water and<br />
Conservation Division.<br />
Initial investigation of the site used preliminary<br />
geologic maps produced by Clark Niewendorp and C. W.<br />
Clendenin (Niewendorp, 1996). Features on the maps were<br />
51<br />
identified as potentially favorable sites for wells. The<br />
silicified cataclasite rock bodies and several draws and<br />
streams roughly parallel to and perpendicular to projected<br />
faults were determined to be the best candidates for well<br />
sites (Figure 3).<br />
On August 12, 1997, a site visit was made to the<br />
property. A wide, gently-sloping draw with a general<br />
northwest-southeast bearing was selected for the<br />
geophysical survey (Figure 4). It is underlain by biotite<br />
gneiss. A smaller draw, obscured by grading for a new<br />
packinghouse, runs generally east-west. Mapping showed<br />
a spring in this draw to the west. A fracture or fault was<br />
considered likely in or near the center of the main draw.<br />
Although more favorable sites were identified on the maps,<br />
this site was chosen for practical reasons. The well driller<br />
was scheduled to begin drilling the next day. Moreover, the<br />
site selected for the WADI survey was conveniently located<br />
near the packinghouse, where the amount of water needed<br />
did not require a high-yield well. Southeast of the main<br />
draw and the smaller east-west draw, near the top of the<br />
ridge, some small outcrops of silicified cataclasite (Figure<br />
4, arrow 1) are oriented approximately parallel to the larger<br />
cataclasite bodies exposed on Little Knob to the southwest.
Strikes of the individual silicified cataclasite pods range<br />
from about N70ºE to N85ºE; the average trend of these pods<br />
is N60ºE to N70ºE (Niewendorp, 1996; Clendenin and<br />
others, 2001). The en echelon distribution of the cataclasite<br />
pods and the associated brittle fault system is described in<br />
detail by Clendenin and others (2001).<br />
The draw to be traversed is generally northeastsouthwest<br />
in strike. Since the Cutler (Maine) VLF<br />
transmitter is oriented at N42ºE, that station was used<br />
because it is roughly parallel to the strike of the draw. The<br />
first reading taken with the WADI was near an outcrop of<br />
silicified cataclasite (Figure 4; line 3000, 0 m), and the first<br />
line was on a bearing of N35ºW. This line was 77º from the<br />
radio signal bearing and generally perpendicular to the draw.<br />
VLF readings were taken every 5 m along this 250 m-long<br />
line which crossed the draw. Four more lines parallel to the<br />
first traverse line were conducted; each was 40 m farther to<br />
the southwest, except for the fifth line, which was only 20<br />
m to the southwest of the fourth line. Each line was identified<br />
with a four-digit number; the first numbered 3000, the next<br />
3040, and so forth, until the last one at 3140.<br />
Instead of encountering favorable anomalies near the<br />
center of the draw as expected, large anomalies were<br />
52<br />
encountered near the top of the ridge, immediately northwest<br />
of the silicified cataclasite pod. These large anomalies,<br />
trending approximately N65ºE, were roughly parallel to the<br />
trend of the silicified cataclasites. Apparently the anomalies<br />
were related to the local fault system (see Clendenin and<br />
others, 2001). If this is true large, water-bearing cavities or<br />
very porous zones occur along the fault strands. Similar<br />
features produce water along fault zones at Pax Mountain<br />
(Snipes and others, 1986) and Glassy Mountain in northern<br />
Greenville County (C. W. Clendenin, personal<br />
communication, 2001; see Warlick and others, this volume).<br />
The anomalies appeared favorable for water, especially on<br />
line 3000 at 20 to 30 m, on line 3040 at 20 to 40 m, and on<br />
line 3080 at about 10 to 40 m (Figure 4, arrow 2, the large<br />
hatched area; Figures 5 and 6). A single, laterally continuous<br />
anomaly appeared to be vertical to subvertical, and it became<br />
more prominent with depth. Fractures or faults appeared to<br />
be as shallow as ~15 m (50 ft), but the larger, presumably<br />
water-bearing anomalies were deeper. Also, there was a<br />
large, potentially favorable anomaly on line 3000 at 140 m<br />
dipping (relatively) southeast. However, it was not seriously<br />
considered because it was isolated and did not show up on<br />
the other traverse lines.
Another set of anomalies was detected at the northwest<br />
side of the main draw; these anomalies did not appear to be<br />
as favorable as the large one on the southeast side of the<br />
draw. These anomalies were picked up at 250 m on line<br />
3080, 250 m on line 3120, and 230 m on line 3140 (Figure<br />
53<br />
4, arrow 3, small hatched area; Figures 5 and 6). At those<br />
locations, anomalies ranged in depth from 30 m on 3080 to<br />
50 m on 3120, and more shallow at 15 to 20 m on 3140.<br />
These depth inconsistencies and the smaller size of the<br />
anomalies made them appear less favorable.<br />
Without the use of the WADI, conventional wisdom<br />
would have been to select a well site down the slope closer<br />
to the center of a draw. Although some anomalies subparallel<br />
to and northwest of it were identified, the main draw<br />
did not show any anomalies in the geophysical data. Based<br />
on VLF anomalies, however, a well site was selected near<br />
the top of the ridge northwest of the cataclasite pod. A strong<br />
recommendation was made to concentrate on lines 3040<br />
and 3080, between the 20 m and 35 m marks (Figure 4,<br />
arrow 2). The actual site was on the 3080 traverse line at<br />
about the 25-m mark. Drilling began on August 14, 1997,<br />
and the well was completed the next day. Soil and saprolite<br />
were encountered in the top 58 feet. From 58 to 80 ft, drilling<br />
was very difficult, and sand and “quartz cobbles” were<br />
encountered, which probably were chunks of silicified
cataclasite. “Brown rock quartz” was encountered at 80 ft;<br />
and at a depth of 85 feet, the well was already producing an<br />
estimated 20 gallons per minute (gpm). “Brown rock quartz”<br />
continued to a depth of 105 ft, and from 105 to 205 ft drilling<br />
penetrated “white/gray gneiss with quartz/feldspar”. A<br />
sample collected at 173 ft showed coarse, feldspathic<br />
pegmatite. Drillers estimated the well was producing an<br />
additional 20 gpm at 125 feet. A water-bearing zone was<br />
hit at 171 feet (168 ft, my field notes), producing another<br />
20 gpm. A review of the VLF anomalies on line 3080 at 25<br />
m showed a major feature located about 35 m (115 ft) depth,<br />
and another one was at about 48 m (157 ft) depth. These<br />
anomalies were close to the estimated depths at which the<br />
54<br />
significant water-bearing zones were encountered.<br />
The drillers estimated the overall yield of the well<br />
(doing a standard “air-blow”) to be a minimum of 60 gpm.<br />
No measured pumping test has been performed on the well,<br />
but to date it has never failed to produce the water needed.<br />
At some future date a full pumping test is to be conducted,<br />
to accurately determine the actual well yield and its capacity<br />
for future use. We expect to run geophysical logs on the<br />
well to confirm fracture and formation depths.<br />
Caesars Head State Park
Siting wells in the rugged mountainous area along the<br />
Blue Ridge Front in northern Greenville County is a<br />
challenge, from logistical and geologic viewpoints. Caesars<br />
Head State Park and the Caesars Head community have<br />
drilled several wells, in an attempt to provide enough water<br />
for the State Park and the growing population of the area.<br />
From the early 1920’s the community used spring and<br />
stream water. To better supply the growing demand, the community<br />
installed a well in the late 1960’s. This well had<br />
served them for many years and was also used by the State<br />
Park (Figure 7). On Table 1 this well is number GRV-0779.<br />
In the early 1980s, the community and the State Park<br />
realized that more water was required. As a result, wells<br />
were drilled along Caesars Head ridge. Three dry or lowyielding<br />
wells were drilled (Table 1; wells GRV-712, 711,<br />
and 710). In the mid-1980’s, there were two more failed<br />
attempts to drill useful wells (Table 1; wells GRV-780 and<br />
55<br />
781). After another low-yielding well was drilled in<br />
December 1985 (Table 1; well GRV-782), the South<br />
<strong>Carolina</strong> Parks and Recreation Department contacted our<br />
office in Greenville. Most of the dry and low-yielding wells<br />
were on the north side of the ridge, bisected by US Highway<br />
276. As a result, I decided to evaluate the area south of the<br />
highway. Using geologic, topographic, and lineament<br />
analysis, in June 1986 a site was selected west of the Raven<br />
Cliff Falls trail, and it was drilled a year later (Figure 7;<br />
Table 1; well GRV-792). As of Fall 2001, the well was still<br />
in use as a backup well. At times in the recent past it has<br />
served as the main well.<br />
In 1997, the Greenville office was again contacted for<br />
help by the Caesars Head community. Utilizing the WADI<br />
system that was unavailable in 1986, I began several<br />
geophysical surveys where traverse orientations and relief<br />
allowed. Early attempts did not produce favorable results;<br />
the fourth attempt on August 29, 1997 produced WADI<br />
profiles that showed favorable anomalies for at least one<br />
well site.<br />
Four traverses, ranging in length from 250 to 300 m<br />
(totaling 1,070 m) were run on a bearing of N55°W across<br />
a northeasterly-bearing draw and segment of a stream that<br />
joins Coldspring Branch to the north-northeast (Figure 8).<br />
Traverses were located 40 m apart, with number 4000 to<br />
the southwest and line number 4120 to the northeast.<br />
Although the survey was difficult to conduct because of
dense vegetative cover, the topography was not so rugged<br />
that a drill rig could not be brought in. In fact, the fourth<br />
traverse passed near a previously-drilled well (well number<br />
GRV-782, the low-yielding well drilled in December 1985).<br />
While conducting the survey, anomalies were detected on<br />
traverses 4080 and 4120, to the northeast, about 25 m<br />
northwest of the stream (Figure 8, hatched area; Figure 9).<br />
While conducting the WADI survey, I encountered J. M.<br />
Garihan, who had mapped the Cleveland 7.5-minute<br />
quadrangle. We agreed it could be useful to share<br />
information. After the geophysical data was downloaded<br />
and analyzed, the traverses were superimposed on the<br />
geologic map. The VLF anomaly locations defined the<br />
contact between Poor Mountain Formation amphibolite and<br />
underlying Table Rock Suite biotite quartzo-feldspathic<br />
gneiss. These rocks were in a small klippe of the Six Mile<br />
thrust sheet and the Walhalla nappe, respectively. The<br />
anomalous area coincided with the Seneca fault (Garihan,<br />
2000; see Garihan, this volume).<br />
Combining the VLF data with the complementary<br />
geologic information allowed a confident recommendation<br />
for a well site. A narrow area along the 4080 and 4120<br />
profiles was chosen, between the 230 and 240-m marks.<br />
Unfortunately the depths of the anomaly were shallow, from<br />
about 15 to 60 ft. Drilling regulations for public-supply wells<br />
require a minimum of the top 20 ft to be cased off.<br />
Nonetheless, the anomalies indicate water-bearing zones<br />
would still be available down to 40 ft below the casing.<br />
To date, the site has not been drilled. If and when a<br />
well is completed, drilling should indicate a zone of<br />
permeability associated with grain-size reduction or<br />
fracturing and imbrication along the Seneca fault (see<br />
Garihan, this volume). The survey at Caesars Head confirms<br />
the usefulness of the WADI in locating water-bearing zones<br />
and faults and fracture systems in the South <strong>Carolina</strong><br />
Piedmont.<br />
SUMMARY<br />
The WADI is a proven geophysical tool in locating<br />
favorable well sites. The two case studies document this<br />
conclusion. WADI surveys complement geologic mapping,<br />
particularly helping to delineate faults and fracture systems.<br />
In the future include I plan to combine the VLF surveys<br />
with geologic map information, in order to run large-scale<br />
lines across several suspected areas. Potentially favorable<br />
well sites can be better identified. Application of WADI<br />
surveys and integration with geological mapping will result<br />
in increased success in ground water exploration in the South<br />
<strong>Carolina</strong> Piedmont.<br />
56<br />
ACKNOWLEDGEMENTS<br />
I would like to thank John Brockman, General Manager<br />
of Granny Apple Farms (at the time of the survey), and<br />
Andrew Brockman for assisting in access to the farm for<br />
the geophysical survey. I also thank Bruce Sims and John<br />
Sims, Lee & Sims Well Drilling, for their cooperation in<br />
collecting cutting samples and for access to the Granny<br />
Apple Farms drill site. I appreciate the help from Joe<br />
Anderson, Superintendent of Caesars Head State Park, and<br />
Kirk R. Craig, President of the Caesars Head Water<br />
Company, Inc. Jennifer Turner, a Furman University<br />
Advantage Intern and Earth and Environmental Sciences<br />
student, assisted me in the field and the office with this and<br />
other projects in the summer of 1997. Many thanks to C.<br />
W. Clendenin, J. M. Garihan, and J. A. Harrigan for their<br />
very helpful comments and encouragement in the review<br />
process. Special thanks to Malynn D. Fields for drafting<br />
figures in this paper.<br />
REFERENCES<br />
Clendenin, C. W., C. Scott Howard, Clark A. Niewendorp,<br />
John M. Garihan, William A. Ranson, Seth S.<br />
Blackwell, Marylea R. Hart, James L. Kalbas, John S.<br />
MacLean, Helge F. Pederson, Melissa D. Roberts,<br />
Leslie A. Shaver, and Irene B. Boland, 2001, Notes on<br />
a brittle-fault indicator identified on Granny Apple<br />
Farm, Laurens County, South <strong>Carolina</strong>: South <strong>Carolina</strong><br />
Geology, v. 42, p. 19-27.<br />
Garihan, J. M., 2000, Geologic Map of the Cleveland 7.5minute<br />
quadrangle, Greenville and Pickens Counties,<br />
South <strong>Carolina</strong>: South <strong>Carolina</strong> <strong>Geological</strong> Survey<br />
Open-File Report 130, 1:24,000.<br />
Harrigan, Joseph A., 1992, Evaluation of the “WADI”, an<br />
automated VLF-EM surface geophysical instrument,<br />
for locating high-yield ground water resources in the<br />
Piedmont of South <strong>Carolina</strong>, in Charles C. Daniel, III,<br />
Richard K. White, and Peter A. Stone (editors), Ground<br />
Water in the Piedmont: Proceedings of a Conference<br />
on Ground Water in the Piedmont of the Eastern United<br />
States, October 16-18, 1989, Charlotte, N.C., p. 497-<br />
509.<br />
Niewendorp, Clark A., 1996, Geology of the Laurens North<br />
7.5-minute quadrangle, Laurens County, South<br />
<strong>Carolina</strong>: South <strong>Carolina</strong> <strong>Geological</strong> Survey Open-File<br />
Report 89, 1:24,000.<br />
Snipes, David S., Peter R. Manoogian, Michael W. Davis,<br />
Laura L. Burnett, Jerry A. Wylie, and Steven B. Heaton,<br />
1986, Ground-water problems in the Mesozoic Pax<br />
Mountain fault zone: Ground Water, v. 24, no. 3, p.<br />
375-381.
South <strong>Carolina</strong> Geology, 2001, v. 43, p. 57 – 71.<br />
FLUVIAL GEOCHEMISTRY OF SELECTED TRIBUTARY WATERSHEDS IN<br />
THE ENOREE RIVER BASIN, NORTHWESTERN <strong>SOUTH</strong> <strong>CAROLINA</strong><br />
C. BRANNON ANDERSEN, Department of Earth and Environmental Sciences, Furman University,<br />
Greenville, SC 29613, email brannon.andersen@furman.edu, telephone 864.294.3366,<br />
KENNETH A. SARGENT, Department of Earth and Environmental Sciences, Furman University,<br />
Greenville, SC 9613,<br />
JOHN F. WHEELER, Department of Chemistry, Furman University, Greenville, SC 29613 and<br />
SANDRA K. WHEELER, Department of Chemistry, Furman University, Greenville, SC 29613<br />
ABSTRACT<br />
A major question facing the study of fluvial geochemistry is the nature of the relationship between weathering processes<br />
and the chemical composition of stream water. Although numerous studies have focused on either very small watersheds<br />
or very large river basins, few studies have examined the chemical composition of intermediate (10-1000 km 2 ) watersheds,<br />
particularly in the humid subtropical climate of the southeastern Piedmont region in the southeastern United States.<br />
To better understand the fluvial geochemistry of piedmont streams in a subtropical climate, the chemical composition<br />
was determined for 115 sample localities on nine tributary watersheds of the Enoree River basin, South <strong>Carolina</strong>, that drain<br />
igneous and high-grade metamorphic rocks. The samples were collected during the summer drought conditions of 1999<br />
and 2000. Silicate-weathering diagrams show that kaolinite and gibbsite are the main weathering products, but that smectite<br />
may be present in the regolith. Mineral stability diagrams indicate that the chemical compositions of streams in seven of<br />
the nine watersheds are in equilibrium with kaolinite, whereas streams in two of the watersheds are in equilibrium with<br />
smectite. Two of the most likely factors that control the difference in stream chemistry are rock type and contact time.<br />
Contact time appears to be more important, although confirmation would require a better understanding of the distribution<br />
of mafic rock types in the Enoree River basin. Comparison of the results from the Enoree River to the chemical composition<br />
of rivers in the Orinoco River basin that drain similar rocks suggests that chemical composition of river water is sensitive<br />
to variation in climate.<br />
INTRODUCTION<br />
Studies of fluvial geochemistry in the past have focused<br />
on large river systems such as the Amazon (Stallard and<br />
Edmund, 1987), Siberian rivers (Huh and others, 1998 a,b,<br />
Huh and Edmond, 1999), the Fraser (Cameron and others,<br />
1995), the Seine (Roy and others, 1999), and the Huanghe<br />
(Zang, 1990). Many of these rivers, such as the Amazon,<br />
are notable for the pristine condition of the watersheds.<br />
Significant among these rivers is the Orinoco River basin<br />
draining the Guayana Shield in South America. The Orinoco<br />
is similar to the Enoree River basin in that it drains only<br />
igneous and high-grade metamorphic rocks. Other large<br />
river systems, such as the Seine, have chemical compositions<br />
that are significantly modified by human activity and drain<br />
primarily carbonate rocks. Other studies have focused on<br />
the relationship between mineral weathering and stream<br />
chemistry in small watersheds under very controlled<br />
conditions. The two best examples are the studies of<br />
Coweeta (e.g., Velbel, 1985), and Hubbard Brook (e.g.,<br />
Likens and others, 1977).<br />
Relatively few of the larger river systems that drain<br />
into the Atlantic Ocean have been the subject of detailed<br />
geochemical study. Our goal is to understand the processes<br />
that control the fluvial geochemistry of rivers draining the<br />
57<br />
Piedmont of South <strong>Carolina</strong>. The watersheds of the coastal<br />
region of South <strong>Carolina</strong> have received some attention<br />
(Gardner, 1981), but rivers in the upstate have been ignored.<br />
In this paper, we report the results of a study of nine tributary<br />
watersheds of the Enoree River: Upper Enoree River,<br />
Beaverdam Creek, Mountain Creek, Brushy Creek, Rocky<br />
Creek, Gilder Creek, Durbin Creek, Indian Creek, and Kings<br />
Creek. The Enoree River basin is entirely within the<br />
crystalline terrane of the Piedmont Province, which is<br />
characterized by high-grade metamorphic rocks, granites,<br />
gabbros, and occasional diabase dikes. The nine watersheds<br />
were sampled at a variety of locations to include streams of<br />
different order, drainage area, land cover and rock type.<br />
This paper focuses on characterizing the chemical<br />
composition of stream water in those watersheds. The<br />
results are compared to those of the Orinoco River basin<br />
that drains the Guayana Shield (Edmond and others, 1995).<br />
Like the bedrock in the Enoree River basin, the Guayana<br />
Shield is characterized by a complete absence of<br />
sedimentary rocks other than a quartzitic platform cover.<br />
The primary difference between the two basins is climate,<br />
which is humid tropical in South America, and soils, which<br />
are lateritic oxisols. The results indicate that the chemical
A.<br />
B.<br />
composition of the Enoree tributaries reflect weathering<br />
under subtropical conditions. In general, it appears that the<br />
chemical compositions of the streams are in equilibrium<br />
with the weathering products.<br />
REGIONAL SETTING<br />
The Enoree River basin is a sixth-order basin (Strahler,<br />
1952) that covers 1893 km 2 . Hierarchically, the Enoree<br />
River basin is part of the Lower Broad River basin that<br />
includes the Enoree, Pacolett, Tyger and Saluda basins as<br />
well as several smaller, unnamed basins on the east side of<br />
58<br />
the Broad River (Figure 1). The Lower Broad River basin,<br />
in turn, is part of the Santee River basin, one of the<br />
watersheds in the National Water Quality Assessment<br />
(NAQWA) program of the United States <strong>Geological</strong> Survey.<br />
The Enoree River basin is elongate and asymmetrical, with<br />
the larger tributary watersheds on the southwest side of the<br />
basin.<br />
The Enoree River basin drains both the Inner Piedmont<br />
and the Charlotte belt. The geology of most of the basin is<br />
summarized on the Greenville 1°x2° quadrangle (Nelson<br />
and others, 1998) and the Spartanburg 30’ x 60’ quadrangle<br />
(Boland, 1997). Although the Indian Creek and Kings Creek<br />
watersheds are not located in the above maps, Lawrence<br />
and Corbett (1999) have mapped part of the area. On their<br />
maps, all the watersheds except Kings Creek drain rocks of<br />
the Inner Piedmont. Only Kings Creek drains rocks of the<br />
Charlotte belt.<br />
The Inner Piedmont in the Enoree River Basin consists<br />
of Paleozoic metamorphic and igneous rocks (Nelson and<br />
others, 1998). Metamorphic rock types include granite<br />
gniess, biotite granite gniess, sillimanite-mica schist, biotite<br />
sillimanite schist, muscovite garnet schist, gondite, and<br />
amphibolite. Igneous rock types include Paleozoic granite<br />
intrusions and rare Jurassic diabase dikes. The geologic<br />
maps and field observations suggest that the rocks in the<br />
Durbin Creek watershed are more biotite-rich than rocks in<br />
the watersheds to the northwest.<br />
The controversial position of the Central Piedmont<br />
suture, which separates the Inner Piedmont from the<br />
Charlotte belt, is located somewhere in the southeastern<br />
portion of the Enoree River basin. On the maps of the<br />
Spartanburg 30’x60’ quadrangle by Boland (1997) and<br />
Dennis (1995), the Central Piedmont suture is located<br />
northwest of the Indian Creek watershed. Lawrence and<br />
Corbett (1999), however, suggested that the Indian Creek<br />
thrust that separates the Indian Creek watershed from the<br />
Kings Creek watershed is the boundary between the Inner<br />
Piedmont and the Charlotte belt. Most of the Indian Creek<br />
watershed is located in the Newberry NW and Joanna<br />
quadrangles. The Newberry NW quadrangle has not been<br />
mapped, so the geology of the northern Indian Creek<br />
watershed is unknown. The Joanna quadrangle<br />
(Niewendorp, 1995) shows biotite gneiss and amphibolite<br />
as the primary rock types, with scattered small gabbros and<br />
metagabbros.<br />
The Kings Creek tributary watershed is entirely within<br />
the Charlotte belt. The rocks include both metamorphosed<br />
and younger, unmetamorphosed igneous rocks. Rocks in<br />
the Kings Creek tributary watershed include the Newberry<br />
granite, biotite gneisses, amphibolites, and scattered blocks<br />
of garnet metagabbro and metadiorite (Lawrence and<br />
Corbett, 1999).<br />
The denudation regime of the Enoree River basin is<br />
best described as transport limited (e.g., Stallard and<br />
Edmond, 1987). With the exception of Paris Mountain in<br />
the northern part of the basin, slopes normally are gentle
and bedrock is not generally exposed at the surface except<br />
at shoals in the streams. The soils in the Enoree River basin<br />
uplands are primarily ultisols. Small flood plains are<br />
typically covered with entisols and inceptisols. The ultisols<br />
are typically kaolinitic, whereas the entisols and inceptisols<br />
are poorly developed flood plain deposits. In the southern<br />
third of the basin, upland alfisols are more common in<br />
forested areas, although ultisols still are the dominant soil<br />
type. Kaolinite and gibbsite are the typical clay minerals in<br />
the soils, although smectites may be present in the alfisols.<br />
Full descriptions of the soils in the Enoree River basin, along<br />
with associated climate information, can be found in county<br />
soil surveys produced by the U.S.D.A. Soil Conservation<br />
Service (Camp and others, 1960; Camp, 1960; Camp and<br />
others, 1975; Camp, 1975).<br />
Typically, the soils have poorly developed A and B<br />
horizons that lie on top of thick saprolites. The saprolites<br />
may be relict in the sense that they formed separately from<br />
the soil, and the soil horizon may have developed on the<br />
saprolite rather than on bedrock (Gardner, 1992). This<br />
hypothesis, however, is controversial, and the relationships<br />
among weathering, saprolite development and river<br />
chemistry remain poorly understood.<br />
Climate in the Enoree River basin is subtropical (Camp<br />
and others, 1960; Camp, 1960; Camp and others, 1975;<br />
Camp, 1975), averaging daily high temperatures of 22 o C<br />
and daily lows of 11 o C. Rainfall averages 120 cm per year<br />
with a rainy winter and dry late summer and fall. During<br />
the period of this study, the area has been in drought<br />
conditions with record low streamflow (Figure 2).<br />
METHODS<br />
Grab samples were collected at 115 localities in the<br />
watersheds during the summers of 1999 and 2000<br />
(Appendix, Figure 1). No attempt was made to sample<br />
specific hydrologic events; most samples were collected<br />
during base-flow periods associated with drought conditions<br />
(Figure 2). Samples were collected once per week for seven<br />
weeks ateach locality in order to assess variability in<br />
composition over time. Samples were collected in<br />
precleaned HDPE bottles that were precontaminated with<br />
river water by rinsing three times prior to collection.<br />
Dissolved oxygen, conductivity, pH, and temperature were<br />
measured in the field at the time of sampling.<br />
In the laboratory, samples were filtered through a 0.45-<br />
µm membrane filter, using nitrogen-gas positive-pressure<br />
apparatus. One filtered aliquot was preserved with 2 ml of<br />
concentrated HNO 3 for cation analysis, and one filtered<br />
aliquot was left unpreserved for anion analysis. The filtered<br />
aliquots were stored in a refrigerator at ~4 o C until chemical<br />
analysis. Cation concentrations (Na, K, Ca, Mg, Si, Al, Mn,<br />
Fe) were measured with a Varian ICP-AES. In general, the<br />
concentrations of aluminum were often below the detection<br />
limit of 0.125 mg/L. Iron and manganese concentrations<br />
were generally above the respective detection limits of 0.050<br />
and 0.012 mg/L and are not discussed in the paper. Anion<br />
59<br />
A.<br />
B.<br />
concentrations (fluoride, chloride, bromide, nitrate, nitrite,<br />
phosphate, and sulfate) concentrations were determined by<br />
a Dionex 120 ion chromatograph. Alkalinity was measured<br />
by the low-alkalinity titration method (Eaton and others,<br />
1995) in the summer of 1999 and the Gran titration method<br />
(Gran, 1952) during the summer of 2000. The two methods<br />
of alkalinity titration give essentially the same results,<br />
although the Gran titration is slightly more accurate at very<br />
low alkalinities. All alkalinity was assumed to be in the<br />
form of bicarbonate given the pH of the samples and their<br />
very low phosphate concentrations (
A. B.<br />
The quality of the analyses was assessed by the chargebalance<br />
method of Freeze and Cherry (1979). The majority<br />
of the samples have charge-balance errors of less than ±10%.<br />
Samples with errors greater than 10% typically are the result<br />
of poor alkalinity data. Nitrate can be a significant<br />
proportion of the negative charge in these streams, and<br />
therefore it was included in the charge balance. The charge<br />
balances are reasonable, given the dilute nature of the<br />
streams analyzed.<br />
The cation concentrations should be corrected for<br />
atmospheric input (e.g., Stallard and Edmond, 1983). Three<br />
optional methods exist for the correction of atmospheric<br />
input. In the method of Garrels and McKenzie (1967),<br />
stream water is corrected for atmospheric input by<br />
subtracting the composition of the rainwater from the stream<br />
water. Stallard and Edmond (1983) corrected for cyclic<br />
salt input by assuming all chloride was from rainwater and<br />
subtracted it from sodium (Na* = Na-Cl). Moulton and<br />
others (2000) employed a more elegant method that uses<br />
the cation to chloride ratio of precipitation as a function to<br />
calculate the stream water concentration. We corrected for<br />
precipitation by using the method of Stallard and Edmond<br />
(1983) because the Moulton and others (2000) method<br />
would require a detailed record of recent local precipitation<br />
chemistry. The 1979 through 1986 records of the U.S.G.S.<br />
National Atmospheric Deposition Program for the Clemson<br />
Hydrologic Station show an average Na to Cl ratio of 1.03,<br />
very close to the assumed ratio of 1.0 for the Stallard and<br />
Edmond method. The Clemson data, however, are not recent<br />
60<br />
and show a poor charge balance. The poor charge balance<br />
may be because of the very low concentrations of cations<br />
other than sodium. This would make the application of the<br />
Moulton and others (2000) method suspect when applied<br />
to our data, and, as a result, we have chosen to correct for<br />
cyclic salts, by using the method of Stallard and Edmond<br />
(1983). The method was developed for the pristine<br />
conditions found in the Amazon study area, but the tributary<br />
watersheds in this study may have sources of chloride other<br />
than precipitation, such as septic tank discharge and fertilizer<br />
runoff. Known sources of chloride other than rainfall exist<br />
at eight sites in the Upper Enoree River and Durbin Creek<br />
tributary watersheds. These samples are excluded from<br />
discussion in this paper.<br />
RESULTS<br />
All the data are discussed as averages of the seven<br />
sampling events per locality. Nearly all of the samples were<br />
collected during base flow, and no discharge data are<br />
available for the tributary streams. Hence, the average<br />
compositions are not discharge weighted. The results are<br />
summarized in Appendix. Aluminum concentrations are<br />
averaged by using the detection limit as the concentration<br />
for samples below the detection limit. In such cases, the<br />
average represents a maximum, and thus the concentration<br />
is preceded by a “
A. B.<br />
C. D.<br />
Chemical composition<br />
The chemical compositions of the stream water from<br />
the nine watersheds are mixed cation-bicarbonate (Figure<br />
3). On the cation ternary plot, the samples plot in the center<br />
of the diagram (Figure 3A). The lack of sedimentary rocks<br />
means that all the cations are derived from the weathering<br />
of silicate minerals or are from cyclic salts. The primary<br />
source of sodium and potassium would be feldspars,<br />
61<br />
although biotite would be an additional source of potassium.<br />
The primary sources of calcium and magnesium would be<br />
biotite and amphibole for the felsic gneisses and granites.<br />
In the gabbros and amphibolites, amphiboles, pyroxenes,<br />
and Ca-feldspar would be the major sources of calcium and<br />
magnesium. The lack of any real trend in the diagram<br />
suggests that all the streams contain a mixture of rocks.
A. B.<br />
C. D.<br />
62<br />
+* , where TZ +*<br />
= (Na+K+2Mg+2Ca) – (Cl-2SO ). Weathering of the average shield rock to kaolinite yields a ratio of 0.78 and weathering of the average shale yields a<br />
4<br />
ratio of 0.25 (Huh and Edmond, 1999). Dashed line in both A and B is quartz saturation (Rimstidt, 1997). B) The ratio of dissolved silica to Na * +K (Na *<br />
= Na – Cl). Weathering of the average shield rock to kaolinite yields a ratio of 3.5 (Huh and Edmond, 1999). The ratios associated with the weathering<br />
of typical silicate minerals are the following: Na-feldspar to beidellite, 1.7; Na feldspar and K feldspar to kaolinite, 2; K-feldspar to illite and Nafeldspar<br />
to gibbsite, 3; beidellite to kaolinite, 4 (Huh and others, 1998a). C) The ratio of K to Na. Weathering of granite yields a ratio of 0.77 and<br />
weathering of a tholeiite yields a ratio of 0.26 (Huh and others, 1998b). D) The ratio of Mg/(Mg+Ca) to K/(K+Na). Complete weathering of amphibolites<br />
and granites should show a typical igneous differentiation trend (see text for details). Samples from the Enoree River basin do not vary systematically.<br />
Samples with higher proportions of calcium and magnesium<br />
probably drain areas with greater proportions of<br />
amphibolites. The anion ternary plot shows that Indian Creek<br />
and Kings Creek samples plot along the silicon-bicarbonate<br />
axis, whereas the other streams have larger proportions of<br />
chloride and sulfate (Figure 3B). The source of bicarbonate<br />
is from the weathering of silicate minerals because the region<br />
lacks carbonate rocks. Theoretically, because the Enoree<br />
River basin lacks evaporites, all the samples should lie on<br />
the silicon-bicarbonate axis. The shift towards the chloride<br />
and sulfate apex is therefore problematic. One source of<br />
chloride and sulfate is cyclic salts in rainfall. Additional<br />
sources of sulfate are acid rain and the oxidation of pyrite.<br />
Rainfall in Greenville has an average pH of 4.5, and sulfate<br />
is a major component (Shaver and others, 2001). Pyrite is<br />
an accessory mineral in the rocks of the region and would<br />
be an additional source of sulfur. An additional possible<br />
source of sulfate for a total of four localities in Rocky Creek<br />
and Gilder Creek is industrial discharge. The difference of<br />
Indian Creek and Kings Creek from other tributaries is a<br />
function of the difference in the concentration of silicon<br />
and bicarbonate, because chloride and sulfate concentrations<br />
stay about the same in all the tributaries (e.g., Figure 4B).
A. B.<br />
-3.7 for both diagrams. A) Data plotted<br />
on the stability diagram for the system CaO-Na 2 O-Al 2 O 3 -SiO 2 -H 2 O at 1 atmosphere and 25 0 C. B) Data plotted on the stability diagram for the system<br />
CaO-MgO-Al 2 O 3 -SiO 2 -H 2 O at 1 atmosphere and 25 o C.<br />
Conductivity and pH are typical for streams draining<br />
siliciclastic rocks (Figure 4A). The stream waters are dilute,<br />
with all conductivities less than 200 uS/cm and the majority<br />
less than 80 uS/cm. The pH of stream water is circumneutral,<br />
ranging from 6.3 to 7.7. The majority of the samples have<br />
a pH around 6.6. In general, the conductivity and pH of<br />
samples from the Kings Creek and Indian Creek watersheds<br />
are higher than from the other watersheds.<br />
In contrast, chloride concentrations do not vary in a<br />
similar pattern and show little variation among the<br />
watersheds (Figure 4B). Assuming that most of the chloride<br />
is from rainfall, then the ratio of Si to Cl would not change<br />
if weathering reactions were held constant and the<br />
concentrations only were increased by evapotranspiration.<br />
Evapotranspiration concentrates biologically nonessential<br />
solutes in the ground-water by removing water from the<br />
system. Therefore, both silicon and chloride concentrations<br />
would increase and similar Si to Cl ratios would be observed<br />
in all watersheds if only evapotranspiration were causing<br />
the increase in concentration. The ratios of Si to Cl in Indian<br />
Creek and Kings Creek, however, are higher than in the<br />
rest of the watersheds. This suggests that the variation in<br />
Si concentration is the result of changes in mineral solubility<br />
associated with changes in bedrock composition and/or<br />
weathering intensity (Figure 4C).<br />
The ratio of the concentrations of Ca+Mg to Na+K is a<br />
rough indicator of lithologic variability. The caveat to this<br />
63<br />
is that rainfall may be an important source of sodium to the<br />
system. Uncorrected data show that the ratio is highest in<br />
the Upper Enoree, Indian Creek, and Kings Creek<br />
watersheds (Figure 4D). Amphibolites have been observed<br />
in the Upper Enoree tributary watershed, and amphibolites<br />
are found in the Weeping Mary gneiss in the Kings Creek<br />
watershed (Lawerence and Corbett, 1999). The Shelton<br />
amphibolite is the largest mafic unit located in the Kings<br />
Creek watershed (Lawrence and Corbett, 1999).<br />
Additionally, there are small blocks of garnet metagabbro<br />
and metadiorite in the Kings Creek watershed (Lawrence,<br />
personal communication). Weathering of calcium and<br />
magnesium rich minerals in the amphibolites, metagabbros,<br />
and metadiorites may account for the slightly higher Ca+Mg<br />
to Na+K ratios in the Kings Creek watershed. In Iceland,<br />
streams draining basalts have similar pH, but they have a<br />
Ca+Mg to Na+K ratio of less than 0.5 (Moulton and others,<br />
2000). Small streams draining only amphibolites in the<br />
Buck Creek watershed in North <strong>Carolina</strong> also have similar<br />
pH, but they have much lower conductivities and a much<br />
higher ratio of Ca+Mg to Na+K (Ramaley and Andersen,<br />
1998). In the Orinoco River basin, the Carapo River, which<br />
drains amphibolites, has a Ca+Mg to Na+K ratio of 0.7<br />
(Edmond and others, 1995). As a result, the Ca+Mg to<br />
Na+K ratio can be quite variable for streams draining similar<br />
rock types.
Silicate weathering<br />
Various plots can be used to assess the silicate<br />
weathering processes that occur in the bedrock to produce<br />
secondary minerals. Two common methods used are<br />
comparison of river water chemical composition with<br />
stoichiometric ratios of weathering reactions (silicate<br />
weathering diagrams of Huh et al, 1998a, 1998b; Huh and<br />
Edmond, 1999) and with thermodynamic mineral stability<br />
diagrams (e.g., Norton, 1974; Miller and Drever, 1977).<br />
Other methods include modeling of the total amount of<br />
minerals dissolved by simultaneous equations (e.g., Finley<br />
and Drever, 1997). These models, however, require far more<br />
detailed information of the distribution and elemental<br />
composition of minerals, stream discharges and biotic<br />
uptake than are available for this study, and typically they<br />
are used in studies of small, well-characterized watersheds.<br />
In contrast, the silicate weathering diagrams are more useful<br />
for larger watersheds.<br />
The silicate weathering diagrams are useful indicators<br />
of weathering processes in a watershed (e.g., Huh et al,<br />
1998b). The weathering of aluminosilicate minerals releases<br />
soluble cations and dissolved silica. The ratio of dissolved<br />
silica to soluble cations changes as weathering intensity<br />
increases. Thus, the Si/TZ +* and Si/(Na*+K) ratios are<br />
useful to understand the extent of weathering. In these<br />
ratios, TZ +* =(Na+K+2Ca+2Mg)-(Cl+2SO 4) and is the total<br />
cation charge in µEq/L, and Na*=Na-Cl in µM/L.<br />
Subtracting chloride and sulfate corrects for cyclic salt and<br />
evaporite contribution. Certainly, one issue associated with<br />
silicate regions in the northern hemisphere is the<br />
contribution of sulfate by acid rain. The sulfate<br />
concentration is generally low, however, and with few<br />
exceptions has relatively little impact on the trends observed<br />
in the data.<br />
As some examples, the weathering of Na-feldspar to<br />
beidellite gives a Si/(Na*+K) ratio of 1.7, whereas the same<br />
mineral weathering to kaolinite gives a ratio of 2, and to<br />
gibbsite gives a ratio of 3. The average shield rock<br />
weathering to kaolinite gives a Si/TZ +* ratio of 0.78. For<br />
the tributaries of the Enoree River, many of the samples<br />
plot near the stoichiometric ratios for the weathering of<br />
feldspar or shield rocks to either gibbsite or kaolinite<br />
(between 1.7 and 3.5 or higher), indicating nearly complete<br />
leaching of the soluble cations (Fig. 5 A, B). The TZ +* for<br />
Indian Creek and Kings Creek samples is very high.<br />
Although these watersheds drain igneous and metamorphic<br />
rocks, the TZ +* is five times greater than for rivers draining<br />
shield rocks in the Orinoco River basin and is similar to<br />
Amazon tributaries draining sedimentary rocks of marine<br />
origin (Stallard and Edmond, 1983; Edmond and others,<br />
1995). The ratio of K to Na* indicates that the tributaries,<br />
particularly Indian Creek and Kings Creek, are sodic, which<br />
is to be expected because Na-feldspar is common in<br />
metamorphic rocks and it is more soluble than K-feldspar<br />
(Figure 5C). The abundance of biotite gniess in the Enoree<br />
River basin is the likely cause of the relatively high<br />
64<br />
concentration of potassium. Biotite tends to be quite soluble<br />
and weathers rapidly to kaolinite, and can be the most<br />
significant source releasing both potassium and magnesium<br />
into solution (Kretzschmar and others, 1997; Murphy and<br />
others, 1998). The nearly complete leaching is consistent<br />
with the mineralogy of the soils in the region. Some samples<br />
from Gilder Creek, Brushy Creek, Rocky Creek, Mountain<br />
Creek, and Indian Creek watersheds have ratios near to or<br />
greater than 1.7, suggesting the presence of smectites such<br />
as Na-biedellite (Figure 5B). Huh and Edmond (1999) call<br />
this “superficial” weathering, where some cations and<br />
silicon remain behind in secondary clay and are not released<br />
into solution.<br />
The plot of the molar ratio of Mg/(Mg+Ca) versus K/<br />
(K+Na*) theoretically should display a conventional<br />
igneous differentiation trend (e.g., Edmond and others,<br />
1995). In the Orinoco basin draining the Guayana Shield,<br />
rivers draining granites and amphibolites show such a trend<br />
ranging from a high alkali ratio and low alkaline earth ratio<br />
(granite) to a low alkali and high alkaline earth ratio<br />
(amphibolites). The results from the Enoree River tributaries<br />
are equivocal in that they do not form a well-defined trend,<br />
but they do drain granites, granitic gneisses, and<br />
amphibolites. The ratio of K/(K+Na*) varies considerably,<br />
whereas there is much less variation in the ratio of Mg/<br />
(Mg+Ca).<br />
Nearly all of the samples are saturated or oversaturated<br />
with respect to quartz, but undersaturated with respect to<br />
amorphous silica, which has a solubility of over 1900 µmol/<br />
L (Figure 5A, B; Rimstidt, 1997; Gunnarsson and<br />
Arnorsson, 2000). Only a few samples from Mountain<br />
Creek, Beaverdam Creek, Gilder Creek, and Rocky Creek<br />
are undersaturated with respect to quartz. The dissolvedsilicon<br />
concentration of 400 to 850 µM/L in streams from<br />
the Indian Creek and Kings Creek tributary watersheds are<br />
extraordinarily high, on the same or higher order as those<br />
observed in the Luquillo Mountains of Puerto Rico (White<br />
and others, 1998). The average concentrations are two to<br />
three times higher than the average world stream (Davis,<br />
1964), four to five times higher than in the Amazon<br />
headwaters (Stallard and Edmond, 1987), and higher than<br />
the major rivers in the world (Gaillardet and others, 1999).<br />
Mineral stability diagrams based on thermodynamic<br />
data are useful for understanding the relationships of water<br />
composition and minerals produced by weathering.<br />
Diagrams for the systems Na 2 O-CaO-Al 2 O 3 -SiO 2 -H 2 O and<br />
MgO-CaO-Al 2O 3 -SiO 2 -H 2 O were constructed from the data<br />
of Norton (1974). Activities were calculated with the<br />
Debye-Huckel or extended Debye-Huckel equation at one<br />
atmosphere of pressure and 25 o C. Parameters for the<br />
equations were taken from Drever (1988). Plots of sample<br />
compositions on the mineral stability diagrams indicate that<br />
samples from the Upper Enoree River, Beaverdam Creek,<br />
Mountain Creek, Brushy Creek, Rocky Creek, Gilder Creek,<br />
and Durbin Creek watersheds plot in the kaolinite field<br />
(Figure 6). Samples from the Indian Creek and Kings Creek
watersheds plot in the Ca-smectite field (Figure 6). For<br />
comparison, samples from the Orinoco River basin draining<br />
the Guayana Shield all plot in the kaolinite field (Edmond<br />
and others, 1995). The results from the mineral stability<br />
diagram are consistent with the distribution of soil mineral<br />
composition (Camp, 1960, 1975; Camp and others, 1960,<br />
1975). If amphibolites and the gabbro/metagabbro bodies<br />
are controlling the chemical composition of the streams,<br />
then these results are also consistent with the results obtained<br />
by Bluth and Kump (1994) for rivers draining basalts in the<br />
Hawaiian Islands, Columbia River Plateau region, and<br />
southwestern Iceland. For Indian Creek, the problem is<br />
that gabbros are a minor component of the bedrock, and it<br />
is not clear that the distribution of amphibolites are any<br />
different from elsewhere in the Enoree River basin. The<br />
results from the mineral stability diagram for the Enoree<br />
River samples, however, appear to conflict with the silicateweathering<br />
diagrams, in which Si to Na*+K ratios of less<br />
than 1.7 (Fig. 5 B) indicate that smectite is forming in a<br />
number of samples from watersheds other than Indian Creek<br />
and Kings Creek.<br />
The assumption behind the mineral stability diagrams<br />
is that aluminum is immobile. The work of Gardner (1992)<br />
has called this assumption into question on the basis of bulk<br />
density and chemical analyses of the saprolite, which<br />
suggest that aluminum is lost from the saprolite. If aluminum<br />
ions were mobile throughout the system, however, and were<br />
discharged into the streams, the ratio of silicon to aluminum<br />
would be similar to the loss ratio of 4:1 (Gardner, 1992).<br />
For the tributaries of the Enoree River, the ratio of silicon<br />
to aluminum ranges from 25:1 to more than 200:1<br />
(Appendix), similar to the results from other river systems<br />
examined by Gardner (1992). This suggests that if<br />
aluminum is mobile, it is precipitated as a solid phase<br />
somewhere along the groundwater flow path.<br />
DISCUSSION<br />
The nature of the relationship between weathering<br />
processes and the dissolved chemical composition of river<br />
water is a major problem of fluvial geochemistry. The<br />
chemical composition of rivers is controlled by complex<br />
relationships among rock type, climate, relief, vegetation,<br />
and time (Drever, 1988). A comparison of the Enoree River<br />
basin with that of the Orinoco River basin draining the<br />
Guayana Shield is useful because the bedrock is similar in<br />
composition, whereas the climate is subtropical rather than<br />
humid tropical. This comparison allows a test of the<br />
hypothesis that the geochemical composition of river water<br />
is a function of weathering intensity.<br />
The Guayana Shield, like the Piedmont of South<br />
<strong>Carolina</strong>, has been subjected to long-term weathering that<br />
has resulted in the formation of a thick regolith. The regolith<br />
of the Guayana Shield is completely weathered and<br />
characterized by lateritic oxisols consisting of iron oxides,<br />
gibbsite, and kaolinite (Edmonds and others, 1995). The<br />
regolith of the Guayana Shield is considered to be relict,<br />
65<br />
and all primary minerals have been dissolved. In contrast,<br />
the regolith of the South <strong>Carolina</strong> Piedmont is characterized<br />
by ulitsols overlying a partially weathered saprolite that<br />
contains primary minerals. Detailed examinations of<br />
saprolite in the Piedmont of North <strong>Carolina</strong> show that<br />
kaolinite, halloysite, gibbsite, and amorphous<br />
aluminosilicates are formed directly during the weathering<br />
of granitic gniess (Buol and Weed, 1991; Kretzschmar and<br />
others, 1997), suggesting intense weathering. Smectite,<br />
vermiculite, and smectite-vermiculite are formed during the<br />
weathering of gabbro and metagabbro (Buol and Weed,<br />
1991). Thus, although the Guayana Shield and the Piedmont<br />
of South <strong>Carolina</strong> both are highly weathered, the climate<br />
difference between the two regions results in the presence<br />
of primary minerals and cation-rich clay as weathering<br />
products in the Piedmont saprolite, in addition to iron oxides,<br />
gibbsite, and kaolinite.<br />
Rivers draining the Guayana Shield and streams of the<br />
Enoree River basin both have mixed cation-bicarbonate<br />
water (Edmond and others, 1995). The primary chemical<br />
differences between river water from the Guyana Shield<br />
and stream water from the Enoree River basin are as follows.<br />
River water from the Guayana Shield plots nearer the Na+K<br />
apex on the cation ternary diagram than stream water from<br />
the Enoree River basin, and the ratio of Si to Na*+K and<br />
TZ +* in river water from the Guyana Shield both indicate<br />
complete leaching of cations, with the result that gibbsite<br />
and kaolinite are the weathering products. The differences<br />
in water chemistry suggest differences between weathering<br />
in humid tropical environments and subtropical<br />
environments. The presence of primary minerals in the<br />
saprolite of the Enoree River basin results in a greater<br />
concentration of calcium and magnesium in the water of its<br />
streams than in water from the tributaries of the Orinoco<br />
River that drain the Guayana Shield. Weathering is less<br />
intense in the subtropical Enoree River basin than in the<br />
tropical Orinoco River basin. Consequently, the Si to cation<br />
ratios (Si/TZ +* and Si/Na*+K) in stream water from the<br />
Enoree River basin suggest that some cations have not been<br />
leached and that smectites occur as weathering products.<br />
Kaolin and gibbsite, however, remain the dominant<br />
secondary minerals in water from streams of the Enoree<br />
River basin. If smectites are associated with mafic rock<br />
types (e.g., Buol and Weed, 1991), then the indication of<br />
smectite as a weathering product in the Enoree River basin<br />
likely results from the ubiquitous presence of amphibolites.<br />
The difference in the chemical composition of Indian<br />
Creek and Kings Creek from the tributaries to the northwest<br />
is more problematic. Both Indian Creek and Kings Creek<br />
have higher total dissolved solids, and samples of river water<br />
from both those creeks plot in the smectite field of the<br />
mineral stability diagrams, consistent with maps of the soil<br />
distribution. Samples from the other seven watersheds plot<br />
in the kaolinite field, even during low flow. Geologic maps<br />
of the region show insignificant mafic rocks. The Indian<br />
Creek watershed contains small, volumetrically insignificant
gabbros and metagabbros (Niewendorp, 1995).<br />
Amphibolites are more abundant in the Kings Creek<br />
watershed than in the other watersheds (Lawrence and<br />
Corbett, 1999). Mafic rocks are not abundant in the<br />
tributaries of the Enoree River basin. The overall paucity<br />
of mafic rocks in streams of the Enoree River basin suggests<br />
that contact time may be an important factor in controlling<br />
the chemical composition of those streams. Collecting of<br />
the base-flow samples during drought conditions would<br />
enhance the importance of contact time. Rice and Bricker<br />
(1995) showed that the chemical composition of river water<br />
varies seasonally and that during summer base-flow<br />
conditions, processes occurring below the regolith-bedrock<br />
interface control the chemical composition. Two studies<br />
have found that river water samples will plot in the smectite<br />
field of mineral stability diagrams when ground-water<br />
discharge dominates but will plot in the kaolinite field when<br />
spring runoff dominates (Miller and Drever, 1977; Bluth<br />
and Kump, 1994). Bluth and Kump suggested that, if<br />
stoichiometric weathering were the primary control of river<br />
chemistry, then cation-activity ratios should vary more than<br />
is observed. Their observations and those of Bluth and<br />
Kump (1994), Drever (1988), and Miller and Drever (1977)<br />
suggest that other processes, such as cation exchange and<br />
kinetics of dissolution, can also exert important controls<br />
over river chemistry.<br />
All of the above discussion assumes that aluminum is<br />
immobile within the regolith. Gardner (1992) suggested<br />
that aluminum actually is mobile in the regolith. The ratio<br />
of silicon to aluminum in our rivers, like the results from<br />
Gardner (1992), far exceeds the 4:1 ratio predicted by the<br />
chemical composition of saprolite. Thus, the results from<br />
our study do not confirm the mobility of aluminum.<br />
Aluminum, however, is transported primarily in colloidal<br />
form in rivers, and it may be rapidly lost from the river<br />
system. A full test of the aluminum mobility hypothesis<br />
would require analysis of ground-water to determine if<br />
aluminum is mobile beyond the soil horizon, and if mobile,<br />
where the aluminum is precipitated.<br />
CONCLUSIONS<br />
The tributaries of the Enoree River basin drain igneous<br />
and high-grade rocks weathered in a subtropical basin. The<br />
chemical composition of the stream waters suggests that<br />
kaolinite and gibbsite are the dominant secondary<br />
weathering products, but that smectites may be present<br />
throughout the basin. Mineral stability diagrams indicate<br />
that smectites are most likely to be abundant in the Indian<br />
Creek and Kings Creek watersheds, although, if the presence<br />
of mafic rocks determines the secondary weathering<br />
products, these watersheds are not much different from the<br />
other seven watersheds.<br />
The comparison of the Enoree River basin to the rivers<br />
of the Orinoco River basin draining the Guayana Shield is<br />
useful because the main difference is climate. The suggested<br />
presence of smectites in the Enoree River basin may reflect<br />
66<br />
weathering in a subtropical environment versus a humid<br />
tropical environment. This conclusion is consistent with<br />
the presence of ultisols overlying a saprolite in the Enoree<br />
River basin rather than the deeply weathered lateritic oxisols<br />
of the tropics.<br />
ACKNOWLEDGEMENTS<br />
This work was funded by NSF-REU Grant #EAR-<br />
9820605, SC-DHEC Contract EQ-9-461, and Furman<br />
University. This research could not have been completed<br />
with out the tremendous help and dedication of our many<br />
summer research students who participated in the 1999 and<br />
2000 River Basin Research Initiative. Thanks to Bill Ranson<br />
and Bob Gardner for insightful comments that greatly<br />
improved this paper. Also, thanks to Dave Lawrence for<br />
providing geologic maps and information about the rock<br />
types of the Indian Creek and Kings Creek watersheds.<br />
REFERENCES<br />
Bluth, G. J. S., and L. R. Kump, 1994, Lithologic and<br />
climatologic controls of river chemistry: Geochimica et<br />
Comsochimica Acta, v. 58, p. 2341-2359.<br />
Boland, I. B., 1997, Structural and petrogenetic implications<br />
of geophysical and geochemical maps of the Spartanburg<br />
30 x 60 minute quadrangle, South <strong>Carolina</strong>: South<br />
<strong>Carolina</strong> Geology, v. 39, p. 1-21.<br />
Buol, S. W., and S. B. Weed, 1991, Saprolite-soil<br />
transformations in the Piedmont and Mountains of North<br />
<strong>Carolina</strong>: Geoderma, v. 51, p. 15-28.<br />
Cameron, E. M., G. E. M. Hall, J. Veizer, and R. H. Krouse,<br />
1995, Isotopic and elemental hydrogeochemistry of a<br />
major river system: Fraser River, British Columbia,<br />
Canada: Chemical Geology, v. 122, p. 149-169.<br />
Camp, W., 1960, Soil survey of Spartanburg County, South<br />
<strong>Carolina</strong>: U.S. Department of Agriculture, 83 p. + maps.<br />
Camp, W., W. E. Jones, P. R. Miford, S. H. Hearn, and L. E.<br />
Aull, 1960, Soil survey of Newberry County, South<br />
<strong>Carolina</strong>: U.S. Department of Agriculture, 6 pp. + maps.<br />
Camp, W., 1975, Soil survey of Greenville County, South<br />
<strong>Carolina</strong>: U.S. Department of Agriculture, 71 p. + maps.<br />
Camp, W., J. C. Meltzer, W. H. Fleming, and L. E. Andrew,<br />
1975, Soil survey of Laurens and Union Counties, South<br />
<strong>Carolina</strong>: U.S. Department of Agriculture, 66 p. + maps.<br />
Davis, S. N., 1964, Silica in streams and ground water:<br />
American Journal of Science, v. 262, p. 870-891.<br />
Dennis, A., 1995, Rocks of the <strong>Carolina</strong> terrane in the<br />
Spartanburg 30° x 60° quadrangle: 1:100,000 map<br />
prepared for 1995 <strong>Carolina</strong> <strong>Geological</strong> <strong>Society</strong> Field Trip.<br />
Drever, J. I., 1988, The geochemistry of natural waters<br />
(second edition): Prentice-Hall, New Jersey.<br />
Edmond, J. M., M. R. Palmer, C. I. Measures, B. Grant,<br />
and R. F. Stallard, 1995, The fluvial geochemistry and<br />
denudation rate of the Guayana Shield in Venezuela,<br />
Columbia, and Brazil: Geochimica et Cosmochimica<br />
Acta, v. 59, p. 3301-3325.
Finley, J. B., and J. I. Drever, 1997, Chemical mass balance<br />
and rates of mineral weathering in a high-elevation<br />
catchment, West Glacier Lake, Wyoming: Hydrological<br />
Processes, v. 11, p. 745-764.<br />
Freeze, R. A., and J. A. Cherry, 1979, Groundwater:<br />
Prentice-Hall, New Jersey.<br />
Gaillardet, J., B. Dupre, P. Louvat, and C. J. Allegre, 1999,<br />
Global silicate weathering and CO consumption rates<br />
2<br />
deduced from the chemistry of large rivers: Chemical<br />
Geology, v. 159, p. 3-30.<br />
Gardner, L. R., 1981, Element mass balances for South<br />
<strong>Carolina</strong> coastal plain watersheds: Water, Air, and Soil<br />
Pollution, v. 15, p. 271-284.<br />
Gardner, L. R., 1992, Long-term isovolumetric leaching of<br />
aluminum from rocks during weathering: Implications<br />
for the genesis of saprolite: Catena, v. 19, p. 521-537.<br />
Garrels, R. M., and F. T. Mackenzie, 1967, Origin of the<br />
chemical compositions of some springs and lakes:<br />
American Chemical <strong>Society</strong> Advances in Chemistry<br />
Series 67, p. 222-242.<br />
Gran, G., 1952, Determination of the equivalence point in<br />
potentiometric titrations. Part II: Analyst, v. 77, p. 661-<br />
671.<br />
Gunnarsson, I., and S. Arnorsson, 2000, Amorphous silica<br />
0<br />
solubility and the thermodynamic properties of H4SiO4 in the range of Oo to 350oC at Psat: Geochimica et<br />
Cosmochimica Acta, v. 64, p. 2295-2307.<br />
Huh, Y., M. -Y. Tsio, A. Zaitsev, and J. M. Edmond, 1998a,<br />
The fluvial geochemistry of the rivers of Eastern Siberia:I.<br />
Tributaries of the Lena River draining the sedimentary<br />
platform of the Siberian Craton: Geochimica et<br />
Cosmochimica Acta, v. 62, p. 1657-1676.<br />
Huh, Y., G. Panteleyev, D. Babich, A. Zaitsev, and J. M.<br />
Edmond, 1998b, The fluvial geochemistry of the rivers<br />
of Eastern Siberia: II. Tributaries of the Lena, Omoloy,<br />
Yana, Indigirka, Kolyma, and Anadry draining collisional/<br />
accretionary zone of the Verkhoyansk and Cherskiy<br />
ranges: Geochimica et Cosmochimica Acta, v. 62,<br />
p. 2039-2053.<br />
Huh, Y., and J. M. Edmond, 1999, The fluvial geochemistry<br />
of the rivers of Eastern Siberia: III. Tributaries of the<br />
Lena and Anabar draining the basement terrain of the<br />
Siberian Craton and the Trans-Baikal Highlands:<br />
Geochimica et Cosmochimica Acta, v. 63, p. 967-988.<br />
Kretzschmar, R., W. P. Robarge, A. Amoozegar, and M. J.<br />
Verpraskas, 1997, Biotite alteration to halloysite and<br />
kaolinite in soil-saprolite profiles developed from mica<br />
schist and granite gniess: Geoderma, v. 75, p. 155-170.<br />
Lawrence, D. P., and W. Corbett, 1999, Regional<br />
significance of the Gold Hill shear zone in South <strong>Carolina</strong>:<br />
<strong>Geological</strong> <strong>Society</strong> of America Abstracts with Programs,<br />
v. 31, p. 27.<br />
Likens, G. E., F. H. Bormann, R. S. Pierce, J. S. Eaton, and<br />
N. M. Johnson, 1977, Biogeochemistry of a Forested<br />
Ecosystem: Springer-Verlag New York, Inc, New York,<br />
New York.<br />
67<br />
Miller, W. R., and J. I. Drever, 1977, Chemical weathering<br />
and related controls on surface water chemistry in the<br />
Absoroka Mountains, Wyoming: Geochimica et<br />
Cosmochimica Acta, v. 41, p. 1693-1702.<br />
Moulton, K. L., J. West, and R. A. Berner, 2000, Solute<br />
flux and mineral mass balance approaches to the<br />
quantification of plant effects on silicate weathering:<br />
American Journal of Science, v. 300, p. 539-570.<br />
Murphy, S. F., S. L. Brantley, A. E. Blum, A. F. White, and<br />
H. Dong, 1998, Chemical weathering in a tropical<br />
watershed, Luquillo Mountains, Puerto Rico: II. Rate<br />
and mechanism of biotite weathering: Geochimica et<br />
Cosmochimica Acta, v. 62, p. 227-243.<br />
Nelson, A. E., J. W. Horton, Jr., and J. W. Clarke, 1998,<br />
Geologic map of the Greenville 1 o x2 o quadrangle,<br />
Georgia, South <strong>Carolina</strong>, and North <strong>Carolina</strong>: U.S.<br />
<strong>Geological</strong> Survey Miscellaneous Investigations Series<br />
Map I-2175, 12 p. + maps.<br />
Niewendorp, C. A., 1995, Geology of the Joanna 7.5 minute<br />
quadrangle: South <strong>Carolina</strong> <strong>Geological</strong> Survey Openfile<br />
Report 85, 1:24,000.<br />
Norton, D., 1974, Chemical mass transfer in the Rio Tanama<br />
system, west-central Puerto Rico: Geochimica et<br />
Cosmochimica Acta, v. 38, p. 267-277.<br />
Ramaley, S., and C. B. Andersen, 1998, Lithologic control<br />
of stream composition, Chunky Gal mafic-ultramafic<br />
complex, Clay County, N.C.: <strong>Geological</strong> <strong>Society</strong> of<br />
America Abstracts with Programs, Southeastern Section,<br />
v. 30, p. 55.<br />
Rimstidt, J. D., 1997, Quartz solubility at low temperatures:<br />
Geochimica et Cosmochimica Acta, v. 61, p. 2553-2558.<br />
Roy, S., J. Gaillardet, and C. J. Allegre, 1999, Geochemistry<br />
of dissolved and suspended loads of the Seine River,<br />
France: Anthropogenic impact, carbonate, and silicate<br />
weathering: Geochimica et Cosmochimica Acta, v. 63,<br />
p. 1277-1292.<br />
Shaver, L., S. Wheeler, C. B. Andersen, and K. A. Sargent,<br />
2001, The chemical composition of rain in upstate South<br />
<strong>Carolina</strong>: <strong>Geological</strong> <strong>Society</strong> of America Abstracts with<br />
Programs, Southeastern Section, v. 33.<br />
Stallard, R. F., and J. M. Edmond, 1983, Geochemistry of<br />
the Amazon 2. The influence of geology and weathering<br />
environment on the dissolved load: Journal of<br />
Geophysical Research, v. 88, p. 9671-9688.<br />
Stallard, R. F., and J. M. Edmond, 1987, Geochemistry of<br />
the Amazon 3. Weathering chemistry and limits to<br />
dissolved inputs: Journal of Geophysical Research, v.<br />
92, p. 8293-8302.<br />
Strahler, A. N., 1952, Dynamic basis of geomorphology:<br />
<strong>Geological</strong> <strong>Society</strong> of America Bulletin, v. 63, p. 923-<br />
938.<br />
Velbel, M. A., 1985, Geochemical mass balances and<br />
weathering rates in forested watersheds of the southern<br />
Blue Ridge: American Journal of Science, v. 285, p. 904-<br />
930.
White, A. F., A. E. Blum, M. S. Schulz, D. V. Vivit, D. A.<br />
Stonestrom, M. Larsen, S. F. Murphy, and D. Eberl, 1998,<br />
Chemical weathering in a tropical watershed, Luquillo<br />
Mountains, Puerto Rico. I. Long-term versus short-term<br />
weathering fluxes: Geochimica et Acta, v. 62, p. 211-<br />
228.<br />
68<br />
Zhang, J., 1990, Drainage basin weathering and major<br />
element transport of two large Chinese rivers (Huanghe<br />
and Changjiang): Journal of Geophysical Research, v.<br />
95C, p. 13,277-13,288.
Appendix<br />
Sample pH Conductivity Na K Ca Mg Cl SO4 HCO3 Si Al<br />
Location (µS/cm) (mg/l) (mg/l) (mg/l) (mg/l) (mg/l) (mg/l) (mg/l) (mg/l) (mg/l)<br />
Upper Enoree River<br />
UE03 6.92 39.01 2.98 1.31 3.13 0.75 2.49 2.56 13.30 7.22
Appendix (continued)<br />
Sample pH Conductivity Na K Ca Mg Cl SO4 HCO3 Si Al<br />
Location (µS/cm) (mg/l) (mg/l) (mg/l) (mg/l) (mg/l) (mg/l) (mg/l) (mg/l) (mg/l)<br />
MC15 6.48 27.12 2.38 1.21 1.54 0.73 2.24 1.94 8.22 4.06
Appendix (continued)<br />
Sample pH Conductivity Na K Ca Mg Cl SO4 HCO3 Si Al<br />
Location (µS/cm) (mg/l) (mg/l) (mg/l) (mg/l) (mg/l) (mg/l) (mg/l) (mg/l) (mg/l)<br />
GC09 6.56 54.43 4.24 2.42 5.12 0.91 4.23 5.12 16.56 5.38
South <strong>Carolina</strong> Geology, 2001, v. 43, p. 73 – 86.<br />
<strong>GEOLOGY</strong> OF THE INNER PIEDMONT IN THE CAESARS HEAD AND TABLE<br />
ROCK STATE PARKS AREA, NORTHWESTERN <strong>SOUTH</strong> <strong>CAROLINA</strong>: 2001<br />
<strong>CAROLINA</strong> GEOLOGICAL SOCIETY FIELD TRIP<br />
WILLIAM A. RANSON, Department of Earth and Environmental Sciences, Furman University,<br />
Greenville, SC 29613 and<br />
JOHN M. GARIHAN, Department of Earth and Environmental Sciences, Furman University,<br />
Greenville, SC 29613<br />
INTRODUCTION<br />
The 2001 <strong>Carolina</strong> <strong>Geological</strong> <strong>Society</strong> (CGS) field trip<br />
examines metamorphic stratigraphy, structure, and<br />
hydrology in the Caesars Head and Table Rock state parks<br />
area of the western Inner Piedmont of South <strong>Carolina</strong>. Seven<br />
field trip stops in four contiguous quadrangles along the<br />
Blue Ridge Front are located on the regional geologic map<br />
(Figure 1). The stops are designed to illustrate some of the<br />
73<br />
major rock types and structures we have encountered in the<br />
region during our geologic mapping. The goal of this<br />
mapping is to better understand the geologic events that led<br />
to the present distribution of rocks and structures. Many<br />
questions remain to be answered, including the timing of<br />
tectonic events. It is our hope that the field trip stops will<br />
stimulate discussions about the evolution of this part of the<br />
southern Appalachians.
SIX MILE SHEET:<br />
POOR MOUNTAIN FORMATION<br />
TALLULAH FALLS FORMATION<br />
SENECA (SUGARLOAF MTN.) FAULT<br />
A previous field trip for the CGS into the “dark corner”<br />
of northwestern South <strong>Carolina</strong> was led by V. S. Griffin, Jr.<br />
and R. D. Hatcher, Jr. in October 1969. The geological<br />
concepts presented then regarding the character of Inner<br />
Piedmont structures remain firmly intact after 30 years. The<br />
1993 CGS field trip to the rugged North <strong>Carolina</strong> portion<br />
of the Inner Piedmont, led by R. D. Hatcher, Jr. and T. L.<br />
Davis, provided the geologic and tectonic framework<br />
(Hatcher, 1993; Davis, 1993) that is the basis for our current<br />
studies (Garihan, 1999a, 1999b). The 2001 CGS field trip<br />
updates recent geologic and hydrologic studies in the South<br />
<strong>Carolina</strong> portion of the Columbus Promontory. It bridges a<br />
gap in the geology between the areas covered by the 1969<br />
and 1993 field trips.<br />
REGIONAL GEOLOGIC RELATIONSHIPS<br />
The Appalachian Inner Piedmont block of North and<br />
South <strong>Carolina</strong> is a terrane of polyphase deformed<br />
metamorphic rocks of middle to upper amphibolite grade<br />
that were subjected to several major Paleozoic<br />
compressional and Mesozoic extensional orogenic events.<br />
The terrane is noted for its complex structure of fold nappes<br />
and stacked thrust sheets (Griffin, 1974; Nelson and others,<br />
1998; Hatcher, 1999); widespread distribution of a<br />
perplexing variety of Paleozoic granitoid gneisses; and poor,<br />
commonly saprolitic, exposure. The Inner Piedmont block<br />
lies between the eastern Blue Ridge province to the<br />
northwest and the <strong>Carolina</strong> terrane to the southeast (Figure<br />
1 inset), and it is separated from them by the Brevard fault<br />
and the central Piedmont shear zone, respectively. The Inner<br />
Piedmont is related closely to the eastern Blue Ridge<br />
province in terms of stratigraphy and metamorphic grade,<br />
although tectonically disconnected from it (Hatcher, 1993,<br />
1998, 1999). Together, the two form the Piedmont terrane,<br />
of which the origin and accretion history remain<br />
controversial. Unlike the western Blue Ridge province, of<br />
which the affinity with ancestral North America or Laurentia<br />
74<br />
(Hatcher and Goldberg, 1991) seems clear, the Piedmont<br />
terrane is viewed by some as an ancient margin of North<br />
America, part of one or more accretionary prisms (Hatcher,<br />
1987; Rankin, 1988). Others have suggested that it is a<br />
suspect terrane welded onto the North American continent<br />
during Early to Middle Ordovician time (Horton and others,<br />
1989; Williams and Hatcher, 1982, 1983).<br />
Four major formations occur in the area (Garihan,<br />
1999a) and will be visited on the 2001 CGS field trip. They<br />
lie within the Six Mile thrust sheet, which overlies Walhalla<br />
nappe and is separated from it by the Seneca fault (Sugarloaf<br />
Mountain fault; Figure 2). Lithologic units in the Six Mile<br />
thrust sheet include the Tallulah Falls Formation and<br />
overlying Poor Mountain Formation. The Tallulah Falls<br />
Formation consists of biotite granitoid gneisses, migmatitic<br />
biotite-muscovite gneiss and schist, muscovite-biotite<br />
metagraywacke and minor calc-silicate gneiss. The Poor<br />
Mountain Formation is a series of interlayered garnet mica<br />
schist and amphibolite with less abundant metaquartzite and<br />
biotite gneiss. Below the Seneca fault in the Walhalla nappe<br />
are the Henderson Gneiss (a medium-crystalline, wellfoliated<br />
biotite augen gneiss ranging in composition from<br />
granite to granodiorite) and the Table Rock Plutonic Suite<br />
biotite gneiss (a finely crystalline, finely layered biotite<br />
gneiss of granitic composition; hereafter referred to as Table<br />
Rock gneiss).<br />
OVERVIEW OF THE 2001 CGS FIELD EXCURSION<br />
The Saturday road log begins in Cleveland, South<br />
<strong>Carolina</strong> (Cleveland quadrangle) and follows US 276<br />
northward as it climbs 2500 feet up the face of the Blue<br />
Ridge Front. From Caesars Head overlook, sweeping<br />
panoramas of the Piedmont and its exfoliation domes to the<br />
south are observed. This mature landscape is experiencing<br />
Late Cenozoic uplift, with attendant headward erosion and<br />
incision (partly controlled by brittle faults and joints) and<br />
local stream piracy. Near Camp Greenville (Standingstone<br />
Mountain quadrangle) along the crest of the Blue Ridge<br />
Front, the field trip participants will examine several<br />
noteworthy exposures of the Seneca fault at the base of the<br />
Six Mile thrust sheet. The Seneca fault is equivalent to the<br />
Sugarloaf Mountain fault of the North <strong>Carolina</strong> Columbus<br />
Promontory (see Garihan, this volume). Folding and<br />
thrusting, regionally involving rocks of the Poor Mountain<br />
Formation and Tallulah Falls Formation, are seen to postdate<br />
Seneca fault emplacement. Mesoscopic structural<br />
relationships in exposures near Camp Greenville suggest a<br />
regional tectonic model consistent with a normal, forelandyounging<br />
thrust sequence (younger thrusts to the northwest).<br />
Out-of-sequence thrusting was postulated for the Inner<br />
Piedmont of the North <strong>Carolina</strong> Columbus Promontory, the<br />
focus of the 1993 CGS Annual Field Trip.<br />
Retracing part of our route, the trip follows South<br />
<strong>Carolina</strong> Highway 8 and South <strong>Carolina</strong> Highway 11 to<br />
Table Rock State Park (Table Rock quadrangle). Folds in<br />
Table Rock gneiss and amphibolite of the Walhalla nappe
occur at Carrick Creek along the Table Rock trail. The day’s<br />
traverse ends at Green Creek, where biotite augen gneiss<br />
interlayered with Table Rock gneiss is well exposed. On<br />
another visit to Table Rock State Park, we invite the field<br />
trip participants to complete the climb along the Table Rock<br />
trail, which crosses several klippen of the Six Mile thrust<br />
sheet at Panther Gap and Table Rock proper (elevation 3124<br />
ft or 952 m). There Poor Mountain Formation rocks lie at<br />
the extreme northwestern erosional edge of the Six Mile<br />
thrust sheet, at elevations of 2400 to 3100 feet. Polyphasedeformed,<br />
north-plunging folds in Table Rock gneiss and<br />
pegmatite are well exposed at extensive pavements on the<br />
west side of Table Rock at Governors Rock, located below<br />
the summit of the exfoliation dome. For igneous petrologists<br />
and structural geologists these features are well worth the<br />
exertions of an exhilarating climb to the top. The Sunday<br />
half-day trip will examine features of the Henderson Gneiss<br />
in the Eastatoe Gap quadrangle.<br />
The 2001 CGS field trip motif of exfoliation domes<br />
with thrust klippen along their peaks is reminiscent of the<br />
geologic relationships described on the 1993 CGS Annual<br />
Field Trip to the Chimney Rock area, North <strong>Carolina</strong>. A<br />
road log for the Pumpkintown, South <strong>Carolina</strong> – Caesars<br />
Head – Camp Greenville area was written for the March<br />
1999 Southeast Sectional Meeting of the <strong>Geological</strong> <strong>Society</strong><br />
of America, held at the University of Georgia, in Athens.<br />
That guide (Garihan and Ranson, 1999) covers several stops<br />
that we have reinterpreted for the 2001 CGS field trip. It is<br />
suitable for additional interesting stop localities in the<br />
Caesars Head area that are “permanent” and easily<br />
accessible for small groups.<br />
SATURDAY ROAD LOG<br />
The road log (stops shown on Figure 1) begins in<br />
Cleveland, South <strong>Carolina</strong> at the junction of US 276 and<br />
SC 11 (Cherokee Foothills Parkway) (Cleveland 7.5-minute<br />
quadrangle). It follows US 276 northward and SC 11 to the<br />
west. Cross the Middle Saluda River at 0.6 mi and continue<br />
west past mossy exposures of biotite augen gneiss on the<br />
left (south) side of the road at 1.0 mile. At 2.5 mi pass<br />
through a wind gap produced when an ancestral, eastflowing<br />
South Saluda River was captured by headward<br />
erosion of streams draining southward off the rising Blue<br />
Ridge Front (Haselton, 1974). At 3.3 mi, just north of Blythe<br />
Shoals, we pass the point of stream capture. The highway<br />
continues west parallel to the South Saluda River. Its<br />
rectangular drainage pattern, with local entrenched<br />
meanders due to rejuvenation, is well developed in the<br />
southern Cleveland quadrangle. To the west there is a good<br />
view of the Table Rock exfoliation dome.<br />
The prominent east-trending valley of the South Saluda<br />
River in the central Cleveland quadrangle is underlain by a<br />
normal fault, the Palmetto Cove fault (Figure 1; see also<br />
cross-sections of Garihan, this volume); up is on the north<br />
side of the fault. From Stop 1 in the middle of the Cleveland<br />
quadrangle, the Palmetto Cove fault can be traced about 8<br />
75<br />
¾ miles westward toward the dam of the Table Rock<br />
Reservoir. The ridge of hills south of the South Saluda<br />
River valley and US 276 is underlain by north-dipping Poor<br />
Mountain Formation amphibolite and schist, which lie<br />
stratigraphically above the Tallulah Falls Formation. The<br />
Palmetto Cove fault is one of a number of Mesozoic brittle<br />
faults developed along the Blue Ridge Front in upstate South<br />
<strong>Carolina</strong>. They commonly trend N60°E to easterly and<br />
control the orientation of many of the ridges and valleys in<br />
the region (see Garihan and others, 1990 and 1993 for further<br />
discussion). Stop 1 is at 4.8 mi.<br />
Stop 1: Tallulah Falls Formation at falls and biotite<br />
augen gneiss at overhang.<br />
LOCATION: The stop is located 4.8 mi (7.7 km) west of<br />
Cleveland, South <strong>Carolina</strong>, at a roadside pulloff adjacent to<br />
a small waterfall (Figure 3, Cleveland 7.5-minute<br />
quadrangle). This area, known as Wildcat Wayside, is part<br />
of the South <strong>Carolina</strong> state park system. It was originally<br />
built as a roadside rest stop during the 1930s by the Civilian<br />
Conservation Corps (CCC).<br />
DESCRIPTION: At this stop we introduce two of the major<br />
lithologies in the area, illustrate the effects of Mesozoic<br />
normal faulting, and speculate on the timing of regional<br />
granitoid emplacement. Begin by observing the Tallulah<br />
Falls Formation, exposed at the near side of the pool at the<br />
base of a waterfall. The rock is a porphyroclastic feldspar
gneiss with a matrix of muscovite, biotite and minor garnet<br />
(Figure 4). A few feldspar porphyroclasts are up to 3 cm<br />
long; the deformational foliation strikes E-W and dips 20°N.<br />
Well-developed mineral lineations on foliation plunge 2°/<br />
N78°W. In the cliff across the pool and next to the falls,<br />
note the tectonically modified shapes of pegmatitic layers<br />
(Figure 5).<br />
After examining this outcrop, ascend the steps from<br />
the parking area just west (left) of the outcrop and follow<br />
the trail as it crosses the stream above the falls. It passes a<br />
stone chimney on left, the remains of a CCC-era picnic<br />
shelter. After a few minutes cross a second bridge and turn<br />
west (left) immediately at the end of the bridge. More good<br />
outcrops of Tallulah Falls Formation gneiss occur in the<br />
stream above and below the bridge. In a few minutes, reach<br />
a large (~130 feet long) overhang in biotite gneiss and biotite<br />
augen gneiss. In the course of the walk up the hill from the<br />
second bridge you have crossed a Mesozoic normal fault, a<br />
splay of the Palmetto Cove fault. Tallulah Falls Formation<br />
rocks at the falls and bridge are present on the downthrown<br />
76<br />
(south) side of the fault. Gneisses at the overhang are on<br />
the upthrown (north) side. They are footwall rocks to the<br />
Seneca fault.<br />
At the overhang at the top end of the trail, observe<br />
polydeformed, well-layered biotite gneiss and biotite augen<br />
gneiss with transposed layering and intrafolial, isoclinal<br />
folds. This light-gray, medium-crystalline gneiss consists<br />
of microcline 45%, quartz 30%, biotite 15%, plagioclase<br />
(~An15, oligoclase) 10%, plus minor muscovite, zircon,<br />
apatite, garnet, epidote and titanite. Microcline augen, composed<br />
of coarse, polycrystalline aggregates, occur in a<br />
matrix of finer microcline and quartz (Figure 6a). Aligned<br />
biotite flakes form thin, discontinuous layers that wrap<br />
around microcline augen. In addition to being a major component<br />
of the matrix, quartz forms discontinuous ribbons 3<br />
to 5 cm long composed of coarse, clean quartz with slight<br />
undulatory extinction (Figure 6b). The aforementioned<br />
minor phases occur in close association with biotite.<br />
The biotite augen gneiss at this stop is identical to large<br />
pavement exposures of gneiss at Bald Rock and a small<br />
quarry to the south, both of which we will pass on the way<br />
to Stop 2. Whether the biotite augen gneiss in the central<br />
Cleveland quadrangle is part of the Table Rock Plutonic<br />
Suite or the Henderson Gneiss is unknown at present.<br />
Regionally, Table Rock Plutonic Suite rocks are sill-like<br />
bodies of biotite gneiss that intruded the Henderson Gneiss;<br />
they underlie Caesars Head, Table Rock, and Pinnacle<br />
Mountain. On geologic maps compiled for the Inner<br />
Piedmont, the Table Rock Plutonic Suite forms a thick band<br />
of biotite gneiss that trends NE-SW and continues into North<br />
<strong>Carolina</strong>. There it has been designated as OSgg (Ordovician-<br />
Silurian granitic gneiss; Lemmon and Dunn, 1973a, 1973b,<br />
and 1975). Davis (1993) referred to this same unit in the<br />
Columbus Promontory as the “438 Ma granitoid”, based<br />
on a whole-rock Rb-Sr age of 438 Ma reported by Odom<br />
and Russell (1975). These same authors determined an initial<br />
87 Sr/ 86 Sr ratio of 0.7045 for this biotite gneiss.<br />
Gneiss from the Bald Rock quarry, about 1 ¼ mile<br />
northwest of this locality, was dated using SHRIMP U-Pb<br />
techniques on zircons and rendered a crystallization age of<br />
Late Ordovician (Ranson and others, 1999). In addition,<br />
one zircon from the biotite augen gneiss at Bald Rock quarry<br />
yielded a core age of Middle Proterozoic. The date suggests<br />
that ancient North American crust was involved in the<br />
production of the Table Rock Plutonic suite. Interestingly,<br />
SHRIMP studies of zircons from samples of Tallulah Falls<br />
Formation gneiss from a location in the southern Zirconia<br />
quadrangle, about 9 miles northeast of this locality, provided<br />
a nearly identical Late Ordovician age of crystallization.<br />
Abundant cores in these zircons yielded concordant, Middle<br />
Proterozoic ages, which suggest that Tallulah Falls<br />
Formation rock is a paragneiss derived from an ancient<br />
sedimentary source (Ranson and others, 1999).<br />
Backtrack down the trail to the buses and continue west<br />
on US 276 and SC 11. At 5.3 mi follow US 276 north toward<br />
Brevard, North <strong>Carolina</strong>, as SC 11 continues west into
Pickens County. Follow the winding highway up the<br />
escarpment past exposures of Table Rock gneiss and, at<br />
higher elevations, amphibolite and schist of the Poor<br />
Mountain Formation. Pass the quarry that provided the<br />
sample of biotite augen gneiss for dating at 7.9 mi and Bald<br />
Rock at 8.1 mi. Bald Rock is an extensive exfoliation surface<br />
of contorted biotite augen gneiss containing enclaves of<br />
finely crystalline, poorly foliated mica gneiss. This bald also<br />
provides excellent views of Table Rock and The Stool to<br />
the west and Paris Mountain and Greenville to the southeast.<br />
At 12.6 miles, the crest of the Blue Ridge Front, turn left<br />
into the Caesars Head State Park parking lot.<br />
Stop 2: Caesars Head Overlook and Table Rock gneiss<br />
LOCATION: The stop is located 12.6 mi (20.2 km) west of<br />
Cleveland, South <strong>Carolina</strong>, at Caesars Head State Park<br />
(Figure 3, Table Rock 7.5 minute quadrangle).<br />
DESCRIPTION: This stop provides the opportunity to<br />
examine a typical exposure of gneiss of the Table Rock<br />
Plutonic Suite and to overview the geomorphic features in<br />
the Inner Piedmont foothills south of the Blue Ridge Front.<br />
What determines the location of the escarpment and what<br />
processes have controlled its evolution? Geologic factors<br />
influencing water supplies for the Caesars Head community<br />
have been studied here (see Mitchell, this volume) as well<br />
as at The Cliffs at Glassy community several miles to the<br />
east along the Blue Ridge Front (see Warlick and others,<br />
this volume).<br />
At the Caesars Head overlook, the Table Rock Plutonic<br />
Suite consists of a finely to medium-crystalline biotite<br />
gneiss. It is well foliated but poorly layered; foliation has a<br />
gentle westerly dip. It is isoclinally folded and contains two<br />
77<br />
well-developed joint sets (oriented E-W and N30°W). The<br />
Devil’s Kitchen is a system of passageways produced by<br />
opening along two joint sets. Note a coarsely crystalline<br />
granitoid dike (15 cm wide), which cuts the foliation in the<br />
host gneiss at the ledge near the overlook. Joint surface<br />
shows historic carved graffiti.<br />
The overlook provides a good place to observe the Blue<br />
Ridge Front and the mature topography of rolling hills and<br />
valleys. On clear days many hills are visible to the west,<br />
south and east, erosional remnants of the former position<br />
of the Blue Ridge Front. The largest hill is Paris Mountain,<br />
which lies to the east just north of Greenville, South<br />
<strong>Carolina</strong>. The sweeping view to the southwest provides the<br />
best look at Pinnacle Mountain, Table Rock, and the smaller<br />
hill, The Stool, to the left (Figure 7). Table Rock gneiss<br />
similar to that exposed here makes up most of these three<br />
mountains, although thin klippen of Poor Mountain<br />
Formation ampbibolite cap the top of each. The Table Rock<br />
Reservoir below the shear cliff was built in 1925, and it is<br />
part of the water supply for the city of Greenville. The large<br />
valley west of Caesars Head represents an embayment into<br />
the Blue Ridge Front produced by the headward erosion of<br />
Matthews Creek (Figure 8). Near its headwaters Matthews<br />
Creek forms an impressive falls, called Raven Cliff Falls,<br />
as the stream plunges 420 feet (128 m) down the escarpment.<br />
Return to buses and turn north (left) back on to US<br />
276. At 14 miles pass the trailhead for Raven Cliff Falls<br />
and points west and east along the Mountain Bridge trail<br />
system. Continue to mile 15.3, the SC-NC state line and<br />
the eastern Continental Divide (2910 feet or 887 m). Turn<br />
east (right) on to Solomon Jones Road (S-23-15). Proceed<br />
for another 3.4 miles to a roadside exposure on the north<br />
(left) side of the road. The view to the south (right) is known<br />
as Mulligans View.
Stop 3: Seneca fault exposed at Mulligans View<br />
LOCATION: The stop is 18.8 mi (30.1 km) north of<br />
Cleveland, South <strong>Carolina</strong> near Camp Greenville (Figure<br />
9, Standingstone Mountain 7.5 minute quadrangle).<br />
DESCRIPTION: This exposure and that at Camp Greenville<br />
are described in detail by Garihan (this volume, Figure 5, A<br />
and B). At Mulligans View, Poor Mountain Formation<br />
amphibolite and schist are thrust along the Seneca fault over<br />
gray, saprolitic Table Rock gneiss (Figure 10).<br />
Subsequently, the Seneca fault then was folded and broken<br />
by three thrust faults (right or NE side of outcrop; compare<br />
to Figure 5A in Garihan, this volume). At the far right side<br />
of the outcrop, pegmatite was thrust westward over<br />
amphibolite. Note pervasive, tight, overturned folds.<br />
At Stop 2 we have the opportunity to examine a typical<br />
exposure of Poor Mountain Formation amphibolite. The<br />
amphibolite is a dark, medium-crystalline rock composed<br />
78<br />
of 45% hornblende, 35% plagioclase (andesine), 10%<br />
quartz, 5% epidote plus 5% other phases (titanite, garnet,<br />
opaques, biotite). Prismatic hornblende crystals, generally<br />
1-2 mm in length, lie in the plane of foliation and alternate<br />
with thin layers of plagioclase ± quartz (Figure 11).<br />
Characteristically the amphibolite has a slabby appearance<br />
on the outcrop and weathers to a brown or maroon saprolite.<br />
The Table Rock gneiss, here mostly saprolite, is finely<br />
crystalline, well layered (on a millimeter scale), and has<br />
flattened quartz-feldspar lenses.<br />
Proceed 1.7 miles through the entrance to YMCA Camp<br />
Greenville to the end of the road. Please drive slowly and<br />
watch for campers. This is private property.<br />
Stop 4: Symmes Chapel and panorama of Middle Saluda<br />
River valley<br />
LOCATION: The stop is located 20.5 mi (32.8 km) north<br />
of Cleveland, South <strong>Carolina</strong>, at Camp Greenville (Figure<br />
9, Standingstone Mountain 7.5 minute quadrangle).<br />
DESCRIPTION: Symmes Chapel, also know as Pretty<br />
Place, is a favorite spot for weddings. Of incidental concern<br />
to brides and grooms are fresh outcrops of folded, jointed<br />
Table Rock gneiss directly in front of the chapel. Please be<br />
careful and stay off the outcrops – dangerous cliff! The<br />
pillars of the chapel are constructed of blocks and slabs of<br />
quartz-ribbon gneiss with mylonitic textures.<br />
The view looks east down the linear Middle Saluda<br />
River drainage and roughly parallel to the Blue Ridge Front.<br />
The Cliffs at Glassy (see Warlick and others, this volume)<br />
are in the far distance. Part of the North Saluda (Poinsett)<br />
Reservoir is visible. The trace of the Seneca fault occurs at<br />
about 2400 feet elevation on both valley walls. The similar<br />
elevation of the trace on both valley walls indicates that no<br />
fault substantially offsets the Seneca fault in the valley.<br />
Nonetheless, the existence of some microbreccia float there<br />
is suspicious. The floor of the valley, 2 mi to the east near<br />
River Falls community, is underlain by biotite augen gneiss,<br />
probably Henderson Gneiss. Geologic relationships north<br />
of there along the Falls Creek trail (#31) below Cedar Rock<br />
Mountain clearly show that the biotite augen gneiss lies<br />
below the sill-like body of Table Rock gneiss, which dips<br />
gently to moderately northeast (Figure 1).<br />
Return in vehicles approximately one mile to parking<br />
area next to Camp Greenville airnasium – yes, that is its<br />
name! – where we will park the buses for lunch. Walk west<br />
along the road and up the steps by Stop 5 to the camp dining<br />
hall.<br />
Stop 5: Small klippe of Seneca fault, Camp Greenville<br />
LOCATION: The stop is located at Camp Greenville along<br />
Solomon Jones Road and in an adjacent fenced area<br />
originally excavated as a parking lot. The exposures are 21.4<br />
mi (34.2 km) cumulative miles from our starting point in
Cleveland, South <strong>Carolina</strong> (Figure 9, Standingstone<br />
Mountain 7.5 minute quadrangle).<br />
DESCRIPTION: A set of exposures illustrating the outcropscale<br />
structural complexity along the Seneca fault occurs<br />
below the camp dining hall. Please, no hammers or digging!<br />
A complete description and interpretation of relationships<br />
is provided elsewhere (see Garihan, this volume, Figure 5B).<br />
Solomon Jones Road here intersects a klippe of the<br />
Seneca fault, an erosional remnant of the Six Mile thrust<br />
sheet. The main trace of the Seneca fault lies north of Camp<br />
79<br />
Greenville (Figure 1). The road cut and fenced exposure<br />
show Poor Mountain Formation amphibolite and schist in<br />
thrust contact with gray, finely crystalline, saprolitic Table<br />
Rock gneiss. To the right of the stairs and behind the fence,<br />
the Seneca fault contact is sharp but gently curved along a<br />
ramp, essentially parallel to the foliation in the gneiss below<br />
(Figure 12). A schist layer
odies in schist (boudins ?). Two thrusts have duplicated<br />
Poor Mountain Formation amphibolite, hornblende gneiss<br />
and schist.<br />
The road cut to the left of the stairs shows the trace of<br />
the Seneca fault, now dropped down with respect to the<br />
right-hand outcrop by a small brittle fault (Garihan, this<br />
volume, his Figure 6). The Seneca fault is multiply folded<br />
(Figure 14). Two overturned folds in the thrust surface are<br />
oriented 5°-15°/N10°-30°E. Younger, open, antiformal and<br />
synformal folding of the thrust surface is oriented 9°/N32°E.<br />
The folding here is coaxial (Garihan and Ranson, 1999).<br />
Walk east back along the road to the buses and then<br />
backtrack along Solomon Jones Road to US 276. Turn south<br />
(left) onto US 276 and continue past Caesars Head State<br />
Park down the escarpment to the junction with SC 8 at 35<br />
mi (56 km). Bear right onto SC 8, leaving US 276. SC 8<br />
joins SC 11 at a stop sign at 36.4 mi (58.2 km), and we turn<br />
80<br />
west (right). Shortly thereafter SC 8 turns south (left)<br />
towards Easley and Pickens; continue straight on SC 11. At<br />
41.7 mi (66.7 km) turn north (left) onto West Gate Road<br />
(S-39-25), the western approach to Table Rock State Park.<br />
Bear left at the fork and reach the gatehouse at the entrance<br />
to the park at 42.2 mi (67.5 km). Bear right beyond the<br />
gatehouse by some low exposures of amphibolite and<br />
continue to 42.9 mi (68.6 km) and a parking area on the<br />
right, just west of Pinnacle Lake. This spot will serve as a<br />
convenient place for refreshments and rest rooms. Walk<br />
north to the Carrick Creek Interpretive Center, which marks<br />
the trailhead for Stop 6.<br />
Stop 6: Gneisses at Carrick Creek and Green Creek<br />
LOCATION: The stop is located in Table Rock State Park<br />
and consists of a short (1.7 mi roundtrip) hike along the<br />
Carrick Creek Nature Trail. The hike begins at the Carrick<br />
Creek Interpretive Center at 42.9 mi (68.6 km) cumulative<br />
from the beginning of the road log (Figure 15, Table Rock<br />
7.5-minute quadrangle). This point marks the eastern<br />
terminus of the Foothills Trail.<br />
DESCRIPTION: The scenic walk along Carrick Creek<br />
passes through outcrops of Table Rock gneiss, eventually<br />
to an exposure of augen gneiss in Green Creek. The<br />
description below highlights several localities along the way.<br />
Start on a paved path from the interpretive center and<br />
proceed to a broad area along the creek with large blocks of<br />
Table Rock gneiss. To the right, across the stream and below<br />
the ten-foot waterfall is an exposure of folded biotite gneiss<br />
(Figure 16) with fold axis plunging 20°/N40°E. A mineral<br />
lineation occurs on the foliation and plunges 4°/ N60°E.<br />
The rock is finely layered Table Rock gneiss with thin layers<br />
of biotite separating finely crystalline feldspar-quartz layers,<br />
which weather out in relief. Continue along the trail up steps
to a large pavement exposure on the west (left) bank of the<br />
stream. Note that the dip of the foliation reverses here;<br />
upstream from this point the gneiss dips upstream, and<br />
downstream from this point the gneiss dips gently<br />
downstream. This outcrop exposes the core of an open<br />
antiform, the axis of which plunges gently toward N45°E.<br />
Well-developed mineral lineations parallel the fold hinge<br />
and plunge at 5°/N45°E.<br />
Returning to the trail, cross a 30-foot wooden bridge<br />
with handrails where the stream locally runs along foliation,<br />
forming trough-like features in the bedrock. About 150 feet<br />
farther, reach a fork in the trail marking the junction of the<br />
Foothills Trail (continuing on to Pinnacle Mountain) with<br />
the Carrick Creek loop trail and the trail to the summit of<br />
Table Rock. Take the Table Rock trail to the right marked<br />
with red and green blazes. The Foothills Trail to Pinnacle<br />
and the Table Rock trail are highly recommended in terms<br />
of scenery and geology. Both trails are strenuous and, at<br />
higher elevations, traverse klippen of Poor Mountain<br />
Formation amphibolite of the Six Mile thrust sheet.<br />
Cross through an area of no exposure before<br />
encountering more rock ledges and small falls in the brook.<br />
At the big falls to the left of the trail, a small alcove in the<br />
rock displays a tight, reclined fold in amphibolite. The fold<br />
plunges 8°/ N40°E, an orientation that parallels the dominant<br />
lineation on foliation here. We interpret this folded<br />
amphibolite as an amphibolite layer in Table Rock gneiss<br />
rather than Poor Mountain Formation amphibolite of the<br />
81<br />
Six Mile thrust sheet. Indeed, many such amphibolite<br />
layers intimately infolded with Table Rock gneiss occur<br />
on the slopes of Pinnacle Mountain and The Stool. A set<br />
of exposures on the east side of The Stool displays litpar-lit<br />
intrusion of Table Rock Plutonic Suite magmas<br />
into mafic rocks, with subsequent metamorphism and<br />
multiple deformation (Figure 17). Geochemical and<br />
geochronological studies of the various amphibolites are<br />
needed to better understand their relationships. The host<br />
gneiss here consists of the familiar finely crystalline
quartz-feldspar layers, separated by thin biotite horizons.<br />
Just beyond the fold in amphibolite, the trail crosses<br />
Green Creek via a wooden bridge. The bedrock through<br />
which the stream flows at the bridge is a biotite augen gneiss<br />
that appears as a NE-SW lenticular body on the map (Figure<br />
1). Be careful, the rock is slippery! At least two<br />
interpretations are possible. The augen gneiss may represent<br />
1) an augen-bearing phase of the Table Rock gneiss or 2)<br />
rock into which the Table Rock Plutonic Suite was intruded.<br />
If the latter is true, this augen gneiss is the Henderson Gneiss,<br />
abundant to the west in the Eastatoe Gap quadrangle. The<br />
half-day trip on Sunday will examine features in the<br />
Henderson Gneiss.<br />
This outcrop marks the end of the traverse. Backtrack<br />
down the trail to the vehicles for the return trip to Greenville.<br />
Leave Table Rock State Park by the West Gate Road and<br />
turn east (left) at the intersection with SC 11. At 49 mi (78.4<br />
km) turn south (right) on SC 8 towards Pumpkintown. Reach<br />
the intersection with SC 288 at the four-way stop in<br />
Pumpkintown at 52.7 mi (84.3 km) and turn east (left) onto<br />
SC 288. In Marietta, SC join US 276 at 69.7 mi (111.5 km)<br />
and turn south (right) towards Travelers Rest and Greenville.<br />
SUNDAY SCHEDULE<br />
Participants may choose between a field trip to the<br />
Eastatoe Gap quadrangle and a workshop held at Furman<br />
University. The field trip, led by Jack Garihan and Bill<br />
Ranson, will consist of an approximately two-hour hike<br />
along the Foothills Trail just west of Sassafras Mountain in<br />
the Eastatoe Gap 7.5-minute quadrangle. The purpose of<br />
the trip is to show participants a variety of mylonitic<br />
structures and textures in the Henderson Gneiss, which<br />
covers three-quarters of the Eastatoe gap quadrangle. The<br />
workshop, led by Brannon Andersen and Ken Sargent, will<br />
focus on the Enoree River watershed near Greenville, South<br />
<strong>Carolina</strong>. The purpose of the workshop is to introduce<br />
82<br />
participants to various aspects of the River Basin Research<br />
Initiative (RBRI) at Furman University. It will highlight<br />
ways to facilitate undergraduate research on watersheds,<br />
multidisciplinary approaches, methods of sample collection<br />
and analysis, and results of the current study, with<br />
implications for regional development and planning.<br />
SUNDAY ROADLOG<br />
The road log begins at a four-way stop marking the<br />
intersection of highways US 178 (Moorefield Memorial<br />
Highway) and SC 11 north of Pickens, South <strong>Carolina</strong><br />
(Sunset 7.5-minute quadrangle). Follow curvy US 178 north<br />
up the Blue Ridge Front past Bob’s Place (featured by Time<br />
Magazine during the 2000 presidential election) at 3.2 mi.<br />
Reach Rocky Bottom, South <strong>Carolina</strong> at 7.1 mi. No<br />
stoplights exist in the Eastatoe Gap quadrangle! Turn east<br />
(right) onto F. Van Clayton Highway, a rough, tertiary road<br />
despite the “highway” designation, and continue to the<br />
Chimneytop Gap parking area (8.5 mi). The intersection of<br />
F. Van Clayton Highway with the Foothills trail is well<br />
marked and is just south of the crest of the saddle. A parking<br />
area is approximately 100 m straight ahead (north) along<br />
the road, downhill from the saddle. The hike begins at the<br />
sign that displays a map of the area.<br />
Stop 7: Henderson Gneiss along the Foothills Trail<br />
LOCATION: The stop is located along the Foothills trail<br />
between Chimneytop Gap and US 178 8.5 mi (13.6 km)<br />
from the beginning of the Sunday road log (Figure 18,<br />
Eastatoe Gap 7.5-minute quadrangle).<br />
DESCRIPTION: The field trip will follow the Foothills Trail<br />
southwest for approximately 2 mi (3.2 km). The Foothills<br />
Trail is 76 mi (125 km) long and traverses the Blue Ridge<br />
Front through northwestern South <strong>Carolina</strong> and adjacent<br />
North <strong>Carolina</strong> (Figure 19). It runs from Table Rock State<br />
Park (at the trailhead visited on Saturday as part of Stop 6)<br />
westward to Oconee State Park. The middle section of the<br />
trail is very remote and wanders just north of Lake Jocassee<br />
in recently acquired State land designated as the Jocassee<br />
Gorges area. The trail at this point is about 2 km westsouthwest<br />
of Sassafras Mountain (elevation 1084 m or 3554<br />
ft), the highest point along the trail and indeed the highest<br />
point in South <strong>Carolina</strong>. The Foothills trail is marked with<br />
white blazes, but participants should be aware of several<br />
unmarked trails that branch off of the main, well-traveled<br />
trail. Hikers are cautioned to be aware that leafy trails may<br />
be slippery! The discussion below describes features of<br />
interest en route along the trail with emphasis and more<br />
detail on two main exposures. These outcrops will be marked<br />
with flagging.<br />
The trail begins by ascending moderately from<br />
Chimneytop Gap along the south side of the ridge. For most<br />
of its length between here and the terminus of the morning’s
Inc., PO Box 3041, Greenville, SC 29602.<br />
hike at the Laurel Valley parking area on US 178, the trail<br />
trends southwesterly (Figure 18). There are, however,<br />
several notable switchbacks. Just a few tens of meters up<br />
the trail encounter saprolitic Henderson Gneiss with welldeveloped<br />
joints about 30 cm apart. The trail follows along<br />
the base of this Henderson Gneiss ledge. Pass occasional<br />
blocks of mylonitic granitic pegmatite (Figure 20) in the<br />
path before coming upon a 1.6-foot ledge of mylonitic<br />
pegmatite above the trail. The mylonitic pegmatite has a<br />
slightly discordant contact with well-foliated Henderson<br />
Gneiss here. Just beyond these outcrops the trail begins to<br />
descend.<br />
After the descent the trail ascends again along a<br />
prominent exposure of Henderson Gneiss, with mylonitic<br />
pegmatite 3.2 to 6.4 feet wide. At about 0.6 mile, descend<br />
stairway footbridge across a deep ravine adjacent to<br />
prominent ledges of Henderson Gneiss. Caution – slippery<br />
if leafy! This stairway is the first of four footbridges. These<br />
ledges display S-C structures indicating the rock above<br />
individual C-surfaces has moved to the southwest (Figure<br />
21); lineation on foliation plunges 2°/N38°E. Pass through<br />
open growths of rhododendron and laurel, eventually<br />
reaching a steep descent via wooden stairs. The trail here<br />
descends along a curved (N55°-65°W) joint face bounding<br />
a ledge of Henderson Gneiss. Descend into a more open<br />
valley with prominent outcrops of mylonitic Henderson<br />
Gneiss on the northwest (right) side of the trail. Flagging<br />
84<br />
rd Edition published by The Foothills Trail Conference,<br />
will indicate an overhang with features of particular interest.<br />
No hammers, please! At the overhang Henderson Gneiss<br />
displays mylonitic foliation (N32°E, 15°SE), quartzofeldspathic<br />
ribbons (Figure 22), and a well-developed<br />
lineation plunging 1°/ N15°E (Figure 23). Examine blocks<br />
of gneiss that have fallen from the overhang. A view<br />
perpendicular to lineation shows more ovoid, discrete augen,<br />
while parallel to lineation one sees continuous quartzofeldspathic<br />
ribbons (Figure 22). Mylonitic S and C surfaces<br />
form a shallow dihedral angle.<br />
Follow the trail as it continues into the flat bottom area,<br />
crossing a flowing stream on a wooden bridge. Quartz float<br />
is abundant along the trail as you pass through a more open,<br />
younger growth woods. The trail continues southwest,<br />
traversing several spurs and intervening valleys and crossing<br />
two small foot bridges before reaching a substantial cliff<br />
exposure on the north (right) side of the trail (Figure 24).<br />
This outcrop is the second flagged stop on our walk.<br />
This south-facing exposure is rounded by exfoliation,<br />
and large flat pieces of rock have moved downslope just<br />
below the path. Venture up to the overhang, but be careful<br />
of slippery, leafy surfaces! Here is an excellent place to see<br />
fresh, gray Henderson Gneiss with strongly mylonitic<br />
texture both parallel and perpendicular to nearly horizontal<br />
lineation (plunges 1°/N40°E). Feldspar augen, generally<br />
85<br />
ribbons. Mesoscopic S and C surfaces are present (S oriented<br />
N27°W, 18°NE and C oriented N14°E, 7°NW). Winged<br />
augen and S-C structures indicate rock above C surfaces<br />
moved to the southwest; that is, sinistral motions.<br />
Continuing to the east along the ledge, note aplitic veins<br />
10-15 cm wide. They are discordant to foliation, and some<br />
have pegmatitic cores.<br />
This outcrop marks the last stopping point on our<br />
traverse. Continuing southwestward, the path descends<br />
across spurs, by intermittent ledges of Henderson Gneiss,<br />
and through drainages with several switchbacks. As US 178<br />
is approached, the trail gently ascends to a saddle before<br />
switching back to the north. Cross the stream on the last<br />
wooden bridge and head west a short distance to US 178.<br />
Carefully cross the highway at the bridge to the gravel area<br />
where the vehicles are parked. Stream-worn Henderson<br />
Gneiss occurs beneath the highway bridge.
REFERENCES<br />
Davis, T. L., 1993, Geology of the Columbus Promontory,<br />
western Inner Piedmont, North <strong>Carolina</strong>, southern<br />
Appalachians, in R. D. Hatcher, Jr. and T. L. Davis<br />
(editors), Studies of Inner Piedmont geology with a<br />
focus on the Columbus Promontory: <strong>Carolina</strong> <strong>Geological</strong><br />
<strong>Society</strong> Annual Field Trip Guidebook, p.17-43.<br />
Garihan, J. M., 1999a, The Sugarloaf Mountain thrust in<br />
the western Inner Piedmont between Zirconia, North<br />
<strong>Carolina</strong> and Pumpkintown, South <strong>Carolina</strong>, in A<br />
Compendium of Selected Field Guides, <strong>Geological</strong><br />
<strong>Society</strong> of America, Southeastern Section Meeting,<br />
March 1999, 17 p.<br />
Garihan, John M., 1999b, The Sugarloaf Mountain thrust<br />
in upstate South <strong>Carolina</strong>: <strong>Geological</strong> <strong>Society</strong> of<br />
America Abstracts with Programs, v. 31, n. 3, p. A-16.<br />
Garihan, J. M., W. A. Ranson, K. A. Orlando, and M. S.<br />
Preddy, 1990, Kinematic history of Mesozoic faults in<br />
northwestern South <strong>Carolina</strong> and adjacent North<br />
<strong>Carolina</strong>: South <strong>Carolina</strong> Geology, v. 33, p. 19-32.<br />
Garihan, J. M., M. S. Preddy, and W. A. Ranson, 1993,<br />
Summary of mid-Mesozoic brittle faulting in the Inner<br />
Piedmont and nearby Charlotte belt of the <strong>Carolina</strong>s,<br />
in R. D. Hatcher, Jr. and T. L. Davis (editors), Studies<br />
Promontory: <strong>Carolina</strong> <strong>Geological</strong> <strong>Society</strong> Annual Field<br />
TripGuidebook, p. 55-65.<br />
Garihan, John M., and William A. Ranson, 1999, Road log<br />
and descriptions of stops in parts of the Table Rock,<br />
Cleveland, and Standingstone Mountain quadrangles,<br />
SC-NC, in A Compendium of Selected Field Guides,<br />
<strong>Geological</strong> <strong>Society</strong> of America, Southeastern section<br />
Meeting, March 1999, 9 p.<br />
Griffin, V. S., Jr., 1974, Analysis of the Piedmont in<br />
northwestern South <strong>Carolina</strong>: <strong>Geological</strong> <strong>Society</strong> of<br />
America Bulletin, v. 85, p. 1123-1138.<br />
Haselton, George M., 1974, Some reconnaissance<br />
geomorphological observations in northwestern South<br />
<strong>Carolina</strong> and adjacent North <strong>Carolina</strong>: Geologic Notes,<br />
Division of Geology, South <strong>Carolina</strong> State<br />
Development Board, v. 18, n. 4, p. 60-74.<br />
Hatcher, Robert D., Jr., 1987, Tectonics of the southern and<br />
central Appalachian internides: Annual Review of Earth<br />
and Planetary Sciences, v. 15, p. 337-362.<br />
Hatcher, Robert D., Jr., 1993, Perspective on the tectonics<br />
of the Inner Piedmont, southern Appalachians, in R.<br />
D. Hatcher, Jr. and T. L. Davis (editors), Studies of Inner<br />
Piedmont Geology with a focus on the Columbus<br />
Promontory: <strong>Carolina</strong> <strong>Geological</strong> <strong>Society</strong> Annual Field<br />
Trip Guidebook, p. 1-16.<br />
Hatcher, Robert D., Jr., 1998, Structure of the Appalachian<br />
Inner Piedmont: <strong>Geological</strong> <strong>Society</strong> of America<br />
Abstracts with Programs, v. 30, no. 4, p. 17.<br />
Hatcher, Robert D., Jr., 1999, Geotraverse across part of<br />
the Acadian orogen in the southern Appalachians: in A<br />
Compendium of Selected Field Guides, <strong>Geological</strong><br />
86<br />
<strong>Society</strong> of America, Southeastern section Meeting,<br />
March 1999, 22 p.<br />
Hatcher, Robert D., Jr., and Steven A. Goldberg, 1991, The<br />
Blue Ridge geologic province, in J. Wright Horton and<br />
Victor A. Zullo (editors), The Geology of the <strong>Carolina</strong>s:<br />
Knoxville, Tennessee, University of Tennessee Press,<br />
p. 11-35.<br />
Horton, J. W., Jr., A. A. Drake, Jr., and D. W. Rankin, 1989,<br />
Tectonostratigraphic terranes and their Paleozoic<br />
boundaries in the central and southern Appalachians<br />
in R. D. Dallmeyer (editor), Terranes in the circum-<br />
Atlantic Paleozoic orogens. <strong>Geological</strong> <strong>Society</strong> of<br />
America Special Paper 230, p. 213-245.<br />
Lemmon, R. E., and D. E. Dunn, 1973a, Geologic map and<br />
mineral resources of the Bat Cave quadrangle, North<br />
<strong>Carolina</strong>: North <strong>Carolina</strong> Department of Natural<br />
Resources and Community Development Map GM 202<br />
NW. 1:24,000.<br />
Lemmon, R.E., and D.E. Dunn, 1973b, Geologic map and<br />
mineral resources of the Fruitland quadrangle, North<br />
<strong>Carolina</strong>: North <strong>Carolina</strong> Department of Natural<br />
Resources and Community Development Map GM 202<br />
NW. 1:24,000.<br />
Lemmon, R.E., and D.E. Dunn, 1975, Origin and geologic<br />
history of the Henderson Gneiss from Bat Cave andb<br />
Fruitland quadrangles, western North <strong>Carolina</strong>:<br />
<strong>Geological</strong> <strong>Society</strong> of America Abstracts with<br />
Programs, v. 7, p. 509.<br />
Nelson, A. E., J. W. Horton, Jr., and J. W. Clarke, 1998,<br />
Geologic map of the Greenville 1° x 2° quadrangle,<br />
Georgia, South <strong>Carolina</strong>, and North <strong>Carolina</strong>: U. S.<br />
<strong>Geological</strong> Survey Miscellaneous <strong>Geological</strong><br />
Investigations Map I-2175, 1:250,000.<br />
Odom, A. L., and G. S. Russell, 1975, The time of regional<br />
metamorphism of the Inner Piedmont, North <strong>Carolina</strong>,<br />
and Smith River allochthon: Inference from whole-rock<br />
ages: <strong>Geological</strong> <strong>Society</strong> of America Abstracts with<br />
Programs, v. 7, p.522-523.<br />
Rankin, D. W., 1988, The Jefferson terrane of the Blue Ridge<br />
tectonic province: An exotic accretionary prism.<br />
<strong>Geological</strong> <strong>Society</strong> of America Abstracts with<br />
Programs, v. 20, no. 4, p. 310.<br />
Ranson, W. A., I. S. Williams, and J. M Garihan, 1999,<br />
Shrimp zircon U-Pb ages of granitoids from the Inner<br />
Piedmont of South <strong>Carolina</strong>: Evidence for Ordovician<br />
magmatism involving mid to late Proterozoic crust:<br />
<strong>Geological</strong> <strong>Society</strong> of America Abstracts with<br />
Programs, v. 31, no. 6, p. A-167.<br />
Williams, H., and Robert D. Hatcher, Jr., 1982, Suspect<br />
terranes and accretionary history of the southern<br />
Appalachian orogen: Geology, v. 10, p. 530-536.<br />
Williams, H., and Robert D. Hatcher, Jr., 1983, Appalachian<br />
suspect terranes, in R. D. Hatcher, Jr., H. Williams, and<br />
I. Zietz (editors), Contributions to the tectonics and<br />
geophysics of mountain chains: <strong>Geological</strong> <strong>Society</strong> of<br />
America Memoir 158, p. 33-53.
South <strong>Carolina</strong> Geology, 2001, v. 43, p. 87 – 88.<br />
HYDROLOGY, BIOGEOCHEMISTRY AND LAND-USE PLANNING IN THE<br />
ENOREE RIVER BASIN, NORTHWESTERN <strong>SOUTH</strong> <strong>CAROLINA</strong>: A<br />
WORKSHOP ASSOCIATED WITH THE 2001 <strong>CAROLINA</strong> GEOLOGICAL<br />
SOCIETY MEETING<br />
THE RIVER BASIN RESEARCH INITIATIVE AT<br />
FURMAN UNIVERSITY<br />
The departments of Earth and Environmental Sciences,<br />
Biology, and Chemistry began the River Basin Research<br />
Initiative in 1996 with an EPA-funded study focused on the<br />
impact of development in a 3 km 2 mountainous watershed<br />
near the Furman campus. In 1998 the study expanded to<br />
the Enoree River, and in 1999 grants from Research<br />
Experiences for Undergraduates program of the National<br />
Science Foundation (NSF-REU) and from the S.C.<br />
Department of Health and Environmental Control (DHEC)<br />
and U.S. Environmental Protection Agency (EPA) allowed<br />
the study to expand to the entire Enoree River basin and<br />
parts of the Saluda River basin. Current support for the<br />
2001 summer and 2001/02 academic year program will<br />
come from grants from DHEC, NSF, the Associated<br />
Colleges of the South Environmental Initiative and from<br />
The Rockefeller Brothers Fund.<br />
The long-term goal of this research program is the<br />
systematic characterization of both pristine and urban<br />
watersheds to develop an understanding of the extent of<br />
human impact on river systems in the Lower Broad River<br />
Basin in the upstate region of South <strong>Carolina</strong>. The lower<br />
Broad River basin is located within the Santee Hydrologic<br />
Unit, which is a part of the U.S. <strong>Geological</strong> Survey (USGS)<br />
National Water Quality Assessment Program (NAQWA).<br />
In South <strong>Carolina</strong>, the lower Broad River basin is subdivided<br />
into the Saluda, Enoree, Pacolet and Tyger River basins.<br />
The Greenville-Spartanburg metropolitan area, one of the<br />
fastest growing metropolitan areas in the country, is located<br />
in the headwater region of the Lower Broad River Basin.<br />
As a result, water quality and water resource issues are of<br />
increasing importance to the local community as well as to<br />
the communities in the downstream portion of the Broad<br />
River – Santee River Basin, some of which utilize these<br />
rivers as a source of drinking water.<br />
This research has focused on water quality surveys of<br />
the Enoree River and nine of its tributary watersheds, the<br />
87<br />
Reedy River watershed, and four tributary watersheds of<br />
the Saluda River in the Saluda River Basin. Water quality<br />
data collected from each watershed include chemical data<br />
(seven cations including selected trace metals, seven anions,<br />
and alkalinity), conductivity, dissolved oxygen, temperature,<br />
and fish and aquatic insect abundance and diversity.<br />
Selected sites have been sampled for total and fecal coliform<br />
bacteria and heterotrophic bacteria. This is the first<br />
comprehensive survey of chemical and biological water<br />
quality parameters in the upstate region of South <strong>Carolina</strong>.<br />
The Department of Health and Environmental Control in<br />
South <strong>Carolina</strong> uses these data to help develop total<br />
maximum daily loads (TMDL) for the Enoree and Saluda<br />
River Basins.<br />
BIOGEOCHEMISTRY OF RIVERS<br />
Initial analysis of the water chemistry data suggests<br />
that weathering processes are the primary control over the<br />
chemical composition of stream water (Andersen and others,<br />
in preparation). The bedrock in the northern regions of the<br />
watersheds consists of high-grade metamorphic rocks that<br />
have minerals with low solubility. As a result, these streams<br />
have waters with low total dissolved solids that are subject<br />
to subtle, non-point source pollution from septic tanks and<br />
atmospheric deposition, as well as point sources such as<br />
primarily sewage treatment effluent and industrial discharge.<br />
Streams in urban areas have significantly higher nitrate<br />
concentrations than streams in forested regions.<br />
Surprisingly, however, these urban watersheds often have<br />
excellent water quality from a chemical perspective (other<br />
than nitrate), but relatively poor biodiversity. In contrast,<br />
sewage treatment effluent from point sources has a major<br />
impact on the water quality of streams in the Enoree and<br />
Saluda River Basins, although it may cause an increase in<br />
biodiversity. Additionally, several streams have both water<br />
and sediment contaminated with heavy metals from spills<br />
that occurred as long as twenty years ago.
LAKE CONESTEE PROJECT<br />
Six miles south of Greenville, down the Reedy River,<br />
is the mill village of Conestee. The millpond, the mill and<br />
the village to house the mill’s workers were constructed in<br />
the 1830s by Vardry McBee, one of Greenville’s early<br />
leaders. The millpond, Lake Conestee, once beautiful<br />
indeed, has vanished over the last 60 years. During the<br />
1940s and ‘50s, a time with no erosion and sediment control<br />
regulations, the construction of Greenville Army Air Base<br />
(Donaldson) and I-85 contributed enormous volumes of<br />
sediment to Lake Conestee. Likewise, the post-World-War-<br />
WII conversion of what had been a predominantly<br />
agricultural watershed to one that is now saturated with<br />
urban and suburban development contributed many<br />
thousands of tons of silt to Lake Conestee. The lake, once<br />
145 acres, with two named islands, is now over 95 percent<br />
silted in.<br />
The dam, rebuilt in 1926, is in good condition. When<br />
the Reedy’s waters back up behind the dam, fewer than 18<br />
acres are covered with water no more than waist-deep.<br />
Aerial photographs taken since the 1940s show that as the<br />
Reedy’s sediments progressively filled the lake, wetlands<br />
have evolved and bottomland forests have colonized quickly<br />
in the silt deposits. With the wetlands and forests came a<br />
wide diversity of wildlife: abundant waterfowl, shorebirds,<br />
and songbirds, and deer, beaver, foxes and otters. Portions<br />
of the lake are now occupied by a community of beavers.<br />
Along with sediments from upstream, the residues from<br />
the 65 square miles of the Reedy’s watershed upstream and<br />
from the last hundred years of Greenville’s industrial and<br />
population growth have been deposited in the lake. Beneath<br />
the wetlands and the forests of Lake Conestee, thoroughly<br />
mixed in with the silt, are the dregs of Greenville’s prosperity.<br />
Present in the sediments are metals from textile dyeing<br />
and electroplating operations, PCBs, hydrocarbon derivatives<br />
from our automobile society, pesticides from former<br />
agricultural operations and from our manicured lawns and<br />
much wastewater sludge from years of minimal waste treatment<br />
upstream. A walk across the forested lake flats reveals<br />
an abundance of trash from upstream, and with every new<br />
flooding event, tons more are deposited from Greenville’s<br />
runoff. The lake has performed an important function<br />
filtering and trapping many of the contaminants that would<br />
have otherwise been flushed on down the Reedy to Lake<br />
Greenwood (water supply for much of Greenwood County)<br />
and to Columbia and to the Congaree and Santee Rivers.<br />
88<br />
A non-profit organization, ‘The Conestee Foundation’,<br />
has the purpose of acquiring the lake and rehabilitating it<br />
into a resource for recreation, wildlife habitat and<br />
environmental education. In September of 2000, the<br />
Conestee Foundation acquired the lake and dam, using<br />
monies from South <strong>Carolina</strong>’s Colonial Pipeline Settlement.<br />
Among the most important first steps in the rehabilitation<br />
of the lake is assessing the contaminants in the lake, to<br />
address the question, “Are there any imminent threats to<br />
human health or the environment due to residual<br />
contamination in the sediments?” This is an involved<br />
technical process that involves state and federal agencies<br />
and significant expense. We expect to find contamination,<br />
and from past experience with similar contaminated sites<br />
around the country, the likely best solution to managing the<br />
sediments is to keep them exactly where they are.<br />
Last year the obstruction in the dam that was holding<br />
back the waters of Lake Conestee gave way and the lake<br />
completely drained, allowing on the order of 90,000 cubic<br />
yards of lake sediments to escape. This past summer, thanks<br />
to technical assistance from the Foothills Resource<br />
Conservation & Development Council, its NRCS staff, the<br />
Greenville County Soil and Water Conservation District<br />
team, and an Emergency Watershed Protection Grant from<br />
NRCS, with non-federal support from DHEC, a 10-ft- by<br />
14-ft timber gate was positioned against the stone-masonry<br />
dam to cover the orifice, which formerly fed the pinstock<br />
to the former hydroelectric plant. The lake refilled in a<br />
couple of days.<br />
A plan for Lake Conestee, beyond providing<br />
maintenance on the aging dam and securing the<br />
contaminated sediments, is to convert most of the extensive<br />
wetlands and beaver ponds into managed wetlands for<br />
wildlife habitat, install recreational hiking trails and<br />
boardwalks and a paddling trail, and convert the entire<br />
property into publicly accessible green space for birding<br />
and nature study. We also plan to construct an environmental<br />
education center.<br />
Greater Greenville area has an ethical obligation to<br />
address our past neglect of the Reedy and, equally<br />
importantly, our neighbors downstream. We also see Lake<br />
Conestee as a valuable resource to the Greenville<br />
community, as a public greenspace, park, wildlife sanctuary<br />
and as an educational opportunity with endless lessons on<br />
stewardship of the environment.