- Page 3 and 4:
SERBIAMULTIPLE INDICATORCLUSTER SUR
- Page 5 and 6:
AcknowledgementsA number of people
- Page 7 and 8:
List of Tables30 Table HH.1Results
- Page 9 and 10:
157 Table ED.3Primary school entry,
- Page 11 and 12:
277 Table SE.2RSampling errors: Tot
- Page 13:
List of AbbreviationsAIDSANCCSProEC
- Page 16 and 17:
TopicMICS4IndicatorNumberMDGIndicat
- Page 18 and 19:
TopicMICS4IndicatorNumberMDGIndicat
- Page 20 and 21:
•Approximately 73 percent of chil
- Page 22 and 23:
survey. The situation is different
- Page 24 and 25:
women from Roma settlements had bee
- Page 26 and 27:
In signing these international agre
- Page 28 and 29:
QuestionnairesFour sets of question
- Page 30 and 31:
How to Read the TablesSome of the d
- Page 32 and 33:
Table HH.1: Results of household, w
- Page 34 and 35:
The age and sex distribution of the
- Page 36 and 37:
Table HH.4: Women’s background ch
- Page 38 and 39:
Table HH.5: Under-5’s background
- Page 40 and 41:
Of the 4015 children age 0-17 recor
- Page 42 and 43:
The response rates for households a
- Page 44 and 45:
Table HH.3R provides basic backgrou
- Page 46 and 47:
Approximately, 68 percent of interv
- Page 48 and 49:
Of the 3309 children age 0-17 recor
- Page 50 and 51:
The module on child mortality was u
- Page 52 and 53:
Table NU.1 shows the percentages of
- Page 54 and 55:
For both comparison with MICS3 as w
- Page 56 and 57: indicators when their weight and he
- Page 58 and 59: Breastfeeding and Infantand Young C
- Page 60 and 61: In Table NU.3, breastfeeding status
- Page 62 and 63: Table NU.5: Age-appropriate breastf
- Page 64 and 65: Table NU.7: Minimum meal frequency,
- Page 66 and 67: Breastfeeding and Infant and Young
- Page 68 and 69: Approximately 9 percent of children
- Page 70 and 71: Table NU.6R: Introduction of solid,
- Page 72 and 73: Low Birth WeightWeight at birth is
- Page 74 and 75: VI CHILD HEALTHOral Rehydration Tre
- Page 76 and 77: Figure CH.1: Percentage of children
- Page 78 and 79: Table CH.3: Oral rehydration therap
- Page 80 and 81: Oral Rehydration Treatmentin Roma S
- Page 82 and 83: Table CH.3R provides the proportion
- Page 84 and 85: Care Seeking and AntibioticTreatmen
- Page 86 and 87: Table CH.5: Knowledge of the two da
- Page 88 and 89: Table CH.4R presents the prevalence
- Page 90 and 91: Overall, almost one-third (32 perce
- Page 92 and 93: Table CH.7R: Solid fuel use by plac
- Page 94 and 95: Table WS.1: Use of improved water s
- Page 96 and 97: The amount of time it takes to obta
- Page 98 and 99: Use of Improved Water Sourcesin Rom
- Page 100 and 101: The amount of time it takes to obta
- Page 102 and 103: Use of Improved SanitationInadequat
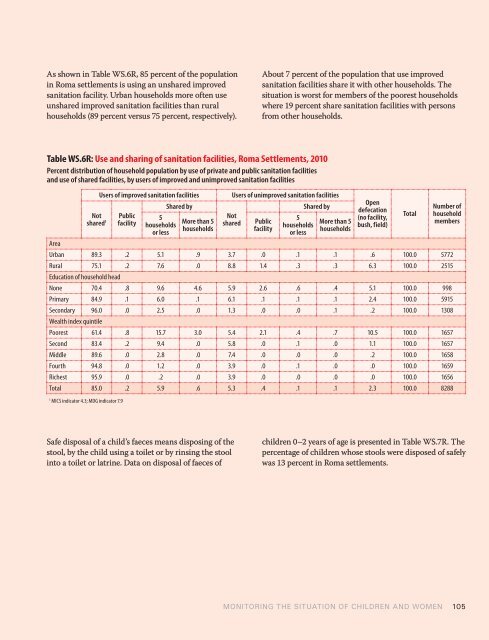
- Page 104 and 105: Safe disposal of a child’s faeces
- Page 108 and 109: Table WS.7R: Disposal of child’s
- Page 110 and 111: HandwashingHandwashing with water a
- Page 112 and 113: Handwashing in Roma SettlementsA sp
- Page 114 and 115: VIII REPRODUCTIVEHEALTHFertilityIn
- Page 116 and 117: Table RH.3 presents the trends for
- Page 118 and 119: Table RH.3R presents the trends for
- Page 120 and 121: Table RH.4: Use of contraception, S
- Page 122 and 123: Contraception in Roma SettlementsCu
- Page 124 and 125: Unmet NeedUnmet need for contracept
- Page 126 and 127: Unmet Need in Roma SettlementsTotal
- Page 128 and 129: Antenatal CareThe antenatal period
- Page 130 and 131: UNICEF and WHO recommend a minimum
- Page 132 and 133: Table RH.7R: Number of antenatal ca
- Page 134 and 135: Assistance at DeliveryThree-quarter
- Page 136 and 137: Assistance at Delivery in Roma Sett
- Page 138 and 139: Place of Delivery in Roma Settlemen
- Page 140 and 141: A specific question was added in MI
- Page 142 and 143: For almost all children under-five
- Page 144 and 145: In Serbia, 76 percent of children a
- Page 146 and 147: Table CD.1R.A: Early child developm
- Page 148 and 149: Table CD.2R: Support for learning,
- Page 150 and 151: Table CD.4R shows that 4 percent of
- Page 152 and 153: Table CD.5: Early child development
- Page 154 and 155: X LITERACYAND EDUCATIONLiteracy amo
- Page 156 and 157:
Literacy among Young Women and Meni
- Page 158 and 159:
School Readiness in Roma Settlement
- Page 160 and 161:
Table ED.4 provides the percentage
- Page 162 and 163:
The percentage of children entering
- Page 164 and 165:
the number of children of primary s
- Page 166 and 167:
Primary and Secondary School Partic
- Page 168 and 169:
Table ED.5R: Secondary school atten
- Page 170 and 171:
Table ED.7R: Primary school complet
- Page 172 and 173:
Table ED.8R: Education gender parit
- Page 174 and 175:
Birth Registration in Roma Settleme
- Page 176 and 177:
to describe aspects of child discip
- Page 178 and 179:
Early MarriageMarriage before the a
- Page 180 and 181:
Table CP.3M: Early marriage, Serbia
- Page 182 and 183:
Table CP.5: Spousal age difference,
- Page 184 and 185:
Table CP.3R.M: Early marriage, Roma
- Page 186 and 187:
Table CP.5R: Spousal age difference
- Page 188 and 189:
Table CP.6: Attitudes toward domest
- Page 190 and 191:
Attitudes toward Domestic Violencei
- Page 192 and 193:
XII HIV/AIDS ANDSEXUAL BEHAVIOURKno
- Page 194 and 195:
Similar patterns are observed for m
- Page 196 and 197:
Table HA.2M: Knowledge about HIV tr
- Page 198 and 199:
Table HA.3: Knowledge of mother-to-
- Page 200 and 201:
Men between 15-29 years of age seem
- Page 202 and 203:
Among the women interviewed aged be
- Page 204 and 205:
Table HA.3R: Knowledge of mother-to
- Page 206 and 207:
The indicators on attitudes toward
- Page 208 and 209:
Accepting Attitudes toward People L
- Page 210 and 211:
Knowledge of a Place for HIV Testin
- Page 212 and 213:
Tables HA.6 and HA.6M present the s
- Page 214 and 215:
Table HA.7: HIV counselling and tes
- Page 216 and 217:
Similar patterns are observed for m
- Page 218 and 219:
Table HA.6R.M: Knowledge of a place
- Page 220 and 221:
Sexual Behaviour Related to HIVTran
- Page 222 and 223:
Table HA.9: Sex with multiple partn
- Page 224 and 225:
Overall, 22 percent of men between
- Page 226 and 227:
Table HA.11: Sex with non-regular p
- Page 228 and 229:
Sexual Behaviour Related to HIVTran
- Page 230 and 231:
Overall, 2 percent of women aged be
- Page 232 and 233:
Table HA.9R.M: Sex with multiple pa
- Page 234 and 235:
Table HA.11R: Sex with non-regular
- Page 236 and 237:
XIII ACCESS TO MASSMEDIA AND USEOF
- Page 238 and 239:
a weekly basis, men aged 15-19 are
- Page 240 and 241:
Women with secondary education are
- Page 242 and 243:
As expected, both computer and inte
- Page 244 and 245:
Usage of computer and internet duri
- Page 246 and 247:
Table SW.1: Domains of life satisfa
- Page 248 and 249:
The average life satisfaction score
- Page 250 and 251:
In table SW.3, women’s perception
- Page 252 and 253:
Subjective well-being in Roma Settl
- Page 254 and 255:
Table SW.2R: Life satisfaction and
- Page 256 and 257:
Table SW.3R: Perception of a better
- Page 259 and 260:
Appendix A Sample Design for the Se
- Page 261 and 262:
Sampling Frame and Selection of Clu
- Page 263 and 264:
Appendix A Sample Design for the Ro
- Page 265 and 266:
Calculation of Sample WeightsThe sa
- Page 267 and 268:
Darko DjuricDragan CvetkovicIgor St
- Page 269 and 270:
Table SE.1: Indicators selected for
- Page 271 and 272:
Table SE.3: Sampling errors: Urban
- Page 273 and 274:
Table SE.5: Sampling errors: Region
- Page 275 and 276:
Table SE.7: Sampling errors: Region
- Page 277 and 278:
Appendix C Estimates of Sampling Er
- Page 279 and 280:
Table SE.2R: Sampling errors: Total
- Page 281 and 282:
Table SE.4R: Sampling errors: Rural
- Page 283 and 284:
Table DQ.2: Age distribution of eli
- Page 285 and 286:
Table DQ.6: Men’s completion rate
- Page 287 and 288:
Table DQ.8: Completeness of reporti
- Page 289 and 290:
Table DQ.10: Heaping in anthropomet
- Page 291 and 292:
Table DQ.14: Selection of children
- Page 293 and 294:
Appendix D Data Quality Tables —
- Page 295 and 296:
Table DQ.5R: Women’s completion r
- Page 297 and 298:
Table DQ.8R: Completeness of report
- Page 299 and 300:
Table DQ.10R: Heaping in anthropome
- Page 301 and 302:
Table DQ.15R: School attendance by
- Page 303 and 304:
MICS4 INDICATOR Module Numerator De
- Page 305 and 306:
MICS4 INDICATOR Module Numerator De
- Page 307:
Appendix F Questionnaires
- Page 310 and 311:
MODULE HL — HOUSEHOLD LISTING FOR
- Page 312 and 313:
MODULE ED — EDUCATIONED1.LineNo.E
- Page 314 and 315:
MODULE WS — WATER AND SANITATIONW
- Page 316 and 317:
HC4. Main material of the roof.Reco
- Page 318 and 319:
MODULE CD — CHILD DISCIPLINETable
- Page 320 and 321:
HH21. Does any child under the age
- Page 322 and 323:
WB7. Now I would like you to read t
- Page 324 and 325:
MN2. Whom did you see?Probe:Anyone
- Page 326 and 327:
CP3. Couples use various ways or me
- Page 328 and 329:
MA5. Have you ever been married or
- Page 330 and 331:
HA11. If a member of your family go
- Page 332 and 333:
LS10. How satisfied are you with ho
- Page 334 and 335:
MODULE BR — BIRTH REGISTRATIONBR1
- Page 336 and 337:
EC13. Does (name) follow simple dir
- Page 338 and 339:
CA7. At any time in the last two we
- Page 340 and 341:
QUESTIONNAIRE FOR MEN AGE 15-29 YEA
- Page 342 and 343:
MA2. How old is your wife/partner?P
- Page 344 and 345:
SB13. Other than these two persons,
- Page 346 and 347:
LS11. How satisfied are you with th
- Page 348 and 349:
Table ED.5 (a): Lower secondary sch
- Page 350 and 351:
Table ED.4R (a): Primary school att
- Page 352:
Table ED.5R (b): Upper secondary sc