Twelfth Five Year Plan Tamil Nadu - Tamil Nadu Government
Twelfth Five Year Plan Tamil Nadu - Tamil Nadu Government
Twelfth Five Year Plan Tamil Nadu - Tamil Nadu Government
- No tags were found...

You also want an ePaper? Increase the reach of your titles
YUMPU automatically turns print PDFs into web optimized ePapers that Google loves.
<strong>Twelfth</strong> <strong>Five</strong> <strong>Year</strong> <strong>Plan</strong> <strong>Tamil</strong> <strong>Nadu</strong>5
<strong>Twelfth</strong> <strong>Five</strong> <strong>Year</strong> <strong>Plan</strong> <strong>Tamil</strong> <strong>Nadu</strong>8
<strong>Twelfth</strong> <strong>Five</strong> <strong>Year</strong> <strong>Plan</strong> <strong>Tamil</strong> <strong>Nadu</strong>10
<strong>Twelfth</strong> <strong>Five</strong> <strong>Year</strong> <strong>Plan</strong> <strong>Tamil</strong> <strong>Nadu</strong>Chapter - IVision and StrategyIntroduction<strong>Tamil</strong> <strong>Nadu</strong> has been India’s most progressive State and isamongst the top three on several economic and social indicators. The<strong>Twelfth</strong> <strong>Plan</strong> of <strong>Tamil</strong> <strong>Nadu</strong> will lay the foundation for the recentlyunveiled “VISION 2023 Strategic <strong>Plan</strong> for Infrastructure Developmentin <strong>Tamil</strong> <strong>Nadu</strong>” – a vision that aims to make the State India’s mostprosperous and progressive State by 2023 with the status of the firstpoverty-free State. The <strong>Twelfth</strong> <strong>Plan</strong> will place <strong>Tamil</strong> <strong>Nadu</strong> firmly on thepath of an Accelerated, Innovative and Inclusive Growth. In thisperiod, an average citizen in <strong>Tamil</strong> <strong>Nadu</strong> will enjoy the best standardof services among Indian States in terms of access to infrastructure,education and health services. People of the State will be educated,skilled, and trained adequately to contribute to the process of socialand economic growth and enjoy a clean environment, connectivity,and employment opportunities. The <strong>Twelfth</strong> <strong>Plan</strong> aims to achieve anoverall growth of 11 percent per annum.Growth Performance: Tenth and Eleventh <strong>Plan</strong>sAfter growing only at 4.67 percent (in 1999-00 prices) in theNinth <strong>Plan</strong> period (1997-2002), the economy accelerated in theTenth <strong>Plan</strong> (2002-07) to record 9.7 percent, the highest in any <strong>Plan</strong>period so far (Table 1.1). This performance is consistent with theperformance of the Indian economy that also recorded the highestgrowth in the Tenth <strong>Plan</strong>.11
<strong>Twelfth</strong> <strong>Five</strong> <strong>Year</strong> <strong>Plan</strong> <strong>Tamil</strong> <strong>Nadu</strong>Table 1.3: Per capita GDDP (2004-05 prices), HDI and Sex Ratio in <strong>Tamil</strong> <strong>Nadu</strong>: An Inter District ComparisonS.No.DistrictPer capita GDDP(2008-09) inHDI (2011)Sex Ratio (2011)S.No.DistrictPer capita GDDP(2008-09) inHDI (2011)Sex Ratio (2011)1 Kanniyakumari 68459 0.812 1010 17 Krishnagiri 45628 0.748 9562 Coimbatore 65478* 0.802* 1001 18 Dindigul 42669 0.741 9983 Tiruppur N.A N.A 988 19 Cuddalore 41840 0.742 9844 Virudhunagar 63978 0.795 1009 20 The Nilgiris 41491 0.787 10415 Thiruvallur 61621 0.776 983 21 Dharmapuri 40445 0.707 9466 Thoothukodi 59880 0.789 1024 22 Sivagangai 37410 0.733 10007 Chennai 57387 0.817 986 23 Thanjavur 37249 0.737 10318 Kancheepuram 56493 0.787 985 24 Ramanathapuram 37047 0.744 9779 Namakkal 55592 0.768 986 25 Theni 33918 0.722 99010 Erode 54929 0.746 992 26 Pudukkotai 33473 0.723 101511Thiruchirappalli54636 0.766 1013 27 Nagapattinam 32292 0.728 102512 Karur 52381 0.740 1015 28 Thiruvannamalai 30885 0.713 99313 Thirunelveli 50546 0.777 1024 29 Villupuram 27405 0.704 98514 Madurai 50463 0.736 990 30 Thiruvarur 26678 0.720 102015 Vellore 46096 0.753 1004 31 Perambalur 17761 # 0.692 # 100616 Salem 46089 0.747 954 32 Ariyalur N.A N.A 1016<strong>Tamil</strong> <strong>Nadu</strong> 48216 0.765 995Source: Department of Economics and Statistics, Census of India (2011) and State <strong>Plan</strong>ning Commission (TN)* - Figures relating to composite district Coimbatore and Tiruppur# - Figures relating to composite district Perambalur and Ariyalur. NA - Not Available<strong>Tamil</strong> <strong>Nadu</strong>’s per capita income of 61,531 at constant pricesin 2011-12 is relatively high when compared to the All Indiafigure of 43,282. The existence of wide inter-district disparities inper capita income is a major concern. While Kanniyakumari had thehighest per capita income of 68,459 in 2008-09, Perambalur hadthe lowest per capita income of 17,761 (Table 1.3). The highest percapita income district has nearly four times the income of the poorestdistrict. In 18 out of 32 districts, the per capita income is below theaverage of the State per capita income.14
<strong>Twelfth</strong> <strong>Five</strong> <strong>Year</strong> <strong>Plan</strong> <strong>Tamil</strong> <strong>Nadu</strong>and nutritional issues, rapid urbanisation and related migration,skill development, climate and environmental concerns. The <strong>Twelfth</strong><strong>Plan</strong> provides an opportunity to restructure policies to consolidatethe gains that have been made in the Tenth and the Eleventh <strong>Plan</strong>sand to correct the deficiencies that have emerged.Vision for the <strong>Twelfth</strong> <strong>Plan</strong>The vision is to make <strong>Tamil</strong> <strong>Nadu</strong>, the “Numero Uno” Statein India, not only in terms of per capita income but also in termsof human development indicators. The Union <strong>Plan</strong>ning Commissionhas proposed a growth target of 8.0 percent for India. Acceleratingboth the services growth and the industrial growth, <strong>Tamil</strong> <strong>Nadu</strong> aimsat 11.0 percent growth at the end of the <strong>Twelfth</strong> <strong>Plan</strong>. The target isnot just accelerated growth but also innovative and inclusive growth,which ensures a balanced and significant improvement in the qualityof life of all people. The <strong>Twelfth</strong> <strong>Plan</strong> is the first phase of action plan ofthe Vision <strong>Tamil</strong> <strong>Nadu</strong> 2023 which has identified Ten themes for theState: (i) Economic prosperity, (ii) Inclusive growth, (iii) Health forall, (iv) World class infrastructure, (v) Healthy investment climate,(vi) Innovation hub and knowledge capital, (vii) Creating conduciveenvironment for human development, (viii) Nurturing a rich heritageand preserving the ecology, (ix) Protecting against vulnerability and (x)Improving the quality of Institutions and Governance.Gender component is included in the <strong>Twelfth</strong> <strong>Plan</strong> across sectorsin consonance with the sentiments, vision and firm commitment ofthe <strong>Government</strong> at the highest level. The entire <strong>Plan</strong>ning process is“Engendered”. The <strong>Plan</strong> will try to ensure the building of the economyon the Principle of Environmental Sustainability and Low Carbon.Water Security, Food Security and Energy Security are not justthe goals but outcomes as the <strong>Twelfth</strong> <strong>Plan</strong> seeks to move towardssustainable growth and development. Green growth has the potentialto make the State a major player in accessing “Carbon Credits” (1 unitis equivalent to reduction of 1 metric tonne of CO 2or its equivalent),17
<strong>Twelfth</strong> <strong>Five</strong> <strong>Year</strong> <strong>Plan</strong> <strong>Tamil</strong> <strong>Nadu</strong>Rural DevelopmentAccording to 2011 Census, 3.72 crore people (51.55 percent)live in rural areas. The spread of rural population varies significantlyacross districts. The declining share of agriculture and highdependence of the rural masses on agriculture necessitates familybased poverty reduction strategy and empowerment in rural areas.Provision of basic amenities, quality services for cleaner and greenervillages and creation of productive assets for sustainable livelihoodsare major thrust areas in the <strong>Twelfth</strong> <strong>Plan</strong>.<strong>Tamil</strong> <strong>Nadu</strong> Village Habitation Improvement Scheme (THAI)is being implemented to improve the basic amenities in rural areas.Every year 60,000 Solar Powered Houses of 300 square feet will beprovided to rural people through the Chief Minister’s Solar PoweredGreen House Scheme. One lakh street lights will be energised with solarpower during the <strong>Twelfth</strong> <strong>Plan</strong> period. Providing 24 x 7 piped watersupply, Litter Free and Open Defecation Free Panchayats with locallymanaged liquid and solid waste management systems, renovatingall the Integrated Women Sanitary Complexes, re-introducing CleanVillage Campaign are the other notable schemes which will enablethe State to improve the quality of life in rural areas.The State has initiated a special programme, “State BalancedGrowth Fund” to address the regional imbalances and backwardnessin human development and gender parameters. 100 backward blocksincluding Urban Municipalities and Slum Areas of Corporationswhich are poor in per capita income, high incidence of Poverty,Unemployment, Health, Education and disparities in Gender will beidentified for addressing backwardness and disparities in Social andEconomic attainments. Focus will be on growth limiting factors andequitable development of the State within the plan period. An initialallocation of 100 crore has been made in the first year (2012-13) forimplementation of the scheme.21
<strong>Twelfth</strong> <strong>Five</strong> <strong>Year</strong> <strong>Plan</strong> <strong>Tamil</strong> <strong>Nadu</strong>Perspective <strong>Plan</strong>s and District Human Development Reports willbe prepared for decentralised and equitable development of the StateIndustryIt is a matter of concern that <strong>Tamil</strong> <strong>Nadu</strong>, a leading manufacturerin automobile, textile, hosiery, pharma, leather, InformationTechnology and Information Technology Enabled Services (IT andITES), has witnessed a slow pace of growth of industry (i.e.,7.6 percent)in the Eleventh <strong>Plan</strong> period. The growth of industry in the Tenth<strong>Plan</strong> was 11.2 percent. Industrial growth needs to be accelerated aslarge manufacturing as well as Micro, Small and Medium Enterprises(MSMEs) in rural areas have a large employment potential. They mustprovide a large portion of additional employment required to absorbpeople who move out of agriculture in pursuit of higher incomesand the services sector alone cannot absorb them. Therefore, thegrowth target set for this sector in this <strong>Plan</strong> is 10.5 percent (i.e.,11.4percent for manufacturing and 8.5 percent for non manufacturingindustries like construction, mining and quarrying etc). Growth inthe manufacturing sector needs to be accelerated by providing theneeded power and transport facilities at competitive cost.Some sub-sectors of manufacturing are doing well. The growthrate of MSME sector has outstripped the overall industrial growth inrecent years. With its agility and dynamism, this sector has shownadmirable innovativeness and adaptability to survive the recenteconomic downturn and recession. <strong>Tamil</strong> <strong>Nadu</strong> has attracted hugeinvestments in electronics, glass and telecommunication in recentyears. With large number of high tech engineering and researchinstitutions and availability of skilled resource pool in aeronautical/avionics engineering, <strong>Tamil</strong> <strong>Nadu</strong> is poised to emerge as one of the topaerospace industry destinations in India. Sectors like auto industry,textiles, pharmaceuticals and IT are also performing well. The abovesuccess will be sources of competitive advantage for <strong>Tamil</strong> <strong>Nadu</strong> thatcould be developed into a broader strategy applicable to larger parts ofthe industrial sector. Policies of other industrialised countries and a22
<strong>Twelfth</strong> <strong>Five</strong> <strong>Year</strong> <strong>Plan</strong> <strong>Tamil</strong> <strong>Nadu</strong>few industrialised Indian States can provide insights for formulatingsuitable strategies to achieve the target.The strategic objectives for the industrial sector are as follows:(i) Make <strong>Tamil</strong> <strong>Nadu</strong> a global investment destination for automobileand auto parts, textiles, leather, engineering goods, (ii) Make the Statea global destination of choice for IT and ITES industries, (iii) Specialemphasis on sunrise sectors like bio-technology, nano-technology,pharmaceuticals, solar and clean energy, (iv) Attract investmentsin the ship building industry as <strong>Tamil</strong> <strong>Nadu</strong> is endowed with along coastline, (v) Generate 15 lakh direct and indirect additionalemployment opportunities in MSME during the <strong>Twelfth</strong> <strong>Plan</strong> period,(vi) Enhance the competitiveness and scalable capacity of the MSME,and (vii) Promote industrial development in rural areas.A multi dimensional approach can be adopted to achieve thetargets. Some important strategies are: (i) New Industrial Policy, (ii)Industry specific policies for automobile and auto parts, biotechnology,nano-technology, aerospace, pharmaceuticals, and electronichardware, (iii) Comprehensive IT industry friendly and Information,Communication Technology (ICT) Policy, (iv) Land Policy for acquisitionof land for industrialisation, (v) New e-Governance Policy, (vi) Creatingclusters for pharmaceuticals, gems, jewellery and silver, (vii) Subsidyassistance (interest subvention) to MSME setup in industrially backwardareas, and (viii) Technological upgradation or modernisation to improveproductivity and develop the infrastructure in all sectors, especiallytextile mills, power loom, pre and post-loom processing.Efforts will be made to promote (i) Industry-Academia-<strong>Government</strong> collaboration for Research and Development,(ii) Innovations and Diffusion of technology in MSME sector,(iii) New Entrepreneur cum Enterprise Development Scheme (NEEDS)to train young first generation entrepreneurs, (iv) Training in modernmanagement and production techniques and improving the skill ofweavers and development of new designs, and (v) District IndustrialCentres with better infrastructure so that they can promote MSMEunits.23
<strong>Twelfth</strong> <strong>Five</strong> <strong>Year</strong> <strong>Plan</strong> <strong>Tamil</strong> <strong>Nadu</strong>As power shortage is one of the reasons for the slow growth ofmanufacturing in the Eleventh <strong>Plan</strong>, power infrastructure needs tobe improved. Growing urbanisation and location of most industries indeveloped areas put pressure on the urban services and infrastructure.Efforts will be made to promote industries in a decentralised way.<strong>Tamil</strong> <strong>Nadu</strong> infrastructure Development Board has beenestablished to meet the infrastructure requirements and attractprivate investments by introduction of the <strong>Tamil</strong> <strong>Nadu</strong> InfrastructureDevelopment Act 2012. The Board will play the role of a nodal agencyto coordinate <strong>Government</strong> initiatives in the infrastructure sector.Various incentives such as exemption from payment or deferredpayment of any tax/ fees or refund or loan in lieu of payment cesses,royalties or other statutory levies, right to trade in any speciallycreated development rights on land or property, etc., will be providedto the PPP investors. An initial allocation of 1000 crore has beenmade for <strong>Tamil</strong> <strong>Nadu</strong> Infrastructure Development Fund.Creating Industrial Corridors, setting up a Liquefied NaturalGas Import Terminal and Related Gas Pipeline Infrastructure nearEnnore Port, new (minor) ports and Port-Industrial corridor roadconnectivity, engaging private sector in the mining of granite and otherminerals with a condition that they must take responsibility for areadevelopment, employment etc., are some of the measures to achievethe target. All major industrial houses will be encouraged to focustheir Corporate Social Responsibility to fill the gaps in <strong>Government</strong>service delivery and also in the maintenance of assets created by the<strong>Government</strong>.<strong>Government</strong> of <strong>Tamil</strong> <strong>Nadu</strong> has signed Memoranda ofUnderstanding (MoU) for 12 projects involving total investmentsworth 20,925 crore. These projects are expected to generatedirect employment for 36,855 persons and indirect employmentopportunities for one lakh people. Thus, the MoUs will translate intoreality the ‘Vision-2023’ unveiled by the <strong>Government</strong>.24
<strong>Twelfth</strong> <strong>Five</strong> <strong>Year</strong> <strong>Plan</strong> <strong>Tamil</strong> <strong>Nadu</strong>Services SectorServices sector has been the main driving force of the overalleconomic growth of the State. Currently its share in GSDP isabout 61 percent. According to NSS 66 th round data, its employmentshare was 27.6 percent in 2009-10. In the Eleventh <strong>Plan</strong>, servicesgrew at 8.8 percent as against the target of 10.1 percent. The fall inthe growth of services sector was mainly due to a fall in the growth ofits major sub sector: trade, hotels and restaurants to 4.82 percent.This was mainly because of global slowdown. Now there are signs ofrecovery in the global economy. The <strong>Twelfth</strong> <strong>Plan</strong> aims to acceleratethe services sector growth to 12 percent. The services sector hasthe potential to grow above the target level and thereby push theoverall GSDP growth beyond the projected target of 11 percent. Thisincreased growth rate could offset any lag in the other sectors dueto unforeseen circumstances and maintain the double-digit growthrate.EnergyEnergy is a key input for the overall economic development.Currently, power shortage is the major concern. The energy demandhas been continuously increasing due to rapid growth of industries,urbanisation etc. But the supply is constrained by many factors.The Eleventh <strong>Plan</strong> targeted the creation of 7808 MW of additionalcapacity. But the actual capacity addition of conventional energysource was only 385 MW. The actual power generation was alsoless than the capacity. There is a greater uncertainty associated withwind power. While the wind energy capacity increased significantly inthe Eleventh <strong>Plan</strong> period, it is found to be seasonal and contributingless during peak demand months. Delays exist in new capacityaddition. Transmission, Distribution loss etc., are the other supplyside constraints.The total installed generation capacity of <strong>Tamil</strong> <strong>Nadu</strong> fromconventional energy sources as on 31.05.2012 was 10364 MW. Theaverage availability is 8500 MW but the demand ranges from 1000025
<strong>Twelfth</strong> <strong>Five</strong> <strong>Year</strong> <strong>Plan</strong> <strong>Tamil</strong> <strong>Nadu</strong>MW to 12300 MW. The shortage is managed from wind energy, openmarket purchases and measures to restrict usage. Since open marketprices are rising, purchases are becoming more expensive. Therefore,it is imperative to moderate the growth of energy demand by achievinghigher levels of energy efficiency/conservation besides increasing theState’s own capacity as much as possible. Captive power plants canalso be encouraged. Apart from this, there is an installed capacity of7971 MW (as on 30.06.2012) of renewable sources of energy: windenergy (7056 MW), biomass co-generation (637 MW), biomasspower (167 MW), small hydro (90 MW), solar (17 MW) and waste toenergy (4 MW). These are also harnessed to meet out the demand.The gross energy consumption increased at 9.3 percent perannum during the period 2004-05 to 2011-12 and the implicitelasticity with respect to GSDP was 1.2. It is projected that in orderto sustain 11.0 percent GSDP growth, the demand for power woldgrow by about 13.7 percent during the <strong>Twelfth</strong> <strong>Plan</strong> period. TheState aims to become a power surplus state to attract industrialinvestments and accelerate growth in the <strong>Twelfth</strong> <strong>Plan</strong> period.In order to achieve the <strong>Government</strong> of India’s <strong>Plan</strong> to give“Power for All by 2012”, the State is making progress in generation,transmission and distribution sectors. It has completed theelectrification of all villages and towns in the State and is progressingtowards electrification of all households.The strategic objectives of the energy sector in the <strong>Twelfth</strong> <strong>Plan</strong>aims at the following: (i) Make <strong>Tamil</strong> <strong>Nadu</strong> a power surplus state, (ii) Improveenergy efficiency, (iii) Project <strong>Tamil</strong> <strong>Nadu</strong> as a solar hub, (iv) Encourage indigenoussolar manufacturing facilities in the State (v) Provide access to electricity to all ruralhouseholds, (vi) Reduce Aggregate, Technical and Commercial (AT&C) losses tobelow 15 percent and (vii) Encourage renewable energy generating facilities.The <strong>Twelfth</strong> <strong>Plan</strong> aims for the capacity addition of around15,504.5 MW through conventional sources. The expected capacity26
<strong>Twelfth</strong> <strong>Five</strong> <strong>Year</strong> <strong>Plan</strong> <strong>Tamil</strong> <strong>Nadu</strong>addition is 2039.5 MW from the following on-going projects: (i)Bhavani Kattalai Barrage, (ii) Vaigai Hydro Electric Projects, (iii)Mettur Thermal Power Stage III, (iv) North Chennai Thermal StageII, and (v) Cogeneration in Sugar mills. Two joint venture projects,namely Neyveli Lignite Corporation Unit at Tuticorin, and NationalThermal Power Corporation Unit at Vallur will add the capacity of1428 MW. Central Generating Stations at Kudankulam Nuclear PowerProject, Neyveli TS II Expansion, PFBR Kalpakkam etc., are expectedto provide 1417 MW additional power to the State. New projects will addapproximately 10,620 MW. The renewable sources - wind energy, biomassco-generation, small hydro, solar, waste to energy will add 10,650 MWcapacity.<strong>Tamil</strong> <strong>Nadu</strong> <strong>Government</strong> has unveiled the <strong>Tamil</strong> <strong>Nadu</strong> SolarEnergy Policy 2012 which seeks to tap 3000 MW of power in thenext three years through solar energy. The policy intends to make thesolar energy a people’s movement similar to the rain water harvesting.The policy involves all High Tension Consumers including SEZs andIT Parks and mandates six percent Solar Purchase Obligation (SPO).In utility scale, out of 1500 MW, 1000 MW will be funded throughSPO and balance 500 MW through Generation Based Incentive (GBI)provided by the <strong>Government</strong>. A GBI of 2 per unit for the first twoyears, 1 for next two years and 50 paise per unit for subsequent twoyears will be provided for all solar or solar-wind hybrid rooftops beinginstalled before March 31, 2014.For its new buildings, the <strong>Government</strong> will provide solar rooftops,while for all existing buildings, it will provide solar panels in a phasedmanner. The <strong>Government</strong> will also energise over one lakh street lightsthrough solar energy by 2015-16 and water supply installations inlocal bodies through solar power in a phased manner. Solar parkswith a capacity of 50 MW each will also be developed in 24 districtsacross the State.27
<strong>Twelfth</strong> <strong>Five</strong> <strong>Year</strong> <strong>Plan</strong> <strong>Tamil</strong> <strong>Nadu</strong>The policy also envisages a slew of incentives to powermanufacturers, encouraging them to migrate to solar power. Further,the Transmission and Distribution losses, Aggregate Technical andCommercial Losses and other infrastructure expenditure will bereduced by setting up solar power plants in all industrial estates,subject to the availability of land at reasonable cost.The <strong>Government</strong> will also promote net metering to promoterooftop penetration thereby encouraging households to produce solarpower. It has announced electricity tax exemption, tax concessions,exemption from demand cut to those who produce solar power fromtheir rooftop.Various other policy measures to achieve the targets are: (i)Renewable Energy Policy, (ii) Policy reforms for further unbundlingof distribution in a more decentralised way, (iii) Sustainable EnergySecurity Policy. The other strategies are: (i) Setting up of offshorewind power and biomass plants, (ii) Attract private investmentson a commensurate scale, (iii) Renewable energy master <strong>Plan</strong>, (iv)Enhancing transformer capacities in the existing sub stations,(v) Bifurcation of high tension overload feeders and installation ofcapacitor banks at distribution transformers for injection of reactivepower, (vi) Conversion of low voltage lines to high voltage linesalong with feeder separation to reduce the distribution line losses,(vii) Segregation of agricultural loads, (viii) Adequate transmissionnetwork to evacuate the power generated from new plants and todistribute to the customers, (ix) Energy conservation by provision ofCFLs, (x) Improving the efficiency of the agricultural pumpsets, (xi)Energy conservation building code and (xii) Energy star labeling inequipments.Efforts are needed to make the distribution system financiallyviable during the <strong>Twelfth</strong> <strong>Plan</strong> by bringing modern systems ofmanagement, use of Information Technology, enforcement ofaccountability and privatisation or franchising. Merely pursuing28
<strong>Twelfth</strong> <strong>Five</strong> <strong>Year</strong> <strong>Plan</strong> <strong>Tamil</strong> <strong>Nadu</strong>supply side options will not suffice. A paradigm shift to power utility(demand side) management that combines engineering with economicprinciples is the need of the hour.Roads, Transports and PortsAn efficient, reliable and safe transport system is a vitalrequirement for overall economic development. The State’s vision is“to increase the capacity, connectivity, efficiency and safety of thehighways system” and “to improve the level of transport service tothe public”. Link roads to all the habitations with more than 1000population in the State are already provided. Now efforts are made tocover all habitations.The State transport services play a vital role in providing avariety of services viz., town, mofussil, ghat and express services. Dueto increased urbanisation and exponential growth of vehicles, roadinfrastructure deficit continues and there is an enormous demandfor dependable urban mass transit system. In fact, highways carryhuge volume of passenger traffic and freight traffic in the State. Thissector thus needs special attention. Efforts are needed to improve theroad conditions and to reduce accidents.International trade volumes have been growing faster than GSDPand will continue to do so, indicating the need to build adequatecapacity in the ports. Further, appropriate linkages between ports,industrial corridors and railways need to be completed. To meetthese expanding demands large investments are needed. Publicsector may not be able to raise the required resources and this will besupplemented by investments by the private sector in Public PrivatePartnership (PPP) mode. In the case of energy and infrastructurefunding, the <strong>Twelfth</strong> <strong>Plan</strong> proposes to explore possibilities of Public-Public-Partnership with Public Sector Enterprises of the State playingan active role.29
<strong>Twelfth</strong> <strong>Five</strong> <strong>Year</strong> <strong>Plan</strong> <strong>Tamil</strong> <strong>Nadu</strong>In view of meeting the infrastructure requirements, the <strong>Twelfth</strong><strong>Plan</strong> aims at: (i) Modernising many State highways with four lanesand conversion of other State highways and other highways to twolane roads with paved shoulders, (ii) Promoting Integrated publictransport system, (iii) Developing minor ports along the east coastthrough PPP, (iv) Establishment of green field minor ports, (v) Highspeed passenger rail link connecting Chennai, Coimbatore, Maduraiand Kanniyakumari, and (vi) Modernising and expanding the airportsin the State.The strategies suggested in the <strong>Twelfth</strong> <strong>Plan</strong> are: (i) ComprehensiveRoad Infrastructure Development Programme (CRIDP) to strengthenand widen the roads and to construct/improve the bridges/culverts, (ii) Improved Road Quality and Efficiency through RoadManagement System and Strategic Option Study, (iii) Road AccidentData Management System (RADMS), (iv) Road Safety Action <strong>Plan</strong>to reduce road casualty, (v) Improved public transport servicesby purchasing 15000 new buses and 40,000 electronic ticketingmachines, (vi) Mono Rail Network connecting various parts of Chennaiand Tier II cities (vii) Chennai Unified Metropolitan Transport Authority(CUMTA) to integrate all modes of transport (viii) Greenfield airportcomplex in Chennai and upgrading existing airports in Coimbatore,Trichy and Madurai to international standards, (ix) Setting up ofcaptive ports, Jetties, and Moorings for the port based oil industries,thermal power plants etc., and (x) Building Road Over Bridges (ROB)and Road Under Bridges (RUB) at the cost of 3000 crore in theState.Tourism<strong>Tamil</strong> <strong>Nadu</strong> has a number of historical monuments and sites.It also has many popular and ancient temples. It has two importantclusters of world heritage sites: (i) the group of monuments atMamallapuram and (ii) the Great Chola Temples-Brahadiswaratemple in Thanjavur and Gangaikondacholapuram in Jayankondamand Airavatesvara temple in Darasuram. The State witnessed an30
<strong>Twelfth</strong> <strong>Five</strong> <strong>Year</strong> <strong>Plan</strong> <strong>Tamil</strong> <strong>Nadu</strong>inflow of over 184.1 million domestic and 3.6 million foreign touristsin 2012. The vision is to make <strong>Tamil</strong> <strong>Nadu</strong> an attractive internationaland domestic tourist destination and preserve our rich culturalheritage and monuments of architectural splendour. Our strategy isto promote all these sites to attract around 7 million foreign touristsby the year 2017 and 15 million foreign tourists by the year 2023.Efforts are also made to promote medical tourism, eco-tourism,adventure tourism, heritage tourism and pilgrimage tourism.Of 788 places in the world declared by UNESCO as heritagesites, 26 are in India. <strong>Tamil</strong> <strong>Nadu</strong> is bestowed with 5 world heritageattractions. This is the highest for any State. <strong>Tamil</strong> <strong>Nadu</strong> <strong>Government</strong>declared 48 Heritage places in the State. These places will be linkedwith Temples in Trichy, Madurai, Chidambaram, Rameswaram,Tiruvanamalai, Thanjavur, Kumbakonam, Nagapattinam,Tirukadaiyur, Gunaseelam and six abodes of Lord Muruga. Theplaces of worship are symbols of spirituality and more importantly ofnational integration and communal harmony. They are year roundtourist destinations.All the important roads leading to the heritage places, highdensity temples and shrines will become integral part of CleanlinessDrive movement. These stretches will become the focal point forLitter Free Zones/Plastic Free Zones/ Green Zones. The Chennai-Mamallapuram and similar heritage stretches will be given afacelift in terms of Waste Management with an enhanced thrust onmaintenance.Education and Skill DevelopmentThe Eleventh <strong>Plan</strong> targets relating to education were: (i) zerodropout rate at elementary schools, (ii) 90 percent literacy rate and(iii) 10 percent gender gap in literacy. Estimates indicate that whilethe literacy rate was 80.3 percent and the gender gap in literacy was12.9 percent, the dropout rate was less than 1 percent at the end ofEleventh <strong>Plan</strong>. Further inter district disparities in literacy and female31
<strong>Twelfth</strong> <strong>Five</strong> <strong>Year</strong> <strong>Plan</strong> <strong>Tamil</strong> <strong>Nadu</strong>literacy (e.g., in Dharmapuri the literacy and female literacy rate are64.7 percent and 60 percent respectively) are the major concerns.Specific objectives of school education are: (i) universalisingprimary and secondary education, (ii) to make “Nature, Future andCulture” as part of the curriculum, (iii) to provide a curriculum/syllabus in consonance with National Curriculum Framework (2005)and Constitution of Expert Committee to recommend the changesto be made in the syllabus from I Std., to XII Std., and also toidentify the defects in the existing text books, (iv) to provide adequateinfrastructure facilities to all schools, (v) to provide Continuous andComprehensive Evaluation (CCE) System, (vi) to introduce Trimestersystem to reduce book load of children, and (vii) to make schools/colleges as “Green Campuses”.The broad vision of the <strong>Government</strong> of <strong>Tamil</strong> <strong>Nadu</strong> in the realmof Higher Education encompasses the following: (i) Make institutionsof higher education as Centers of Innovation, Excellence and Researchand Development, (ii) Accessibility, Equity, Affordability, Flexibilityand Quality Standard, (iii) Enhancing employable skills of graduatingstudents, (iv) Popularise science programmes and create strongscientific temper, (v) Strengthening <strong>Tamil</strong> University and developingresearch and training for <strong>Tamil</strong> Development, (vi) <strong>Tamil</strong> Developmentthrough Information Technology, (vii) Centre of excellence in sportsand sports hub, (viii) Promote sports and youth welfare activities,and (ix) Make <strong>Tamil</strong> <strong>Nadu</strong> a global hub for University Education.The <strong>Twelfth</strong> <strong>Plan</strong> sets 90 percent target for literacy, zero dropoutat elementary education, and 21 percent enrolment in highereducation. It also sets the target of reducing the gender gap in literacyto 8 percentage points and universalisation of secondary educationby 2017.32
<strong>Twelfth</strong> <strong>Five</strong> <strong>Year</strong> <strong>Plan</strong> <strong>Tamil</strong> <strong>Nadu</strong>To achieve the targets, efforts are made to (i) implement RightTo Education (RTE) Act, (ii) provide educational kits, text books, notebooks, uniforms, bus pass, bicycle without cost and special cashincentives to minimise dropout of 10 th and 11 th standard students (1500) and 12 th standard students ( 2000), (iii) provide Nutritiousmeals through Puratchi Thalaivar MGR Nutritious Noon MealScheme, (iv) establish Parent-Teacher Association in every primaryand middle school, (v) strengthen infrastructure facilities and qualityinterventions through Sarva Shiksha Abhiyan (SSA) and RashtriyaMadhyamik Shiksha Abhiyan (RMSA), (vi) providing ICT facilitiesin class rooms and implementing e-governance in all educationalinstitutions, (vii) set up integrated knowledge park, integrated schooland public libraries, (viii) set up <strong>Government</strong> Engineering Colleges ineach district, (ix) establish new universities, community colleges andskill development centres and, (x) set up Green Campus and Cleanenergy in Colleges and Technical Institutions.About 5 million people will be skilled afresh or re-skilled by theend of the <strong>Twelfth</strong> <strong>Plan</strong>. As projected in the Vision <strong>Tamil</strong> <strong>Nadu</strong> 2023document, top five industries that need skilled manpower are textiles,construction, automotive, leather and engineering. To achieve thetarget, vocational education needs to be reformed. Efforts will bemade to increase the proportion of students who enroll for vocationaland higher education to over 50 percent (of the students completingsecondary schooling). Educated youth will be trained for soft andvocational skills through <strong>Tamil</strong> <strong>Nadu</strong> Skill Development Mission(TNSDM). This mission, which is currently being implemented througha society, will be reorganised as a Special Purpose Vehicle (SPV) withparticipation of the private sector. The <strong>Government</strong> in addition alsoplans to provide laptops without cost to higher secondary, collegeand ITI students to give a major boost to IT literacy in the State.It also plans to fill up 50 percent vacant seats in 627 private ITIs bysponsoring the fees of poor students.33
<strong>Twelfth</strong> <strong>Five</strong> <strong>Year</strong> <strong>Plan</strong> <strong>Tamil</strong> <strong>Nadu</strong>Health and NutritionThe vision of the <strong>Twelfth</strong> <strong>Five</strong> <strong>Year</strong> <strong>Plan</strong> is universal access topublic health services. The main task is to improve women’s health,child health, sanitation/hygiene and universal immunisation. The<strong>Twelfth</strong> <strong>Plan</strong> aims to (i) provide effective tertiary care and integratedcomprehensive primary health care, (ii) prevent and controlcommunicable and non communicable diseases, (iii) promote healthylifestyles and (iv) mainstream Indian System of Medicine.<strong>Tamil</strong> <strong>Nadu</strong>’s targets relating to health and nutrition in the <strong>Twelfth</strong><strong>Plan</strong> are: (i) reduce Infant Mortality Rate (IMR) to 13, (ii) reduce MaternalMortality Ratio (MMR) to 44, (iii) reduce Total Fertility Rate (TFR) to 1.6,(iv) reduce child (0-3 years) malnutrition to 16 percent (v) reduce theproportion of women who are anaemic to 33.2 percent, (vi) increase theLife Expectancy at Birth to 70 years for male and 73 years for female, and(vii) clean drinking water for all.The strategies to achieve the health targets are: (i) One TertiaryHealth care centre for every district and establishing five Medical collegesacross the State with each college having a minimum of 500 beddedhospital attached to it, (ii) Setting up of 135 urban primary health centres,(iii) Chief Minister’s Comprehensive Health Insurance Scheme (CMCHIS)to help patients from economically backward sections in overcomingdifficulties in paying for expensive treatments with a coverage of 1.50lakh and creation of corpus fund with an initial sum of 10 crore fortreatment involving immuno suppressants for transplants, (iv) Hospitalon Wheels Scheme, (v) Quality medical education and improvement inNursing curriculum, (vi) State Cancer Registry, (vii) Birth Defect Registry,(viii) Menstrual Hygiene Programme, (ix) Online Clinical Documentation,(x) Awareness Creation about Indian System of Medicine (ISM), (xi)Maternity assistance of 12,000 up to 2 deliveries for poor women throughDr. Muthulakshmi Reddy Maternity Benefit Scheme and provision of FreeLaptops to Village Health Nurses, (xii) Filling up of Nursing Assistant –Grade II and (xiii) Appointing adequate number of security staff for thehospitals through outsourcing.34
<strong>Twelfth</strong> <strong>Five</strong> <strong>Year</strong> <strong>Plan</strong> <strong>Tamil</strong> <strong>Nadu</strong>The <strong>Twelfth</strong> <strong>Plan</strong> has “Nutrition Security” as an important goal. Thevision is to make <strong>Tamil</strong> <strong>Nadu</strong> a “Malnutrition Free State”. The mission isto provide a whole life cycle nutrition security programme, with a focuson nutrition for the pregnant and lactating mothers, infants, childrenand adolescent girls.To achieve the nutrition goals, the strategies are: (i)Universalisation of ICDS, (ii) Training ICDS functionaries forimproving services delivery, (iii) Modernising Anganwadi Centres,(iv) Preventing anaemia and micronutrient deficiencies, and (v)Strengthening early childhood care and education.Further, a tastier and healthier menu with thirteen varieties ofrice and four types of egg masalas would be introduced in a blockin each district on a pilot basis and these will be extended acrossthe State in a phased manner. The children enrolled in AnganwadiCentres will also be provided a new menu as per their nutritionalrequirement and digestive capacity. This measure will pave way forensuring the nutrient content of the meals offered and also go a longway in preventing dropouts in rural areas.Towards achieving food security, the <strong>Twelfth</strong> <strong>Plan</strong> objectivesin <strong>Tamil</strong> <strong>Nadu</strong> are two fold: Complete elimination of hunger andstabilisation of food prices and fortification of cereals in PublicDistribution System (PDS). The strategies are: (i) Universal PDS,(ii) Distributing essential commodities at subsidised rate throughPDS and (iii) Price Stabilisation Fund for procurement of essentialcommodities. Universal PDS and regular price check will ensure foodsecurity.Urbanisation<strong>Tamil</strong> <strong>Nadu</strong> is one of the most urbanised States in India. About48.45 percent people live in urban areas. Rapid urbanisation createspressure on urban amenities like housing, water supply, sanitation,solid waste management etc. The worst affected are the poor. The35
<strong>Twelfth</strong> <strong>Five</strong> <strong>Year</strong> <strong>Plan</strong> <strong>Tamil</strong> <strong>Nadu</strong><strong>Twelfth</strong> <strong>Plan</strong> aims to achieve “safe and affordable housing and alsoinclusive, sustainable and slum-free cities” in <strong>Tamil</strong> <strong>Nadu</strong>.The strategies to achieve the targets are: (i) “Chennai Mega CityDevelopment Mission” and “Integrated Urban Development Mission’’for other urban areas, (ii) Emphasis on slum free cities and low incomehousing, (iii) Conservation of heritage buildings, (iv) Monorail Systemintegrated with MRTS (Mass Rapid Transport System) and MetroRail for Chennai, (v) Monorail in Tier II cities, (vi) Creation of24 hours urban health centres, (vii) Re-launch campaign for rainwater harvesting, (viii) State wide Sanitation Policy to eradicateopen defecation by 2015, (ix) Modernised Solid Waste Managementsystem for garbage free environment, (x) Piped and pressurised24 x 7 access to water for all, (xi) <strong>Tamil</strong> <strong>Nadu</strong> Urban LivelihoodMission to tackle urban poverty and(xii) Constitution of a StateLevel Property Tax Board. These will ensure that <strong>Tamil</strong> <strong>Nadu</strong> willbecome a pioneering State in “Ecologically Safe Sanitation”. Thus,not only a “Green State” but also a “Clean State” is the goal of <strong>Twelfth</strong><strong>Five</strong> <strong>Year</strong> <strong>Plan</strong>.Employment OpportunitiesGrowth that is employment intensive is the key to improve theper capita income in an inclusive manner. During 1999-2000 to 2009-2010, total workforce in <strong>Tamil</strong> <strong>Nadu</strong> increased from 289.74 lakh to318. 53 lakh (NSSO 66 th round). While the share of primary sectorin total employment declined from 50.3 percent in 1999-00 to 44.6percent in 2009-10, the share of secondary sector increased from23.7 percent to 27.9 percent and that of tertiary sector from 26.1percent to 27.6 percent. Thus, evidence indicates that secondarysector created more job opportunities than services. The <strong>Twelfth</strong> <strong>Plan</strong>aims to create 4 million additional jobs. Widespread skill developmentinitiatives are planned to equip the workforce with the necessaryskills to take advantage of the opportunities that emerge in bothManufacturing and Service sectors. The skill development initiativeswill focus on both high end skills and minimal skills so that all will36
<strong>Twelfth</strong> <strong>Five</strong> <strong>Year</strong> <strong>Plan</strong> <strong>Tamil</strong> <strong>Nadu</strong>find opportunities for gainful employment in accordance with theirskills and capabilities.Social Justice and EmpowermentEmpowerment and Welfare of Women, Scheduled Castes,Scheduled Tribes, Backward Classes, Most Backward Classes,Denotified Communities, Minorities, Transgender and DifferentlyAbled persons, Social Security/Justice, Geriatric Care, and ChildRights are the thrust areas in the <strong>Twelfth</strong> <strong>Plan</strong>. The strategies are:(i) Life cycle approach to women’s issues, (ii) Cradle Baby Scheme,(iii) Girl child protection scheme, (iv) Marriage assistance scheme,(v) Old Age Pension Scheme, (vi) Elimination of Child Labour, (vii)Safeguarding child rights, (viii) Infrastructure facilities in SC/SThabitations, (ix) Effective implementation of Scheduled Caste Sub<strong>Plan</strong> (SCSP) and Tribal Sub <strong>Plan</strong> (TSP) in all sectors and <strong>Government</strong>departments, (x) Provision of scholarship to SC/STs, (xi) Scholarshipsto BC/MBC, Minority and Denotified communities’ students, (xii)Regional Training Centres for differently abled persons, (xiii) CreditGuarantee fund to provide self employment loans to differentlyabled persons, (xiv) 25 percent subsidy upto a loan of 15 lakhs tothe transgenders who are part of SHGs and a pension of 1000/-to the destitute transgenders above the age of 40 and (xv) Creation ofa State level supply and marketing society for marketing of productsmanufactured by women SHGs in addition to the support renderedby the District level Supply and Marketing Societies.GovernanceAs stated in Vision <strong>Tamil</strong> <strong>Nadu</strong> 2023, <strong>Tamil</strong> <strong>Nadu</strong> will nurture aculture of responsive and transparent Governance that ensures progress,security and equal opportunity to all stakeholders. Procurement processin <strong>Government</strong> will be re-engineered within the existing rule frameworkto increase the efficiency in service delivery. Efforts are made to fullyreap the benefits of Information Communication Technology (ICT) in<strong>Government</strong> with e-governance policy, which will remove intermediariesthereby taking governance closer to people.37
<strong>Twelfth</strong> <strong>Five</strong> <strong>Year</strong> <strong>Plan</strong> <strong>Tamil</strong> <strong>Nadu</strong>Natural Resource ManagementAs the economy gains the capacity to grow rapidly, it will faceconstraints and limitations of natural resources and the need touse them in a sustainable manner. While <strong>Tamil</strong> <strong>Nadu</strong> focuses onindustrial development at a pace faster than the National average, itwill focus on the need to preserve the environment and its heritage.Efforts will be made to ensure a balance between development andenvironment. The draft <strong>Tamil</strong> <strong>Nadu</strong> State Environment Policy 2012focuses on environmental sustainability and realise the objectives ofVision 2023.The environmental preservation would encompass the entireecological footprint of human activity. It would include increasingforest cover, mitigation of man-animal conflict, integrated wild lifemanagement, ecologically sustainable development of tribal/fringevillages, protection of wetlands, conserving groundwater, rivers andwater bodies, protection of the coastal zones and fragile ecosystems,conservation of the zoological and botanical diversity of the State,protection of soil and other natural formations from abuse on accountof human activity, laying durable black topped roads using plasticwaste, efficient recycling of solid waste, ensuring minimal impact onthe environment, minimising atmospheric pollution and in generalmaintaining the ecological balance across the State. Recycling of wastewater for non drinking use can relieve pressure on overall demand ofwater for drinking purpose and also make the environment clean.Pollution and environmental degradation has become rampantdue to sewerage seepage into the water bodies and the above problemhas become manifold in Ooty Lake which has a very fragile ecosystem.In order to preserve the Ooty Lake, in addition to the conventionalprocess, an innovative bio-remediation process will be initiated whichwould result in a cleaner and safer environment.Opportunities also exist in <strong>Tamil</strong> <strong>Nadu</strong> for reducing Carbonemissions through Clean Development Mechanism (CDM) processespecially in the areas of biomass and bagasse cogeneration, solar38
<strong>Twelfth</strong> <strong>Five</strong> <strong>Year</strong> <strong>Plan</strong> <strong>Tamil</strong> <strong>Nadu</strong>and landfill. Being a leader in wind energy, the State has alreadyexploited the benefit of CDM. Reforestation and solar energy projectscan also offer scope to derive CDM benefits.State level Action <strong>Plan</strong>s for Climate Change (SAPCC) would beprepared by the State and adequate provisions will be made in the<strong>Twelfth</strong> <strong>Plan</strong>.<strong>Tamil</strong> <strong>Nadu</strong> has a long coastal line. The sea behaviour variesthroughout the year. Formation of cyclones, depression and lowpressure zones create problems frequently. Further, there is a needto protect lives and infrastructure in the Coastal regions from seaerosion. Hon’ble Chief Minister has directed to constitute a HighLevel Committee, consisting of the Chief Secretary, Additional ChiefSecretary, etc., to identify the critical/ affected coastal areas whichrequire immediate attention and to explore the need for additionalanti-sea erosion works and appropriate funds in addition to the 50works that are already identified at a cost of 200 crore.Disaster ManagementThe <strong>Twelfth</strong> <strong>Five</strong> <strong>Year</strong> <strong>Plan</strong> will actively address the vulnerabilityof the State and its people to uncertainties arising from naturalcalamities, economic downturns, and other man-made disasters andto mitigate their adverse effects. In a move to mitigate the cyclonichavoc, one lakh houses will be constructed in Cuddalore andVillupuram districts. Frequent cyclones causes extensive damagesto power supply infrastructure in the coastal areas and in order toreduce the impact, it is proposed to convert the overhead supply linesto underground cables at a cost of 490 crore in the affected districts.The Thane cyclone has caused extensive damages to the tree assets,created along the river/canal banks and the coastal belts by theForest Department. In order to bring back the greenery and revivethe ecosystem, restocking to an extent of 5535 ha of the affected areawith tree species like teak, casuarina, eucalyptus etc. has also beenproposed.39
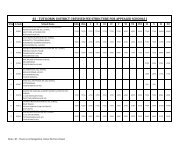
<strong>Twelfth</strong> <strong>Five</strong> <strong>Year</strong> <strong>Plan</strong> <strong>Tamil</strong> <strong>Nadu</strong>There has been a paradigm shift in the focus of the disastermanagement from response-centric activities like rescue, relief andrehabilitation to “Prevention, Mitigation and Preparedness”. The Stateis in the process of strengthening disaster management capacity. Adedicated State Disaster Rescue Force will also be formed.It is essential to recognise the possible influence of weatherand climate at all time scales – from days to decades, and plan forminimising its adverse impact and maximising its opportunities toachieve the development trajectories envisioned in the <strong>Twelfth</strong> <strong>Five</strong><strong>Year</strong> <strong>Plan</strong> and the Vision <strong>Tamil</strong> <strong>Nadu</strong> 2023 through a Climate RiskManagement framework. Therefore, the services of institutions suchas Regional Integrated Multi-Hazard Early Warning System for Africaand Asia (RIMES) are proposed to be utilised for <strong>Plan</strong>ning process forclimate risk management in the <strong>Twelfth</strong> <strong>Plan</strong> period.Monitorable TargetsThe <strong>Twelfth</strong> <strong>Plan</strong> sets target for many monitorable indicatorsthat are shown in Table 1.4. The GSDP growth target of 11 percentper annum in the <strong>Twelfth</strong> <strong>Plan</strong> means that all sectors need to growrapidly. Agriculture target is 5 percent while industry and servicestargets are 10.5 percent and 12.0 percent respectively. Althoughthese targets seem to be ambitious, they can be achieved with suitablestrategies as stated.40
<strong>Twelfth</strong> <strong>Five</strong> <strong>Year</strong> <strong>Plan</strong> <strong>Tamil</strong> <strong>Nadu</strong>Table 1.4: Monitorable Indicators and <strong>Twelfth</strong> <strong>Plan</strong> Targets in <strong>Tamil</strong> <strong>Nadu</strong>Sectors/ Monitorable IndicatorsIncome and PovertyTargets1. GSDP Growth (real) 11 percent per annum2. GSDP Agriculture (real) 5 percent per annum3. GSDP Industry (real)10.5 percent per annum (11.4 percent formanufacturing and 8.5 for non manufacturing)4. GSDP Services (real) 12.0 percent per annum5. Poverty ratio Reduced to 8 percent by 2017Employment6. Employment Opportunities 4 Million (0.8 Million each year)Education7. Dropout Rate (elementary schools) Zero8. Literacy Rate(gender gap in literacy)90 percent (8 percentage points)Health9. Infant Mortality Rate 13 per 1000 live births by 201710. Maternal Mortality Ratio 44 per 100000 live births by 201711. Total Fertility Rate 1.6 by 201712. Life Expectancy at birth 70 years for male and 73 years for female by 2017Women and Children13. Child (0-3 years) Malnutrition 16 percent by 201714. Anaemia among Women 33.2 percent by 201715. Sex ratio 998 by 201716. Juvenile sex ratio (0-6 yrs) 965 by 2017Infrastructure and Environment17. Electrification of Households To all18. Clean Drinking Water To all41
<strong>Twelfth</strong> <strong>Five</strong> <strong>Year</strong> <strong>Plan</strong> <strong>Tamil</strong> <strong>Nadu</strong>The detailed target growth rates for each sector are given in Table 1.5.Table 1.5: Target Growth Rates for Sectors - <strong>Tamil</strong> <strong>Nadu</strong>Sectors Growth Rate (%)1. Agriculture 5.01.1 Agriculture and Allied Activities 5.01.2 Forestry and Logging 5.01.3 Fishing 5.02. Industry 10.52.1 Mining and Quarrying 8.52.2 Manufacturing 11.42.3 Electricity, Gas and Water Supply 8.52.4 Construction 8.53. Services 12.03.1 Trade, Hotels and Restaurants 13.03.2 Transport, Storage and Communications 10.83.2.1 Railways 9.03.2.2 Transport by Other Means 11.03.2.3 Storage. 13.03.2.4 Communication 11.03.3 Financing, Insurance, Real Estates and Business Services 11.23.3.1 Banking and Insurance 11.83.3.2 Real Estate, Ownership of Dwelling and Business Services 10.73.4 Community, Social and Personal Services 12.8Gross State Domestic Product (GSDP) 11.0Size of the <strong>Twelfth</strong> <strong>Plan</strong>The total outlay in the <strong>Twelfth</strong> <strong>Plan</strong> is estimated at 2,11,250crore. The share of central assistance is projected at 24,565 crore.As <strong>Tamil</strong> <strong>Nadu</strong> sets ambitious growth targets in the <strong>Twelfth</strong> <strong>Plan</strong>,huge investments are needed to achieve them. Private sector isexpected to play a crucial role, by undertaking various Public PrivatePartnership (PPP) models particularly in energy, and infrastructuredevelopment. Public-Public Partnership model in specific areas willalso be encouraged to ensure the attainment of set goals.Mobilizing resources to finance the <strong>Twelfth</strong> <strong>Plan</strong> will call for amajor effort at generating tax and non tax revenues and improvingthe resource generation capacity of the Public Sector Enterprises42
<strong>Twelfth</strong> <strong>Five</strong> <strong>Year</strong> <strong>Plan</strong> <strong>Tamil</strong> <strong>Nadu</strong>and also controlling non <strong>Plan</strong> expenditures of the State <strong>Government</strong>.The necessary resources will be obtained by maintaining a steady 3percent fiscal deficit to GSDP ratio, a surplus on revenue accountof 2 percent of GSDP, and leveraging the resultant 5 percent capitalexpenditure to GSDP ratio to an even higher level by fostering strategicPublic Private Partnerships. These issues are examined in detail inthe next Chapter on Financing the <strong>Plan</strong>.43
<strong>Twelfth</strong> <strong>Five</strong> <strong>Year</strong> <strong>Plan</strong> <strong>Tamil</strong> <strong>Nadu</strong>44
<strong>Twelfth</strong> <strong>Five</strong> <strong>Year</strong> <strong>Plan</strong> <strong>Tamil</strong> <strong>Nadu</strong>Chapter - IIFinancing the <strong>Plan</strong>The <strong>Twelfth</strong> <strong>Plan</strong> of <strong>Tamil</strong> <strong>Nadu</strong> aims to achieve an Accelerated,Innovative and Inclusive Growth. Its broad vision includes severalinter related components that are broadly consistent with ten mainthemes identified in the “Vision <strong>Tamil</strong> <strong>Nadu</strong> 2023” document. The<strong>Twelfth</strong> <strong>Plan</strong> is in fact the road map of the Vision <strong>Tamil</strong> <strong>Nadu</strong> 2023.Total outlay in the <strong>Twelfth</strong> <strong>Plan</strong> is estimated at 2,11,250 croreat current prices. This Chapter presents projections of the likelyavailability of resources in the <strong>Twelfth</strong> <strong>Plan</strong> period given the targetGross State Domestic Product (GSDP) growth rate of 11 percent alongwith an overview of resources realised in the Eleventh <strong>Plan</strong>. It alsopresents a detailed account of sectoral allocations of proposed outlayin the <strong>Twelfth</strong> <strong>Plan</strong> and a comparison with corresponding allocationsin the Eleventh <strong>Plan</strong>.Resources in the Eleventh <strong>Plan</strong>The financing pattern during the Eleventh <strong>Plan</strong> is shown inTable 2.1. State <strong>Government</strong> resources are Own Fund, BudgetaryBorrowing and Central Assistance in the form of grants. The own fundsources are: Balance from Current Revenues (BCR), MiscellaneousCapital Receipts (MCR) and <strong>Plan</strong> Grants from <strong>Government</strong> of India.The sources of <strong>Government</strong> budgetary borrowing are: State ProvidentFund, Small Savings, Market Borrowings, Loans from NABARD,Externally Aided Projects (EAP) and others.45
<strong>Twelfth</strong> <strong>Five</strong> <strong>Year</strong> <strong>Plan</strong> <strong>Tamil</strong> <strong>Nadu</strong>The Eleventh <strong>Plan</strong> projected 91.7 percent of the total <strong>Plan</strong>resources from the State <strong>Government</strong> resources and the rest fromPublic Sector Enterprises (PSEs) and Local Bodies (LBs). The realisedState <strong>Government</strong> resource in the Eleventh <strong>Plan</strong> was 123.4 percent ofthe projected amount. The own fund was projected at 17,499 crore,but the realised amount at 25,214.2 crore was 144 percent of theprojected level. The realised central assistance as well as borrowingexceeded their projected levels.SourcesI. State <strong>Government</strong>Resources(a+b+c)(a) State OwnFund(b) BudgetaryBorrowings(c) CentralAssistanceII. Resources ofPublic SectorEnterprisesIII. Resources ofLocal BodiesAggregate<strong>Plan</strong> Resources(I+II+III)Table 2.1: Financial Resources for the Eleventh <strong>Plan</strong> - <strong>Tamil</strong> <strong>Nadu</strong>Projection(2007-2012)78280.5(91.72)17498.8(20.5)51375.1(60.2)9406.6(11.0)5463.5(6.4)1600.0(1.9)Realisation (Actual)crore2007-08 2008-09 2009-10 2010-11* 2011-12* Total2007-1215700.6(110.4)9072.8(63.8)4461.9(31.4)2165.8(15.2)-1676.3(-11.8)200.0(1.4)19718.5(121.2)6146.0(37.8)10194.8(62.6)3377.7(20.8)-3843.4(-23.6)400.0(2.5)19941.5(111.8)3648.6(20.5)14039.7(78.7)2253.3(12.6)-2343.7(-13.1)235.7(1.3)19244.3(94.0)4649.4(22.7)12453.1(60.9)2141.9(10.5)825.6(4.0)394.9(1.9)22027.0(93.6)1697.5(7.2)17437.0(74.1)2892.5(12.3)980.8(4.2)527.2(2.2)96631.8(104.7)25214.2(27.3)58586.5(63.5)12831.2(13.9)-6056.9(-6.6)1757.8(1.9)85344.0 14224.3 16275.1 17833.5 20464.8 23535.0 92332.7Figures in parentheses are percentages; * revised estimatesWhile the resources of the PSEs in the Eleventh <strong>Plan</strong> wereprojected at 6.4 percent of the total <strong>Plan</strong> resources, the realised sourcesof PSEs were in fact negative. While the Eleventh <strong>Plan</strong> projected1,600 crore from LBs, the actual realisation was 1,757.8 crore. It isnoted that while realised share of State <strong>Government</strong> resources washigher than its projected share, the realised share of LBs was almostthe same as the projected one. Evidence indicates that urban LBs46
<strong>Twelfth</strong> <strong>Five</strong> <strong>Year</strong> <strong>Plan</strong> <strong>Tamil</strong> <strong>Nadu</strong>have not been able to fully tap their property tax revenue potentials.Therefore, based on the recommendation of the Thirteenth FinanceCommission, the State proposes to constitute a State Level PropertyTax Board which will review the present property tax system and willmake suggestions for proper valuation of properties and assessmentof dues. This move will improve the financial status of LBs in the State.The aggregate realised amount for the whole <strong>Plan</strong> at 92,332.7 crorewas 108.2 percent of the projected level. Thus, the State <strong>Government</strong>resources increased sufficiently to finance the Eleventh <strong>Plan</strong>.The revenue account showed a surplus in three years ( 2007 -08, 2008-09 and 2011-12 ) of the Eleventh <strong>Plan</strong> period. While inother two years (2009-10 and 2010-11) the revenue account showeda deficit, the revenue deficit was less than 1 percent of GSDP (Chart2.1). The fiscal deficit relative to GSDP was kept below 3 percent in allyears except 2010-11. The borrowings, which were required to coverthe fiscal deficit, resulted in an increase in outstanding liabilities ofthe <strong>Government</strong>. At the end of the Eleventh <strong>Plan</strong>, the total liabilitiesincreased to 1,15,350 crore (Table.2.2). The share of total liabilities toGSDP was 19.83 percent which is acceptable as the <strong>Twelfth</strong> FinanceCommission suggested an overall target of 28 percent for the State asa whole.Chart 2.1: Revenue and Fiscal Deficit as Percent of GSDP47
<strong>Twelfth</strong> <strong>Five</strong> <strong>Year</strong> <strong>Plan</strong> <strong>Tamil</strong> <strong>Nadu</strong>Table 2.2: <strong>Tamil</strong> <strong>Nadu</strong> State Finances: Selected Fiscal AggregatesFiscal Indicators 2007-08 2008-09 2009-10 2010-11 2011-12 REcroreOwn Tax Revenues 29619 33684 36547 47782 59932Own Non-tax Revenues 3304 5712 5027 4651 5543State’s Own Revenue 32923 39396 41574 52434 65475Total Central Transfers 14597 15646 14270 17754 20078Share in Taxes and Duties 8065 8511 8756 10914 12715Grants 6532 7135 5514 6840 7363Total Revenue Receipts 47521 55042 55844 70188 85553Total Revenue Expenditure 42975 53590 59375 72916 85016Revenue Surplus/Deficit 4545 1452 -3531 -2729 537Fiscal Surplus/Deficit -3686 -8548 -11807 -16647 -16597Capital Outlay 7462 9104 8573 12436 16388Outstanding Liabilities 64655 74858 88883 101349 115350GSDP (current price) 350819 401336 473519 518576 581635As Percent of GSDPOwn Tax Revenues 8.44 8.39 7.72 9.21 10.30Own Non-tax Revenues 0.94 1.42 1.06 0.90 0.95State’s Own Revenue 9.38 9.82 8.78 10.11 11.26Total Central Transfers 4.16 3.90 3.01 3.42 3.45Share in Taxes and Duties 2.30 2.12 1.85 2.10 2.19Grants 1.86 1.78 1.16 1.32 1.27Total Revenue Receipts 13.55 13.71 11.79 13.53 14.71Total Revenue Expenditure 12.25 13.35 12.54 14.06 14.62Revenue Surplus/Deficit 1.30 0.36 -0.75 -0.53 0.09Fiscal Surplus/Deficit -1.05 -2.13 -2.49 -3.21 -2.85Capital Outlay 2.13 2.27 1.81 2.40 2.82Outstanding Liabilities 18.43 18.65 18.77 19.54 19.83Source (Basic Data): State Budget Documents of <strong>Tamil</strong> <strong>Nadu</strong>, various years. RE - Revised EstimatesAs a percentage of GSDP, own tax revenues in <strong>Tamil</strong> <strong>Nadu</strong>have traditionally been one of the highest among the major Statesfor many years. It was slated to be at 10.3 percent in 2011-12. Theslightly lower figure for own tax revenue relative to GSDP in 2009-10was due to the revenue impact of introduction of State Value AddedTax (VAT). Non tax revenue as a percentage of GSDP accounted formerely 1 percent.48
<strong>Twelfth</strong> <strong>Five</strong> <strong>Year</strong> <strong>Plan</strong> <strong>Tamil</strong> <strong>Nadu</strong>Fiscal transfers to <strong>Tamil</strong> <strong>Nadu</strong> come from Finance Commissiontransfers, <strong>Plan</strong> grants, and grants under various centrally sponsoredschemes. In the aggregate, the transfers remained around 3 to 4percent during the Eleventh <strong>Plan</strong> period except in 2007-08. In thatyear, it was about 4.2 percent. The Thirteenth Finance Commissionhas fixed <strong>Tamil</strong> <strong>Nadu</strong>’s share in total divisible pool of centraltaxes at 4.969 percent (5.047 percent in the case of service tax)as against 5.305 percent recommended by the <strong>Twelfth</strong> FinanceCommission. However, the Thirteenth Finance Commission hasrecommended a grant of 11,366.9 crore for the five year period(2010-15) towards maintenance of roads and bridges, improvingadministration of justice, Unique Identity (UID) Scheme, forests,water sector, elementary education etc.Financing the <strong>Twelfth</strong> <strong>Plan</strong>Table 2.3 (Chart 2.2) presents the resources of the <strong>Government</strong>of <strong>Tamil</strong> <strong>Nadu</strong> and its funding in the <strong>Twelfth</strong> <strong>Plan</strong>. The own fundavailable for the <strong>Twelfth</strong> <strong>Plan</strong> is estimated at 32,777 crore at currentprices. The central assistance to <strong>Tamil</strong> <strong>Nadu</strong> works out to be 24,565crore as against the realised amount of 12,831 crore in the Eleventh<strong>Plan</strong> period. Budgetary borrowings are projected at 1,43,768 croreas against the realised amount of 58,587 crore in the Eleventh <strong>Plan</strong>.Thus, <strong>Twelfth</strong> <strong>Plan</strong> projects about 95 percent of resources from theState <strong>Government</strong> sources of which large portion is a budgetaryborrowing. The rest is projected from PSEs and LBs.It is noted that the projected share of State’s own fund in the<strong>Twelfth</strong> <strong>Plan</strong> is less than its realised share in the Eleventh <strong>Plan</strong>. Partlythe reason is that while the State has suffered a huge revenue losson account of the Central Sales Tax (CST) rate reduction, the centrehas restricted the CST compensation for 2010 - 11 by deducting theadditional revenue realised through the revision of Value Added Tax(VAT) rate from 4 to 5 percent. It has also been decided to stop theCST compensation from 2011-12. The State also anticipates a hugerevenue loss if proposed Goods and Services Tax (GST) is implementedby the Centre.49
<strong>Twelfth</strong> <strong>Five</strong> <strong>Year</strong> <strong>Plan</strong> <strong>Tamil</strong> <strong>Nadu</strong>Table 2.3: Eleventh <strong>Plan</strong> Realisation and <strong>Twelfth</strong> <strong>Plan</strong> Resources - <strong>Tamil</strong> <strong>Nadu</strong> ( crore)SourcesEleventh <strong>Plan</strong> (2007-12)Realisation<strong>Twelfth</strong> <strong>Plan</strong> (2012-17)Projections1. State’s Own Fund 25214 327772. State <strong>Government</strong>’sBudgetary Borrowing58587 1437683. Central Assistance 12831 24565I. State <strong>Government</strong> Resources(1+2+3)96632 201110II. Resources of Public SectorEnterprises- 6057 6542III. Resources of Local Bodies 1758 3598Aggregate <strong>Plan</strong> Resources(I+II+III)92333 211250Chart 2.2: Eleventh <strong>Plan</strong> Realisation and <strong>Twelfth</strong> <strong>Plan</strong> Resources ( in %)( Percentage )Table 2.4 presents the year wise projected resources of the<strong>Government</strong> of <strong>Tamil</strong> <strong>Nadu</strong> for financing the <strong>Twelfth</strong> <strong>Plan</strong> in currentprices. Own fund is projected to increase from 1,983 crore in 2012-13 to 10,202 crore in 2016-17. <strong>Government</strong> budgetary borrowingis estimated to increase from 20,716 crore in 2012-13 to 38,125crore in 2016-17. The Central assistance is expected to increase from3,473 crore in 2012-13 to 6,675 crore in 2016-17.50
<strong>Twelfth</strong> <strong>Five</strong> <strong>Year</strong> <strong>Plan</strong> <strong>Tamil</strong> <strong>Nadu</strong>It may be noted that Normal Central Assistance (NCA) isprojected at 664 crore for the year 2012-13. The State has requestedthe Union <strong>Plan</strong>ning Commission to recommend an increase of theNCA level to at least 20 percent of the Annual <strong>Plan</strong> Outlay, with agrant component of 50 percent as against the present level of 30percent.Table 2.4: <strong>Year</strong> wise Scheme of Financing for <strong>Twelfth</strong> <strong>Plan</strong> - <strong>Tamil</strong> <strong>Nadu</strong> ( crore)Sources 2012-13 2013-14 2014-15 2015-16 2016-17Total2012-17a.Balance from Current Revenues 3146.25 6555.03 7992.39 9461.67 10757.76 37913.1b.Miscellaneous Capial Receipts -2098.94 -1731.87 -1924.44 -1447.46 -1124.95 -8327.66c.<strong>Plan</strong> grants from GoI (TFC) 935.9 547.74 569.24 569.24 569.24 3191.36I. Own Fund (a+b+c) 1983.21 5370.9 6637.19 8583.45 10202.05 32776.8d.Net Accretion to State ProvidentFund1322.79 1455.07 1600.58 1760.64 1936.7 8075.78e. Gross Small Savings 2000 2000 2000 2000 2000 10000f. Net Market Borrowing 16931.33 20231.45 24086.6 28604.79 33921.72 123775.89II Gross Borrowing (d+e+f) 20254.12 23686.52 27687.18 32365.43 37858.42 141851.67g.NABARD 1500 1500 1500 1500 1500 7500h.Others (HUDCO,PFC,NCDC,etc) 70.77 74.31 78.03 81.93 86.03 391.07i.Loan portion of ACA for EAP 3.69 3.00 0.00 0.00 0.00 6.69j.Loans for EAPs 1582.56 1661.69 1744.77 1832.01 1923.61 8744.64k.Other Loans 25 25 25 25 25 125III Gross Negotiated Loans(g+h+i+j+k)3182.02 3264 3347.8 3438.94 3534.64 16767.4l.Repayment of GoI Loans 550.74 595.17 648.94 696.49 717.51 3208.85m.Repayment of NSSF 1224.39 1251.09 1254.17 1288.91 1401.88 6420.44n.Repayment of Negotiated Loans 865.96 909.26 954.72 1002.46 1052.58 4784.98o.Repayments - Others 79.05 83 87.15 91.51 96.09 436.8IV Repayments (l+m+n+o) 2720.14 2838.52 2944.98 3079.37 3268.06 14851.07V. Budgetary Borrowing (II+III-IV) 20716.00 24112.00 28090.00 32725.00 38125.00 143768p.Normal Central Assistance 664.42 784.02 909.46 1064.07 1276.88 4698.85q. ACA for EAPs 153.44 181.06 210.03 245.74 294.89 1085.16r.Others 2655.62 3133.63 3635.01 4252.96 5103.55 18780.77VI. Central Assistance (p+q+r) 3473.48 4098.71 4754.50 5562.77 6675.32 24564.78s.Internal Resources -11681.74 -12032.19 -12393.16 -12764.95 -13147.90 -62019.94t.Extra Budgetary Resources 12919.71 13302.31 13698.37 14109.33 14532.68 68562.40VII. Resources of PSEs (s+t) 1237.97 1270.12 1305.21 1344.38 1384.78 6542.46u.Urban Local Bodies 328.55 361.4 397.54 437.29 481.02 2005.80v.Rural Local Bodies 260.79 286.87 315.56 347.11 381.83 1592.16VIII. Resources of Local bodies (u+v) 589.34 648.27 713.1 784.4 862.85 3597.96Aggregate <strong>Plan</strong> Resources(I+V+VI+VII+VIII)28000.00 35500.00 41500.00 49000.00 57250.00 21125051
<strong>Twelfth</strong> <strong>Five</strong> <strong>Year</strong> <strong>Plan</strong> <strong>Tamil</strong> <strong>Nadu</strong>Eleventh <strong>Plan</strong> OutlayThe proposed outlay in the Eleventh <strong>Plan</strong> was 85,344 crorewhich was more than double the proposed outlay in the Tenth <strong>Plan</strong> of40,000 crore (Table 2.5). The highest priority was given to the socialservices. The outlay for this sector was 36,732 crore as against itsoutlay of 13,632 crore in the Tenth <strong>Plan</strong>. The next priority was givento transport with an outlay of 11,647 crore and then agriculture,irrigation, flood control with an outlay of 11,145 crore. Energy outlaywas 10,743 crore as against its Tenth <strong>Plan</strong> outlay of 8,030 crore.Table 2.5: <strong>Plan</strong> Outlays: Tenth, Eleventh and <strong>Twelfth</strong> <strong>Plan</strong>s - <strong>Tamil</strong> <strong>Nadu</strong> ( crore)Sectors Tenth <strong>Plan</strong> Eleventh <strong>Plan</strong> <strong>Twelfth</strong> <strong>Plan</strong>Agriculture, Irrigation and Flood Control 6307 11145 29380Rural Development 4100 10241 23869Energy 8030 10743 27517Industry and Minerals 555 3716 5468Transport 6730 11647 20854Science and Technology 160 147 414Economic Services 176 284 3879Social Services 13632 36732 99404General Services 310 689 465Total Outlay 40000 85344 211250<strong>Twelfth</strong> <strong>Plan</strong> OutlayTotal outlay in the <strong>Twelfth</strong> <strong>Plan</strong> needed for 11 percent growthof the economy is projected at 2,11,250 crore. This is 2.48 timesthe proposed outlay of 85,344 crore in the Eleventh <strong>Plan</strong> and5.3 times the outlay of 40,000 crore in the Tenth <strong>Plan</strong> (Table 2.5and Chart 2.3). Social services get priority with a share of 47 percentof the total outlay. As this sector includes education, health andnutrition, water supply, sanitation, urban development, housing andsocial welfare, the <strong>Twelfth</strong> <strong>Plan</strong> proposes an outlay of 99,404 crorefor this sector, which is about 2.7 times the corresponding outlay inthe Eleventh <strong>Plan</strong>.52
<strong>Twelfth</strong> <strong>Five</strong> <strong>Year</strong> <strong>Plan</strong> <strong>Tamil</strong> <strong>Nadu</strong>Agriculture,irrigation, flood control and rural developmenttogether get a share of 25.2 percent in the <strong>Twelfth</strong> <strong>Plan</strong>. The proposedoutlay for these sectors is 53,249 crore, which is about 2.49 timesthe corresponding outlay of 21,386 crore in the Eleventh <strong>Plan</strong>. Theshare of energy sector is 13.0 percent while the share of transportsector is about 9.9 percent. Others including industry and mineralsget a combined share of about 3 percent. It may be noted that theshares of many of these sectors have fallen despite their being in thepriority list. This is not a reflection of lack of priority but a reflectionof a conscious policy to shift from public sector funding in thesesectors to a strategy of increased Public-Private- Partnership.Chart 2.3: <strong>Plan</strong> Outlays: Tenth, Eleventh and <strong>Twelfth</strong> <strong>Plan</strong>sSectoral Outlays: <strong>Twelfth</strong> <strong>Plan</strong>A detailed break up of sectoral outlay in the <strong>Twelfth</strong> <strong>Plan</strong> is shownin Table 2.6. Within agriculture and allied activities, Crop Husbandryand Horticulture ( 7,923 crore) are given the highest priority with acombined share of 3.8 percent, followed by Cooperation (1.5 percentshare) and Forestry and Wildlife (1.0 percent share). While the share53
<strong>Twelfth</strong> <strong>Five</strong> <strong>Year</strong> <strong>Plan</strong> <strong>Tamil</strong> <strong>Nadu</strong>of Major and Medium Irrigation and Flood Control is 4.1 percent oftotal outlay, the share of Minor Irrigation is 0.8 percent. Within theEnergy sector, the power (conventional) share is 12.6 percent whilethe non-conventional energy share is 0.4 percent. About 9.9 percentof proposed outlay is for Transport.The proposed outlay for General and Technical Educationis 18,092 crore, accounting for 8.6 percent of the total outlay. WaterSupply and Sanitation in the <strong>Twelfth</strong> <strong>Plan</strong> is being given higherallocation of 5.4 percent in line with the State’s commitment toprovide world class infrastructure facilities. The State has allocated9.0 percent for Social Welfare and Social Security sector. To meetthe increased demand for urban amenities and infrastructure, the<strong>Twelfth</strong> <strong>Plan</strong> allocates 6.0 percent of the total proposed outlay forUrban Development. It allocates 5.1 percent for Medical and PublicHealth. The share of the Nutrition in the proposed outlay is 5.3percent. The <strong>Twelfth</strong> <strong>Plan</strong> proposes 4.2 percent of total outlay for thewelfare of SCs, STs and OBCs, 1.1 percent for Labour Welfare, 1.6percent for Housing and 1.6 percent for Civil Supplies (Table 2.6).54
<strong>Twelfth</strong> <strong>Five</strong> <strong>Year</strong> <strong>Plan</strong> <strong>Tamil</strong> <strong>Nadu</strong>SectorsAgriculture & Allied ActivitiesCrop Husbandry andHorticultureTable 2.6: Sectoral Allocation in <strong>Twelfth</strong> <strong>Plan</strong> - <strong>Tamil</strong> <strong>Nadu</strong>Outlaycrore% tototalSectorsOutlaycroreScience, Technology & Environment% tototal7923 3.8 Scientific Services & Research 177 0.1Agriculture Research & Education 1924 0.9 Ecology & Environment 237 0.1Food Storage, Ware Housing etc 541 0.3 General Economic ServicesSoil & Water Conservation 1203 0.6Secretariat EconomicServices20 0.0Animal Husbandry 1661 0.8 Tourism 364 0.2Dairy Development 339 0.2Economic Advice andStatistics34 0.0Fisheries 1874 0.9 Weights and Measures 11 0.0Forestry & Wild Life 2146 1.0 Civil Supplies 3450 1.6Cooperation 3066 1.4 Social ServicesRural Development (RD) General Education 16062 7.6Special Program for R.D. 23869 11.3 Technical Education 2030 1.0Irrigation & Flood Control Sports & Youth Services 1339 0.6Minor Irrigation 1622 0.8 Art & Culture 201 0.1Command Area Development 148 0.1 Medical & Public Health 10832 5.1Major, Medium Irrigation, FloodControl6933 3.3 Water Supply & Sanitation 11306 5.4EnergyHousing (Incl. PoliceHousing)3383 1.6Power 26719 12.6 Urban Development 12685 6.0Non-Conventional Energy 798 0.4 Information & Publicity 27 0.0Industry & Minerals Welfare of SCs/STs/OBCs 8783 4.2Other Industries (other than VSI) 1133 0.5 Labour & Labour Welfare 2408 1.1Information Technology 433 0.2 Social Welfare & Security 19062 9.0Village & Small Industries 3873 1.8 Nutrition 11285 5.3Minerals 29 0.0Other Social and CommunityServices2 0.0TransportGeneral ServicesRoads and Bridges 16911 8.0 Stationery & Printing 8 0.0Road and Inland water Transport 3942 1.9 Public Works 457 0.2Grand Total 211250 10055
<strong>Twelfth</strong> <strong>Five</strong> <strong>Year</strong> <strong>Plan</strong> <strong>Tamil</strong> <strong>Nadu</strong>Externally Aided Projects (EAP)EAPs have become an important component of <strong>Plan</strong> assistance.The State has been availing assistance for development projectsfrom External Donor Agencies-World Bank, Japan InternationalCooperation Agency (JICA), German Development Bank and AsianDevelopment Bank. The assistance is generally extended to the Statethrough <strong>Government</strong> of India. The Department of Economic Affairs(DEA) in the Ministry of Finance, <strong>Government</strong> of India is the nodalagency for receiving foreign assistance from multilateral/bilateralagencies and is responsible for all policy issues pertaining to externalaid received by the Central <strong>Government</strong>. The DEA plays an importantrole in prescribing limits, if any, for external borrowings (sector-wiseor lender-wise), developing pipeline projects, negotiating externalassistance and monitoring implementation.In recent years, the scope of the externally aided projects haswidened. The State has been able to create assets in the field ofEnergy, Irrigation, Roads, Health, Forestry, Animal Husbandry etc.through such assistance. In spite of resource constraints, the Stateis able to take up a lot of developmental projects due to receipt ofassistance from the Donor Agencies. The availability of external aidhas enabled the implementation of several developmental schemes inthe State.EAP in Eleventh and <strong>Twelfth</strong> <strong>Plan</strong>Table 2.7 provides the details of EAPs continuing from theEleventh <strong>Plan</strong>, new schemes commencing from 2012-13 and alsothe details of EAPs that are in the pipeline. The proposals for theprojects in pipeline have been forwarded to the concerned Ministry in<strong>Government</strong> of India.56
<strong>Twelfth</strong> <strong>Five</strong> <strong>Year</strong> <strong>Plan</strong> <strong>Tamil</strong> <strong>Nadu</strong>Table 2.7: Details of Externally Aided Projects (EAP) in <strong>Twelfth</strong> <strong>Five</strong> <strong>Year</strong> <strong>Plan</strong> - <strong>Tamil</strong> <strong>Nadu</strong>Name of the Project Funding Agency croreA. Ongoing Projects<strong>Tamil</strong> <strong>Nadu</strong> Afforestation Project TAP-IIJapan InternationalCooperation Agency (JICA)567.42<strong>Tamil</strong> <strong>Nadu</strong> Urban Development Project III IBRD/World Bank 1884.21Pudhu Vaazhvu Project IDA/World Bank 717.1Hydrology Project IBRD/World Bank 25.27Post Tsunami Sustainable Livelihoods Program IFAD 283.71Irrigated Agriculture Modernisation and WaterBodies Restoration and Management project IBRD&IDA/World Bank 2547(IAMWARM) Project<strong>Tamil</strong> <strong>Nadu</strong> Urban Infrastructure Project JICA 344.7Hogenakkal Water Supply JICA 1928.8Sustainable Municipal Infrastructure Financing in<strong>Tamil</strong> <strong>Nadu</strong> (SMIF)Additional Financing <strong>Tamil</strong> <strong>Nadu</strong> Health SystemProject (TNHSP)KfW German DevelopmentBank500IDA/World Bank 627.72Additional Financing Pudhu Vaazhvu Project IDA/World Bank 950<strong>Tamil</strong> <strong>Nadu</strong> Bio Diversity and Greening Project JICA 686.00B. New ProjectDam Rehabilitation and Improvement Project World Bank 745C. Projects in PipelineTourism Infrastructure Development Project JICA 598Power Transmission & Energy Project JICA 3573<strong>Tamil</strong> <strong>Nadu</strong> Investment Promotion Project JICA 1000<strong>Tamil</strong> <strong>Nadu</strong> Road Sector Project - Strategic OptionalStudy (SOS) Phase -IITo be decided 8000Cauvery Delta Climatic Change Adoption Project ADB 1560Disaster Risk Reduction Project World Bank 1142.75The State finances are stable and well managed. The State meetsthe requirements of Fiscal Responsibility and Budget Management(FRBM) Act. It has a revenue surplus in 2011-12 and its fiscal deficitis less than 3 percent to GSDP in 2011-12. Its debt is also undercontrol. The additional resource mobilisation measures taken by the<strong>Government</strong> is expected to yield good revenue growth. Hence, theState will certainly be able to finance the <strong>Twelfth</strong> <strong>Plan</strong> targets.57
<strong>Twelfth</strong> <strong>Five</strong> <strong>Year</strong> <strong>Plan</strong> <strong>Tamil</strong> <strong>Nadu</strong>58
<strong>Twelfth</strong> <strong>Five</strong> <strong>Year</strong> <strong>Plan</strong> <strong>Tamil</strong> <strong>Nadu</strong>59
<strong>Twelfth</strong> <strong>Five</strong> <strong>Year</strong> <strong>Plan</strong> <strong>Tamil</strong> <strong>Nadu</strong>60