Experiment GB-2: Membrane Permeability - iWorx
Experiment GB-2: Membrane Permeability - iWorx
Experiment GB-2: Membrane Permeability - iWorx

Create successful ePaper yourself
Turn your PDF publications into a flip-book with our unique Google optimized e-Paper software.
<strong>Experiment</strong> <strong>GB</strong>-2: <strong>Membrane</strong> <strong>Permeability</strong>Exercise 1: Movement of Small Positive Ions Across a <strong>Membrane</strong>Aim: To determine if small, positively charged, hydrogen ions can move across a membrane from aregion of higher concentration (1.0M HCl) to a region of lower concentration (deionized water).Procedure1. Using the equipment from the calibration exercise, place 100 mL of room temperaturedeionized (DI) water in a clean 250 ml beaker. Add a stir bar to the beaker and place the beakeron the magnetic stirrer. Turn on the stirrer and position the stir bar to one side of the beakerbottom.2. Remove the ISE-100 pH electrode from the beaker of deionized water used at the end ofcalibration. Blot the drops of DI water from the electrode. Mount the electrode in a clamp onthe ringstand and position it over the new beaker of deionized water. Carefully lower the tip ofthe electrode into the beaker.3. Turn on the stirrer so that the stir bar rotates slowly and evenly.4. Click Record on the LabScribe Main window to begin recording. When the recording on thechannel reaches a stable baseline, type DI Water in the Mark box to the right of the Markbutton. Press the Enter key on the keyboard to mark the recording.5. After recording at least fifteen seconds of stable baseline, type the words Dialysis Tube w/ 1.0MHCl in the Mark box to the right of the Mark button.6. Lower the dialysis tube into the deionized water and press the Enter key on the keyboard tomark the recording. Clamp the dialysis tube to the edge of the beaker so that about half thesolution in the tube is below the surface of the deionized water. Make sure the bottom of thedialysis tube is not touching the stir bar.7. Record the pH of the deionized water for five minutes.8. Mark the recording at the 1 minute interval, type 1 minute in the Mark box to the right of theMark button and press the Enter key on the keyboard to mark the recording.9. Repeat Step 8 for the 2, 3, 4, and 5 minute intervals.10. At the end of five minutes, click Stop to halt the recording.11. Select Save in the File menu.12. Turn off the magnetic stirrer. Remove the dialysis tube with the 1.0M HCl from the beaker anddiscard the dialysis sac as directed.13. Remove the pH electrode from the beaker. Hold the electrode over the beaker used forcollecting waste liquid, and rinse it with deionized water from a wash bottle. Blot any drops ofwater from the electrode and place it in a beaker of deionized water.14. Remove the stir bar from the beaker of deionized water and rinse it with deionized water from awash bottle. Discard the deionized water.<strong>iWorx</strong> Sample LabGeneral Biology-Ecology – <strong>Membrane</strong><strong>Permeability</strong> – Labs<strong>GB</strong>-2-1Copyright <strong>iWorx</strong> Systems Inc.Note: Only for evaluation by prospective customers.
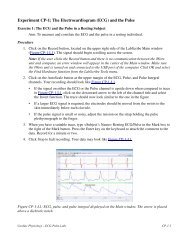
Data Analysis1. Scroll to the section of data recorded in which the pH changes of deionized water treated withthe 1.0M HCl dialysis tubing were recorded as shown in Figure <strong>GB</strong>-2-L1.Figure <strong>GB</strong>-2-L1: Recording of the changes in pH over a 5 minute period with the 1.0 M HCl dialysistubing in deionized water.2. Use the Display Time icons on the LabScribe toolbar to position the complete recording on theMain window. The required data can also be selected by:• Placing the cursors on either side of the section of data needed. Place one cursor on thestable pH level recorded from pure deionized water. Place the second cursor on thestable pH level recorded after a total 5 minutes with the 1.0M HCl dialysis sac immersedin the deionized water• Clicking the Zoom between Cursors button on the LabScribe toolbar to expand thesegment of data to the width of the Main window.3. Click on the Analysis window icon in the toolbar or select Analysis from the Windows menu totransfer the data displayed in the Main window to the Analysis window (Figure <strong>GB</strong>-2-L2).4. Look at the Function Table that is above the uppermost channel displayed in the Analysiswindow. The mathematical functions that are listed should include Title, Value1, Value2, andV2-V1. The values for these parameters from each channel are seen in the table across the topmargin of each channel.5. Once the cursors are placed in the correct positions for determining the pH, the values for pHcan be recorded in the on-line notebook of LabScribe by typing the names and values directlyinto the Journal.<strong>iWorx</strong> Sample LabGeneral Biology-Ecology – <strong>Membrane</strong><strong>Permeability</strong> – Labs<strong>GB</strong>-2-2Copyright <strong>iWorx</strong> Systems Inc.Note: Only for evaluation by prospective customers.
Figure <strong>GB</strong>-2-L2: The membrane permeability data displayed in the Analysis window, showing thevalues at each cursor and the pH change over time with the addition on a dialysis tube of 1.0 M HCl.6. The functions in the channel pull-down menus of the Analysis window can also be used to enterthe names and values of the parameters from the recording to the Journal. To use thesefunctions:• Place the cursors at the locations used to measure the pH from the pH channel.• Transfer the name of the mathematical function used to determine the pH to the Journalusing the Add Title to Journal function in the pH channel pull-down menu.• Transfer the value for the pH to the Journal using the Add Ch. Data to Journal functionin the pH channel pull-down menu.7. Place a cursor on the stable baseline recorded just before the dialysis tubing containing 1.0MHCl was lowered into the beaker of deionized water. Place the second cursor at the point in therecording that is five minutes after the dialysis tubing was placed in the water.8. Measure the values for the following parameters from the pH channel for the region of dataselected:• pH-DI Water, which is Value1 on the pH channel.• 5 minutes, which is Value2 on the pH channel.9. Record the values for these parameters in the Journal using one of the procedures described inStep 6, and in Table <strong>GB</strong>-2-L1.10. Measure the Overall Change in pH using the parameter, V2-V1, from the Function Table in theAnalysis window.11. Divide the Overall Change in pH by the initial pH of the DI water to determine the percentchange in pH.<strong>iWorx</strong> Sample Lab12. Click Save in the File menuGeneral Biology-Ecology – <strong>Membrane</strong><strong>Permeability</strong> – Labs<strong>GB</strong>-2-3Copyright <strong>iWorx</strong> Systems Inc.Note: Only for evaluation by prospective customers.
Exercise 2: Movement of Small Negative Ions Across a <strong>Membrane</strong>Aim: To determine if small, negatively charged, hydroxide ions can move across a membrane from aregion of higher concentration (1.0M NaOH) to a region of lower concentration (deionized water).Procedure1. Repeat Exercise 1 using the 1.0M NaOH dialysis sac in place of the 1.0M HCl.2. Mark the recording with appropriate labels to indicate the length of time the 1.0M NaOHdialysis sac was in the beaker of deionized water.3. Select Save in the File menu to add this data to the existing data file.4. Turn off the magnetic stirrer. Remove the dialysis tube with the 1.0M NaOH from the beakerand discard as directed.5. Remove the pH electrode from the beaker. Hold the electrode over the beaker used forcollecting waste liquid, and rinse it with deionized water from a wash bottle. Blot any drops ofwater from the electrode and place it in a beaker of deionized water.6. Remove the stir bar from the beaker of deionized water and rinse it with deionized water from awash bottle. Discard the deionized water.Data Analysis1. Use the same techniques used in Exercise 1 to measure the pH levels of the DI water after the1.0M NaOH dialysis sac was immersed in the deionized water.2. Use the same techniques explained in Exercise 1 to record the values of the pH levels in theJournal, and in Table <strong>GB</strong>-2-L1.3. Click Save in the File menu.Exercise 3: Movement of Large Ions Across a <strong>Membrane</strong>Aim: To determine if large, negatively charged, acetate ions can move across a membrane from aregion of higher concentration (1.0M Na Acetate) to a region of lower concentration.Procedure1. Repeat Exercise 1 using the 1.0M Na Acetate dialysis sac in place of the 1.0M HCl.2. Mark the recording with appropriate labels to indicate the length of time the 1.0M Na Acetatedialysis sac was in the beaker of deionized water.3. Select Save in the File menu to add this data to the existing data file.4. Turn off the magnetic stirrer. Remove the dialysis tube with the 1.0M Na Acetate from thebeaker and discard as directed.5. Remove the pH electrode from the beaker. Hold the electrode over the beaker used forcollecting waste liquid, and rinse it with deionized water from a wash bottle. Blot any drops ofwater from the electrode and place it in a beaker of deionized water.<strong>iWorx</strong> Sample LabGeneral Biology-Ecology – <strong>Membrane</strong><strong>Permeability</strong> – Labs<strong>GB</strong>-2-4Copyright <strong>iWorx</strong> Systems Inc.Note: Only for evaluation by prospective customers.
6. Remove the stir bar from the beaker of deionized water and rinse it with deionized water from awash bottle. Discard the deionized water.Data Analysis1. Use the same techniques used in Exercise 1 to measure the pH levels of the DI water after the1.0M Na Acetate dialysis sac was immersed in the deionized water.2. Use the same techniques explained in Exercise 1 to record the values of the pH levels in theJournal, and in the data table.3. Click Save in the File menu.Table <strong>GB</strong>-2-L1: Changes in pH during Movement of Ions.Solution in Dialysis TubingQuestions1.0M HCl1.0M NaOH1.0M Na AcetatepH LevelT=0 Mins T=5 Mins Change (∆)1. During the five minutes that the dialysis sac containing 1.0M HCl was placed in the beaker ofdeionized water, what happened to the pH of the water? What caused the result that yourecorded?2. During the five minutes that the dialysis sac containing 1.0M NaOH was placed in the beaker ofdeionized water, what happened to the pH of the water? What caused this result?3. During the five minutes that the dialysis sac containing 1.0M Na Acetate was placed in thebeaker of deionized water, what happened to the pH of the water?4. Explain how the movement of large particles causes a change in pH.5. If any of the ions diffused across the membrane, which one diffused more quickly?6. What factors could increase the rate of diffusion of an ion across a membrane?<strong>iWorx</strong> Sample LabGeneral Biology-Ecology – <strong>Membrane</strong><strong>Permeability</strong> – Labs<strong>GB</strong>-2-5Copyright <strong>iWorx</strong> Systems Inc.Note: Only for evaluation by prospective customers.