Sample Lab Report Jane Doe Intro to Cognitive Psych Lab Report ...
Sample Lab Report Jane Doe Intro to Cognitive Psych Lab Report ...
Sample Lab Report Jane Doe Intro to Cognitive Psych Lab Report ...

Create successful ePaper yourself
Turn your PDF publications into a flip-book with our unique Google optimized e-Paper software.
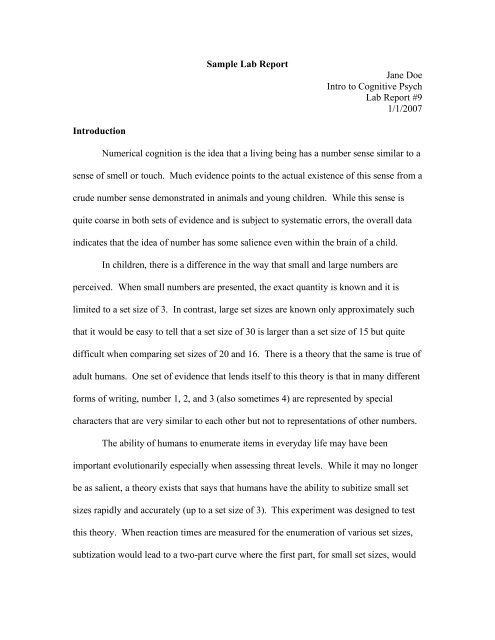
<strong>Sample</strong> <strong>Lab</strong> <strong>Report</strong><strong>Jane</strong> <strong>Doe</strong><strong>Intro</strong> <strong>to</strong> <strong>Cognitive</strong> <strong>Psych</strong><strong>Lab</strong> <strong>Report</strong> #91/1/2007<strong>Intro</strong>ductionNumerical cognition is the idea that a living being has a number sense similar <strong>to</strong> asense of smell or <strong>to</strong>uch. Much evidence points <strong>to</strong> the actual existence of this sense from acrude number sense demonstrated in animals and young children. While this sense isquite coarse in both sets of evidence and is subject <strong>to</strong> systematic errors, the overall dataindicates that the idea of number has some salience even within the brain of a child.In children, there is a difference in the way that small and large numbers areperceived. When small numbers are presented, the exact quantity is known and it islimited <strong>to</strong> a set size of 3. In contrast, large set sizes are known only approximately suchthat it would be easy <strong>to</strong> tell that a set size of 30 is larger than a set size of 15 but quitedifficult when comparing set sizes of 20 and 16. There is a theory that the same is true ofadult humans. One set of evidence that lends itself <strong>to</strong> this theory is that in many differentforms of writing, number 1, 2, and 3 (also sometimes 4) are represented by specialcharacters that are very similar <strong>to</strong> each other but not <strong>to</strong> representations of other numbers.The ability of humans <strong>to</strong> enumerate items in everyday life may have beenimportant evolutionarily especially when assessing threat levels. While it may no longerbe as salient, a theory exists that says that humans have the ability <strong>to</strong> subitize small setsizes rapidly and accurately (up <strong>to</strong> a set size of 3). This experiment was designed <strong>to</strong> testthis theory. When reaction times are measured for the enumeration of various set sizes,subtization would lead <strong>to</strong> a two-part curve where the first part, for small set sizes, would
e relatively flat and the second part, for larger set sizes, would be linear. If subitizationdoes not exist, the curve will be fully linear corresponding with increased reaction timefor each increase in set size.MethodsSubjects were seated in front of a computer screen. Instructions were presentedon the screen indicating that the subject should determine the number of items presentedon the screen. In this case, the items were small squares. Subjects were instructed thatthey should respond by pressing the key on the keyboard corresponding with the numberof items. Subjects finally were instructed <strong>to</strong> respond as quickly as possible but withoutsacrificing accuracy.The experiment itself consisted of 90 <strong>to</strong>tal trials where the number of itemspresented varied between one and nine items. Each of the nine set sizes was presented 10times and the order in which the set sizes were presented was random. Response timewas measured and was averaged based on the set sizes such that for each subject, the dataoutput of the experiment was nine response times each averaged from 10 trials. This datawas then averaged across the group and across the class and plotted versus set size.ResultsFigure 1 is a graph of my individual average response times for each set size(N=1). Figure 2 is a graph of the group average response times for each set size (N=4).Figure 3 is a graph of the class average response times for each set size (N=16).All three sets of data demonstrate that reaction time is positively correlated withset size. Figures 2 and 3 show for the group and class data that reaction time alwaysincreases with increased set size except for the largest set size. The reaction time
increases at a slower rate with the smaller set sizes as is evident by the smaller slope inthe left part of the graphs and begins <strong>to</strong> dramatically increase when the set size changesfrom three <strong>to</strong> four for Figure 2 and from four <strong>to</strong> five for Figure 3. Figure 1 indicates thatmy individual response times are generally faster than the group or class averages andalso that the sharp increase in my response time occurs when the set size changes fromfour <strong>to</strong> five. It also evident from examining the slopes at various points that in Figure 1,the rate of change in reaction time is less for almost all points when compared <strong>to</strong> theslopes in Figures 2 and 3. This is likely just due <strong>to</strong> the fact that Figures 2 and 3 showaverages of reaction times across groups of people whereas Figure 1 presents a singlesubject’s data. Examining other individual data (not shown) that fac<strong>to</strong>red in<strong>to</strong> Figures 2and 3 indicates that those slopes also differ from Figures 2 and 3 with some havinggreater slopes and some having smaller slopes.DiscussionThe data presented here in Figures 1, 2 and 3 clearly demonstrates thatsubitization does take place. The effect may clearly vary between individual data asFigure 1 demonstrates subitization of up <strong>to</strong> four and possibly five items while Figures 2and 3 demonstrate that average data shows subitization of up <strong>to</strong> three and possibly fouritems. Examination of the individual subject data that contributed <strong>to</strong> Figures 2 and 3demonstrates a wide range in reaction times for almost all set sizes indicating thatpossibly some individuals subitize more than four items while others subitize less andthat it is only upon averaging that a set size of four becomes the set size where a shiftfrom subitization <strong>to</strong> simply counting occurs.
It is quite interesting <strong>to</strong> note that when in Figures 2 and 3 the graphs switch <strong>to</strong>linear functions that the increase in reaction time per increase in set size is 300-350 ms.This is related <strong>to</strong> the word length effect wherein it takes an English speaking personapproximately 321 ms <strong>to</strong> articulate a number. What this possibly indicates is that once aset size threshold is reached, the subject resorts <strong>to</strong> counting and so the increase in reactiontime per increase in set size is as a result of the subject internally verbalizing eachnumber as he/she counts the items on the screen.Another interesting thing <strong>to</strong> note in all three figures is the flattening of the curvebetween set sizes of eight and nine. It is possible that this is simply an artifact of theexperiment as subjects were <strong>to</strong>ld that no set size would be higher than nine and so uponseeing a large number of squares on the screen the subject did not necessarily have <strong>to</strong>count all of them <strong>to</strong> determine how many were there and thus producing a shorterreaction time. An interesting way of testing this in the future would involve notinforming the subjects of the maximum set size used or in simply throwing in set sizesthat are larger than the ones that are actually being tested <strong>to</strong> see if it is truly an artifactand that subjects still need <strong>to</strong> internally count each item.There exist various theories for how subitization exists from associating certainset sizes <strong>to</strong> certain geometrical shapes (Mandler & Shebo, 1982) <strong>to</strong> those that believe thatthe small set size just lends itself <strong>to</strong> less error simply because they are small (Gallistel &Gellman, 2000). As mentioned in the introduction, I believe that it may have played avery key role evolutionarily especially in the realm of detecting preda<strong>to</strong>rs. The ability <strong>to</strong>determine two versus three preda<strong>to</strong>rs may determine whether or not an animal or humansought <strong>to</strong> defend their terri<strong>to</strong>ry or cede it because of a fear of losing <strong>to</strong> the preda<strong>to</strong>rs. It is
clearly not advantageous <strong>to</strong> subitize for large numbers in this case because a group of fivepreda<strong>to</strong>rs is equally as dangerous as a group of six preda<strong>to</strong>rs <strong>to</strong> a lone individual.Because subitization has subsisted throughout evolution it indicates that it is a hardwiredfunction and not something that is learned. Benefits of it in the current world are notimmediately clear however it may be useful for video game players who need <strong>to</strong> interactwith their visual world often more quickly than the average person needs <strong>to</strong>.ReferenceGallistel CR, Gelman II (2000). Non-verbal numerical cognition: From reals <strong>to</strong>integers. Trends in <strong>Cognitive</strong> Sciences, 4, 59-65.Mandler G, Shebo BJ (1982). Subitizing: An analysis of its component processes.FiguresIndividual Data25002000RT (ms)1500100050000 2 4 6 8 10Set SizeFigure 1. Reaction time was measured for determining the number of items presented ona computer screen. Set sizes varied between one and nine with each set size beingpresented 10 times. Reaction times shown are average across those 10 trials (N=1).
Group Data30002500RT (ms)20001500100050000 2 4 6 8 10Set SizeFigure 2. Reaction time was measured for determining the number of items presented ona computer screen. Set sizes varied between one and nine with each set size beingpresented 10 times. Reaction times shown are average across those 10 trials and thenaveraged across the group (N=4).Class Data30002500RT (ms)20001500100050000 2 4 6 8 10Set SizeFigure 3. Reaction time was measured for determining the number of items presented ona computer screen. Set sizes varied between one and nine with each set size beingpresented 10 times. Reaction times shown are average across those 10 trials and thenaveraged across the class (N=16).