Another key product, electrical machinery alsocontributed to overall export growth, with shipmentsreviving 1.3% after contracting 1.1% in August. Butthe level remains 3.9% below pre-disaster Februaryand is likely to stay weak as the global IT/digitalsector adjusts to slowing private demand in Chinaand stalling consumer spending in the US andEurope.On the downside, general machinery exports fell0.6% (–2.9% in August), marking a third straightdecline. Having suffered relatively little damagecompared to other sectors, general machineryexports stopped falling in April and by June the levelwas already 1.3% higher than in February. But thedeepening slowdown in the global manufacturingcycle has caused shipments of this key exportproduct to turn down. Exports of chemical productsalso remain weak, falling 0.2% (–0.1% in August).US-bound exports: First decline in five monthsA geographical breakdown of the September tradereport (seasonally adjusted, real basis, ourestimates) has US-bound exports turning sour for thefirst time in five months with a 1.5% m/m decline(4.1% in August). Even so, exports for Q3 overall areup a huge 20.3% q/q (compared with -5.4% q/q in Q1and -11.4% q/q in Q2), with quarterly gains beingposted by most products, except chemical productsand nonferrous metals. In addition to pronouncedquarterly recoveries by electrical machinery (12.6%q/q in Q3 from -9.8% q/q in Q2) and generalmachinery (8.3% from -3.9% in Q2), shipments oftransport equipment surged a phenomenal 56.6%(-14.1% in Q1, -25.1% in Q2), reflecting inventoryreplenishment. With monthly trade figures from Julyshowing exports to the US have lost momentum, itseems that the catch-up phase following the 11March disaster is over for most products, excepttransport equipment. With financial turmoil furtherundermining sentiment in American households andbusinesses, this year’s Christmas sales could drop,leading to a less bright outlook for Japanese exports.EU-bound exports: first decline in five monthsEU-bound shipments rose 2.3% m/m in September(0.0% in August) and grew 13.4% q/q in Q3 overall(-3.9% q/q in Q2). Products contributing to thequarterly gain include transport equipment (43.5%from -24.2% in Q2), electrical machinery (8.5% from0.0% in Q2), and general machinery (9.1%from -2.5% in Q2). But like shipments to the US, EUboundexports have lost momentum with the end ofthe post-disaster catch-up process. Making mattersworse, the eurozone’s deepening sovereign debtwoes have shaken the financial markets andsubstantially eroded growth expectations. It wouldnot be unexpected for exports to start trending lower.Asia-bound exports: Shipments to China stillbeing adjustedExports to Asia rose 2.5% m/m in September afterfalling 0.5% in August, and shipments in Q3 overallare up 5.8% q/q after plunging 8.4% q/q in Q2.Exports to China, Japan’s largest trading partner,rose 2.9% m/m in September after dropping 1.6% inAugust, and exports in Q3 overall recovered 8.6%q/q after plummeting 14.5% q/q in Q2. But comparedto pre-disaster January-February (we take a twomonthaverage because the February level isboosted by the Chinese New Year effect), exports toAsia and exports to China are still down 4.7% and10.3%, respectively. Trend-wise, exports to Chinahave been basically flat since July, a sluggishnessthat reflects the slowdown in the Chinese economythat began before Japan’s March disaster.Regarding products in Q3, China-bound shipmentsof transport equipment soared 63.4% q/q (-37.0% q/qin Q2) and electrical machinery shipments rose 8.8%q/q (-14.3% in Q2). While transport equipmentshipments have roughly returned to the normalJanuary-February average, electrical machineryshipments are still down by more than 10%. Generalmachinery exports to China posted a second straightquarterly decline (-10.4% q/q in Q2, -7.5% q/q in Q3):24.4% below normal, a grim indication of theweakness of Chinese domestic demand. Japanesedata for machine tool orders shows demand fromChina has yet to stabilise and is still trending lowerafter cresting at the start of the year.Real imports remain firm, as strong yen takesrootFinally turning to imports, real imports fell 2.8% m/m(2.5% in August), for the first setback in six months.Even so, real imports rose 2.8% q/q in Q3 (0.1% q/qin Q2), for a third straight quarterly advance. Thelevel as of September is 2.8% higher than predisasterFebruary. Such strong imports reflect threethings: the effect of yen appreciation (includingreverse imports by some companies), resurgentdemand for materials now that production hasrecovered and brisk demand for mineral fuel forthermal power generation, reflecting reduceddependence on nuclear power. In terms of products,mineral fuel imports rose 4.2% q/q (-3.4% q/q in Q2),transport equipment shipments surged 9.0% (-3.4%in Q2), electrical machinery shipments increased3.4% (-4.0% in Q2) and general machinery importspicked up the pace with 6.7% gains (2.0% in Q2).Ryutaro Kono/ Azusa Kato 27 October 2011<strong>Market</strong> <strong>Mover</strong>20www.Global<strong>Market</strong>s.bnpparibas.com
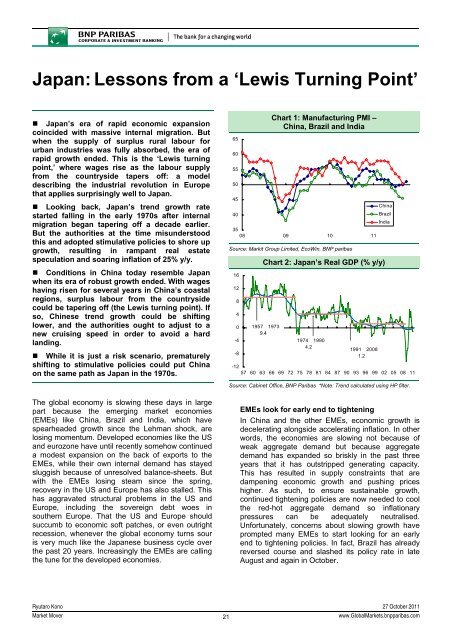
Japan: Lessons from a ‘Lewis Turning Point’• Japan’s era of rapid economic expansioncoincided with massive internal migration. Butwhen the supply of surplus rural labour forurban industries was fully absorbed, the era ofrapid growth ended. This is the ‘Lewis turningpoint,’ where wages rise as the labour supplyfrom the countryside tapers off: a modeldescribing the industrial revolution in Europethat applies surprisingly well to Japan.• Looking back, Japan’s trend growth ratestarted falling in the early 1970s after internalmigration began tapering off a decade earlier.But the authorities at the time misunderstoodthis and adopted stimulative policies to shore upgrowth, resulting in rampant real estatespeculation and soaring inflation of 25% y/y.• Conditions in China today resemble Japanwhen its era of robust growth ended. With wageshaving risen for several years in China’s coastalregions, surplus labour from the countrysidecould be tapering off (the Lewis turning point). Ifso, Chinese trend growth could be shiftinglower, and the authorities ought to adjust to anew cruising speed in order to avoid a hardlanding.• While it is just a risk scenario, prematurelyshifting to stimulative policies could put Chinaon the same path as Japan in the 1970s.65605550Chart 1: Manufacturing PMI –China, Brazil and <strong>India</strong>45China40Brazil<strong>India</strong>3508 09 10 11Source: Markit Group Limited, EcoWin, <strong>BNP</strong> paribas1612840-4-8Chart 2: Japan’s Real GDP (% y/y)195719739.4197419904.2 199120081.2-1257 60 63 66 69 72 75 78 81 84 87 90 93 96 99 02 05 08 11Source: Cabinet Office, <strong>BNP</strong> Paribas *Note: Trend calculated using HP filter.The global economy is slowing these days in largepart because the emerging market economies(EMEs) like China, Brazil and <strong>India</strong>, which havespearheaded growth since the Lehman shock, arelosing momentum. Developed economies like the USand eurozone have until recently somehow continueda modest expansion on the back of exports to theEMEs, while their own internal demand has stayedsluggish because of unresolved balance-sheets. Butwith the EMEs losing steam since the spring,recovery in the US and Europe has also stalled. Thishas aggravated structural problems in the US andEurope, including the sovereign debt woes insouthern Europe. That the US and Europe shouldsuccumb to economic soft patches, or even outrightrecession, whenever the global economy turns souris very much like the Japanese business cycle overthe past 20 years. Increasingly the EMEs are callingthe tune for the developed economies.EMEs look for early end to tighteningIn China and the other EMEs, economic growth isdecelerating alongside accelerating inflation. In otherwords, the economies are slowing not because ofweak aggregate demand but because aggregatedemand has expanded so briskly in the past threeyears that it has outstripped generating capacity.This has resulted in supply constraints that aredampening economic growth and pushing priceshigher. As such, to ensure sustainable growth,continued tightening policies are now needed to coolthe red-hot aggregate demand so inflationarypressures can be adequately neutralised.Unfortunately, concerns about slowing growth haveprompted many EMEs to start looking for an earlyend to tightening policies. In fact, Brazil has alreadyreversed course and slashed its policy rate in lateAugust and again in October.Ryutaro Kono 27 October 2011<strong>Market</strong> <strong>Mover</strong>21www.Global<strong>Market</strong>s.bnpparibas.com