GASOLINE ANALYSIS BY GC-UV-IMS - B & S Analytik GmbH
GASOLINE ANALYSIS BY GC-UV-IMS - B & S Analytik GmbH
GASOLINE ANALYSIS BY GC-UV-IMS - B & S Analytik GmbH
- No tags were found...

Create successful ePaper yourself
Turn your PDF publications into a flip-book with our unique Google optimized e-Paper software.
<strong>GASOLINE</strong> <strong>ANALYSIS</strong> <strong>BY</strong> <strong>GC</strong>-<strong>UV</strong>-<strong>IMS</strong>F. Li 1 , G.A. Eiceman 2 , V. Ruzsanyi 1 , J.I. Baumbach 11 Institut für Spektrochemie und Angewandte Spektroskopie (ISAS), Bunsen-Kirchhoff Str.11, 44139-Dortmund, Germany2 Department of Chemistry and Biochemistry, MSC 3C, New Mexico State University, PO Box30001, Las Cruces, NM 88003-8001, USAAbstractGasoline samples are very complex andmay contain hundreds of compounds. Thus,they are difficult to be separated. Gaschromatography (<strong>GC</strong>) and <strong>GC</strong> coupled withmass spectrometry (<strong>GC</strong>/MS) are frequentlyused for the analysis and characterization ofgasolines. Especially for the industrialapplications, gasolines needed to be ratherquickly classified. Therefore, this paper willfocus on the fast classification of gasolineusing 10.6 eV <strong>UV</strong>-<strong>IMS</strong>. The sample will beanalyzed within several minutes. The easydifferentiation will be shown, also.Additionally, a <strong>GC</strong>-<strong>IMS</strong> was succeeded toseparate different compounds found ingasoline. The detection of gasoline with <strong>GC</strong>-<strong>IMS</strong> and the results of investigations ofdifferent gasolines are presented anddiscussed in detail.IntroductionIon mobility spectrometers have beensuccessfully used for monitoring chemicalwarfare agents, illicit drugs and explosives. Inthis work, it was developed to differentiatediversity of gasolines. The main componentscan be separated with an efficienttemperature was set to 230°C. The carrier gaswas pure nitrogen the driftgas also nitrogen atchromatographic capillary separation before itwas measured using a 10.6 eV <strong>UV</strong>-<strong>IMS</strong>.Experimental<strong>UV</strong>-<strong>IMS</strong>The <strong>UV</strong>-<strong>IMS</strong> was an ISAS customdesignedion mobility spectrometer equippedwith a 10.6 eV <strong>UV</strong>-lamp as ionization source.Gasoline samples are introduced through aPDMS membrane permeation system. Thecalibration was performed by exponentialdilution, a glass flask was filled completelywith a test gas of a constant concentrationand then diluted exponentially using aconstant carrier gas flow of pure nitrogen.Parameters of the system for themeasurement are summarized in table 1.<strong>GC</strong>-<strong>UV</strong>-<strong>IMS</strong>Table 1: Parameters of the SystemParameter<strong>UV</strong>-<strong>IMS</strong>Ionisation source<strong>UV</strong>-lamp (10.6 eV)Length of the drift tube120 mmDrift voltage polarityPositiveElectric field strength317 V/cmShutter opening time1 msCarrier gas N 2 (99.999%)Carrier gas flow 255 mL/minDrift gas N 2 (99.999%)Drift gas flow300 mL/minDrift voltage+4.0 kVTemperature300 KThe gasoline No.4 was tested with our<strong>GC</strong>-<strong>UV</strong>-<strong>IMS</strong>, in addition. A Varian <strong>GC</strong> ovenwas used to obtain constant temperatureconditions for the column. The column usedwas HP-5 30 m x 0.32 mm x 1.05 µm filmthickness. The column temperature was set to30°C permanentely. The injectiona gas flow of 103 mL/min. The makeup gasnitrogen was flowing at 120 mL/min. A driftReceived for review July 4, 2003, Accepted September 20, 2003
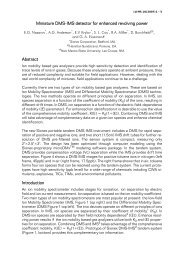
64 - Gasoline Analysis by <strong>GC</strong>-<strong>UV</strong>-<strong>IMS</strong> - IJ<strong>IMS</strong> 6(2003)2,63-66signal / VFigure 1: <strong>IMS</strong> Spectrum of gasoline1 and gasoline 2signal / V-0,8-0,6-0,4-0,20,0-3,0-2,5-2,0-1,5-1,0-0,50,010 15 20 25 30 35Drift Time / msgas. 1gas. 210 15 20 25 30 35Drift Time / msgas. 3gas. 4gas. 5following the PDMS membranepermeation. The spectra areshown in Figure …. Gasoline 1 andgasoline 2 are belong to onegroup. There are mainly 3 peaksat 19.5 ms, 20.4 ms and 21.2 ms,respectively. But gasoline 1 has apeak at 28.2 ms. Compared togasoline 3, 4, and 5, they havesmall volatility and can only reach35 µg/L and 11 µg/L in the gasphase. Gasoline 3, 4 and 5 can getto 168 µg/L, 600 µg/L and 478µg/L respectively.Therefore, the gasolines 3, 4,and 5 should be classified as onegroup, because they are obviouslydifferent from gasoline 1 andgasoline 2. There is no peak at 20.4ms, which is the highest peak forgasoline 1 and 2. All analytes showpeaks at 19.5 ms and 22.3 ms. Forgasoline 5, there is a peak at16.1ms and the signal is much morehigher than in the case of gasoline 3and 4. The peaks positions forgaoline 3 and 4 are nearly the same,it is difficult to differentiate themusing the drift time alone. But, theratio of the peaks are different also.For gasoline 4, the peak at 22.3msis relatively small compared to thepeak at 19.5ms.Exponential dilution was alsodone with the samples, but thelinear range for the calibrationcurve is very small. The range isfrom 0 µg/L to about 16 µg/L forgasoline 4, shown in Fig. 3Figure 2: <strong>IMS</strong> Spectrum of Gasoline 3, 4, 5through permeation membrane6voltage of 4 kV was applied., The generaltemperature on <strong>IMS</strong> was 22°C.Results and Discussion<strong>UV</strong>-<strong>IMS</strong>Five different gasoline samples weremeasured using the 10.6 eV <strong>UV</strong>-<strong>IMS</strong> directlyPeak area543211,21,00,80,60,40,20,00 2 4 6 8 10 12 14 160Figure 3: Calibration curve of gasoline 40 100 200 300 400 500 600Concentration / µg/LCopyright © 2003 by International Society for Ion Mobility Spectrometry
66 - Gasoline Analysis by <strong>GC</strong>-<strong>UV</strong>-<strong>IMS</strong> - IJ<strong>IMS</strong> 6(2003)2,63-66Figure 7: Spectrum of gasoline 4 using <strong>IMS</strong> worked as PID coupled to <strong>GC</strong>ConclusionsUsing the headspace gas phasecomponents, gasolines can be classified using10.6 eV <strong>UV</strong>-<strong>IMS</strong> by the position of the peakson the drift time scale and additionally theratio of the peaks. With total analysis timesat 16 minutes at ambient temperature themethod is rather fast to differentiategasolines. Using <strong>GC</strong>-<strong>UV</strong>-<strong>IMS</strong> can help tounderstand the complex spectra of <strong>IMS</strong>.Therefore <strong>GC</strong>-MS should be applied toidentify the components of different gasolinesamples in gas phase directly.References[1] Durand JP, Gautier S, Robert E, et al., HRC-JHigh Res Chrom , 1997 , 20 (5): 289-294 .[2] Veriotti T., Sacks R., Anal. Chem., 2000, 72,3036-3069.[3] Steers D, Gerrard C, Hirst B, et al. , Jopta-Pure Appl OP, 1999, 1 (6): 680-684.Copyright © 2003 by International Society for Ion Mobility Spectrometry