Impact of Dust on Printed Circuit Assembly Reliability - IPC Outlook
Impact of Dust on Printed Circuit Assembly Reliability - IPC Outlook
Impact of Dust on Printed Circuit Assembly Reliability - IPC Outlook

Create successful ePaper yourself
Turn your PDF publications into a flip-book with our unique Google optimized e-Paper software.
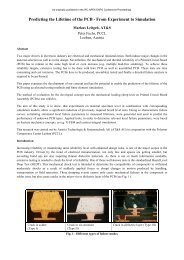
As originally published in the <strong>IPC</strong> APEX EXPO Proceedings.Copper Electrode<str<strong>on</strong>g>Dust</str<strong>on</strong>g> ParticlesCopper ElectrodeFigure 2: Optical image <str<strong>on</strong>g>of</str<strong>on</strong>g> dust particles between electrodesWe used AC impedance spectroscopy (IS) to characterize the impact <str<strong>on</strong>g>of</str<strong>on</strong>g> dust <strong>on</strong> PCBs. The AC impedance technique usessmall AC voltage to investigate the electrical resp<strong>on</strong>se <str<strong>on</strong>g>of</str<strong>on</strong>g> a system by scanning across a wide frequency range. Itmeasures the relevant interfacial and bulk properties <str<strong>on</strong>g>of</str<strong>on</strong>g> the system. A number <str<strong>on</strong>g>of</str<strong>on</strong>g> reas<strong>on</strong>s led us to employ the IS as themeasurement technique instead <str<strong>on</strong>g>of</str<strong>on</strong>g> the comm<strong>on</strong>ly used surface insulati<strong>on</strong> resistance (SIR) measurement by DC voltage.Firstly, IS can distinguish between the i<strong>on</strong>ic soluti<strong>on</strong> impedance <str<strong>on</strong>g>of</str<strong>on</strong>g> electrolyte between electrodes and the impedancefrom interfacial electrochemical reacti<strong>on</strong>s. Thus we can understand which the dominant impedance is in the overallsystem. Sec<strong>on</strong>dly, it does not lose the SIR informati<strong>on</strong> measured by DC voltage since he DC measurement value is justthe end point <str<strong>on</strong>g>of</str<strong>on</strong>g> the spectrum (frequency = 0). We can provide an estimate <str<strong>on</strong>g>of</str<strong>on</strong>g> SIR through a c<strong>on</strong>structi<strong>on</strong> <str<strong>on</strong>g>of</str<strong>on</strong>g> an equivalentcircuit <str<strong>on</strong>g>of</str<strong>on</strong>g> the test system and an extrapolati<strong>on</strong> to the SIR data. Thirdly, IS applies a small amount <str<strong>on</strong>g>of</str<strong>on</strong>g> voltage, which hasminimal impact <strong>on</strong> the operating envir<strong>on</strong>ment. DC bias is known to promote dendrite growth as a critical accelerati<strong>on</strong>factor, whereas AC does not promote dendrite formati<strong>on</strong> since there is insufficient time <strong>on</strong> each cycle to form dendrites[11]. The anodes and cathodes were changed c<strong>on</strong>tinuously during the AC voltage measurement.We performed IS measurements <strong>on</strong> test coup<strong>on</strong>s deposited with indoor or outdoor dust. Impedance spectra weremeasured at 40ºC and different relative humidities, 40%, 60%, 80% and 90%. During the ramp up <str<strong>on</strong>g>of</str<strong>on</strong>g> RH test, the testcoup<strong>on</strong> was exposed under each combinati<strong>on</strong> <str<strong>on</strong>g>of</str<strong>on</strong>g> temperature and humidity for 30 minutes before taking an impedancemeasurement. The test pr<str<strong>on</strong>g>of</str<strong>on</strong>g>ile is plotted in Figure 3. The ramp rate between the plateaus (soaking periods) is less than 2ºC/ minute. AC impedance spectroscopy was measured by scanning a frequency range from 20 Hz to 2 MHz. An ACbias at the level <str<strong>on</strong>g>of</str<strong>on</strong>g> 25 mV was applied for about 2 minutes to take the measurement. There was no bias applied betweenmeasurements. Data were represented by Bode and Nyquist plots. The Bode plot illustrates the relati<strong>on</strong>ship betweenabsolute impedance (|Z|) and measurement frequency (f), while the Nyquist plot dem<strong>on</strong>strates the relati<strong>on</strong>ship betweenreal comp<strong>on</strong>ent <str<strong>on</strong>g>of</str<strong>on</strong>g> impedance (Z’) and imaginary comp<strong>on</strong>ent <str<strong>on</strong>g>of</str<strong>on</strong>g> impedance (Z”).10080RH (%)604020Test point00 40 80 120 160 200 240Time (minutes)Figure 3: Test pr<str<strong>on</strong>g>of</str<strong>on</strong>g>ile <str<strong>on</strong>g>of</str<strong>on</strong>g> relative humidityCharacterizati<strong>on</strong> <str<strong>on</strong>g>of</str<strong>on</strong>g> <str<strong>on</strong>g>Dust</str<strong>on</strong>g> Soluti<strong>on</strong>sWe characterized dust sample by measuring the pH and c<strong>on</strong>ductivity <str<strong>on</strong>g>of</str<strong>on</strong>g> aqueous soluti<strong>on</strong>s produced from them. Wedissolved 250 mg <str<strong>on</strong>g>of</str<strong>on</strong>g> dust particles in 10 mL <str<strong>on</strong>g>of</str<strong>on</strong>g> dei<strong>on</strong>ized water (DI water), and measured the aqueous soluti<strong>on</strong> with apH/c<strong>on</strong>ductivity meter. The measurement results at ambient temperature are summarized in Table 4. Group <strong>on</strong>e is the
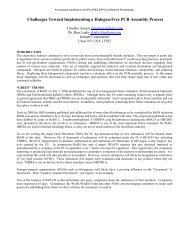
As originally published in the <strong>IPC</strong> APEX EXPO Proceedings.c<strong>on</strong>trol group with DI water <strong>on</strong>ly, which has a pH <str<strong>on</strong>g>of</str<strong>on</strong>g> 5.75. DI water theoretically should have a pH <str<strong>on</strong>g>of</str<strong>on</strong>g> 7 with equilibrium<str<strong>on</strong>g>of</str<strong>on</strong>g> hydrogen (H + ) i<strong>on</strong>s and hydroxide (OH - ) i<strong>on</strong>s. However, as it sits in open air, carb<strong>on</strong> dioxide (CO 2 ) begins dissolvinginto the water, forming carb<strong>on</strong>ic acid. A small amount <str<strong>on</strong>g>of</str<strong>on</strong>g> absorpti<strong>on</strong> <str<strong>on</strong>g>of</str<strong>on</strong>g> CO 2 would drop the pH from 7 to between 5 and6. During the pH measurement <str<strong>on</strong>g>of</str<strong>on</strong>g> the DI water, we observed the decrease <str<strong>on</strong>g>of</str<strong>on</strong>g> pH as it came in c<strong>on</strong>tact with air. The pHwas stabilized at 5.75. Therefore, pH electrodes do not provide accurate pH for DI water. The c<strong>on</strong>ductivity <str<strong>on</strong>g>of</str<strong>on</strong>g> the c<strong>on</strong>trolgroup is 0. That means that the tested DI water is cleaned properly, which has very little c<strong>on</strong>ductivity in it.Table 1: Summary table <str<strong>on</strong>g>of</str<strong>on</strong>g> pH and c<strong>on</strong>ductivity measurementsGroup Sample pH C<strong>on</strong>ductivity (μS/cm)1 No dust (c<strong>on</strong>trol) 5.75 02 Indoor dust 5.13 25263 Outdoor dust 5.53 1640The c<strong>on</strong>ductivity (κ) can be defined by the following equati<strong>on</strong>:AG = 1 = κR lC<strong>on</strong>ductance (G) is defined as the reciprocal <str<strong>on</strong>g>of</str<strong>on</strong>g> the resistance (R). C<strong>on</strong>ductance <str<strong>on</strong>g>of</str<strong>on</strong>g> a given aqueous soluti<strong>on</strong> decreaseswhen the distance (l) between the electrodes increases and increases when the effective area (A) <str<strong>on</strong>g>of</str<strong>on</strong>g> the electrodesincreases.The c<strong>on</strong>ductivity <str<strong>on</strong>g>of</str<strong>on</strong>g> the aqueous soluti<strong>on</strong> produced from indoor dust and outdoor dust was 2526 μS/cm and 1640 μS/cm,respectively. During the c<strong>on</strong>ductivity measurement <str<strong>on</strong>g>of</str<strong>on</strong>g> the soluti<strong>on</strong>s, the distance and effective area between theelectrodes were the c<strong>on</strong>stants since we used the same meter. As a result, the c<strong>on</strong>ductivity <str<strong>on</strong>g>of</str<strong>on</strong>g> the aqueous soluti<strong>on</strong> is thereciprocal <str<strong>on</strong>g>of</str<strong>on</strong>g> the resistant value. The resistance value corresp<strong>on</strong>ds to the real comp<strong>on</strong>ent in the impedance measurement.The higher c<strong>on</strong>ductivity <str<strong>on</strong>g>of</str<strong>on</strong>g> the indoor dust soluti<strong>on</strong> can lead to a lower real comp<strong>on</strong>ent <str<strong>on</strong>g>of</str<strong>on</strong>g> the impedance at relatively highRH levels. It was verified by the Nyquist plots shown in the next secti<strong>on</strong>.The aqueous soluti<strong>on</strong> produced from indoor dust had a lower pH compared to the <strong>on</strong>e from outdoor dust. Both <str<strong>on</strong>g>of</str<strong>on</strong>g> themshowed a slightly acidic property. The different pHs <str<strong>on</strong>g>of</str<strong>on</strong>g> the aqueous soluti<strong>on</strong>s produced from the indoor and outdoor dustsamples can be explained by the i<strong>on</strong>izati<strong>on</strong> and hydrolysis <str<strong>on</strong>g>of</str<strong>on</strong>g> the dominant substances in the dust samples. We list thei<strong>on</strong>izati<strong>on</strong> <str<strong>on</strong>g>of</str<strong>on</strong>g> NH 4 HSO 4, (NH 4 ) 2 SO 4 and NaCl in the reacti<strong>on</strong> (1), (2), and (4), which are the dominant water soluble saltsin the indoor or outdoor dust [13]. The amm<strong>on</strong>ium i<strong>on</strong> (NH 4 + ) can further hydrolyze to form H 3 O + , which has acidicproperty. If the reacti<strong>on</strong>s (1) to (3) take place in an aqueous soluti<strong>on</strong> produced from dust, the pH is reduced.NH 4 HSO 4 → NH 4 + + H + + SO 42-(NH 4 ) 2 SO 4 → 2NH 4 + + SO 42-(1)(2)NH 4 + + H 2 O ↔ NH 3 ↑ + H 3 O + (3)NaCl → Na + + Cl - (4)Indoor and outdoor dust samples were analyzed for their compositi<strong>on</strong> using SEM/EDS. Similar to the process <str<strong>on</strong>g>of</str<strong>on</strong>g> the dustdepositi<strong>on</strong> <strong>on</strong> the test coup<strong>on</strong>, the dust samples were deposited <strong>on</strong>to a 3” x 3” FR4 board before the compositi<strong>on</strong>alanalysis as shown in Figure 4 Error! Reference source not found.. The major elements detected in both dust samplesare: C, O, Na, Mg, Al, Si, S, Cl, K, Ca, etc. The results indicated that the analyzed dust samples c<strong>on</strong>sisted <str<strong>on</strong>g>of</str<strong>on</strong>g> naturallyabundant inorganic minerals and water soluble salts. Similar analysis findings were published in [11] and Error!Reference source not found.. The dominant minerals indentified in dust samples include quartz (SiO 2 ), feldspar(KAlSi 3 O 8 -NaAlSi 3 O 8 -CaAl 2 Si 2 O 8 ), calcite (CaCO 3 ), gypsum (CaSO 4·2H 2 O) and mica (SiO 2·Al 2 O 3·K 2 O·Na 2 O·H 2 O),most <str<strong>on</strong>g>of</str<strong>on</strong>g> which are the abundant minerals in the crust <str<strong>on</strong>g>of</str<strong>on</strong>g> the earth. They are generated by wind-blowing <str<strong>on</strong>g>of</str<strong>on</strong>g> soil dust [14].Elements <str<strong>on</strong>g>of</str<strong>on</strong>g> chlorine and sulfur were also detected, which may exist in the forms <str<strong>on</strong>g>of</str<strong>on</strong>g> chloride (Cl - ) and sulfate (SO 4 2- ) asthe c<strong>on</strong>stituents <str<strong>on</strong>g>of</str<strong>on</strong>g> water soluble salts, and co-existed with the mineral particles. It is likely that they are formed from thesea salts in breaking ocean waves or sprinkled salts <strong>on</strong> the road.
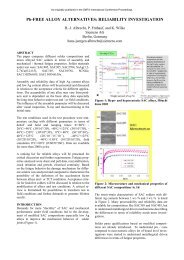
As originally published in the <strong>IPC</strong> APEX EXPO Proceedings.Figure 4: SEM image <str<strong>on</strong>g>of</str<strong>on</strong>g> the outdoor dust sample deposited <strong>on</strong> a FR-4 laminate boardDue to the limited sensitivity <str<strong>on</strong>g>of</str<strong>on</strong>g> EDS for low atomic order elements, elements such as nitrogen and hydrogen can notdetected, even if they are present in the dust sample. For the indoor dust sample, the real comp<strong>on</strong>ent in the Nyquist plotshowed a big drop when the RH reached 60% as shown in the next secti<strong>on</strong>. It indicated that the dust sample c<strong>on</strong>sisted <str<strong>on</strong>g>of</str<strong>on</strong>g>the substance with the CRH lower than 60%. Sulfate (SO 4 2- ) and amm<strong>on</strong>ium (NH 4 + ) are the main i<strong>on</strong>ic comp<strong>on</strong>ents inthe fine mode dust particles, which are formed by the c<strong>on</strong>densati<strong>on</strong> <str<strong>on</strong>g>of</str<strong>on</strong>g> low volatility gases [17]. It is speculated that both(NH 4 ) 2 SO 4 and NH 4 HSO 4 existed in the analyzed indoor dust samples due to presence <str<strong>on</strong>g>of</str<strong>on</strong>g> elements S and O, which havethe CRH <str<strong>on</strong>g>of</str<strong>on</strong>g> 79% and 40% at the room temperature, respectively.Compositi<strong>on</strong>al analysis was c<strong>on</strong>ducted <strong>on</strong> dust particles deposited <strong>on</strong> the test board to analyze the difference betweenindoor and outdoor dusts. Firstly, elements such as Na, K, Cl and S were more prevalent in the indoor dust samplecompared to outdoor dust in terms <str<strong>on</strong>g>of</str<strong>on</strong>g> distributi<strong>on</strong> since they were detected <strong>on</strong> the most indoor dust particles. As themajor compositi<strong>on</strong>s <str<strong>on</strong>g>of</str<strong>on</strong>g> water soluble salts, they co-existed with other mineral particles. It is a multi-layer structureformed between salts and mineral particles [14] . Sec<strong>on</strong>dly, these elements also occupied higher weight percentage in theindoor dust sample compared to the outdoor <strong>on</strong>e. Outdoor dust had higher weight percentages <str<strong>on</strong>g>of</str<strong>on</strong>g> Al, Si, and Ca, as aresult <str<strong>on</strong>g>of</str<strong>on</strong>g> wind blowing <str<strong>on</strong>g>of</str<strong>on</strong>g> inorganic mineral particles. Thirdly, they differed a lot in term <str<strong>on</strong>g>of</str<strong>on</strong>g> size distributi<strong>on</strong>. Wemeasured the dimensi<strong>on</strong>s <str<strong>on</strong>g>of</str<strong>on</strong>g> the dust particles <strong>on</strong> an area <str<strong>on</strong>g>of</str<strong>on</strong>g> 0.3 X 0.3 mm 2 for both samples. The outdoor dust samplehad a larger averaged particle size with a bigger variati<strong>on</strong> compared to indoor dust. It is because <str<strong>on</strong>g>of</str<strong>on</strong>g> the air c<strong>on</strong>diti<strong>on</strong>ingsystem for the indoor dust sample, which can filter out the particulates greater than a certain size.Error! Reference source not found.Figure 5 and Figure 6 showed higher magnificati<strong>on</strong> images <str<strong>on</strong>g>of</str<strong>on</strong>g> the indoor andoutdoor dust samples. Different morphology <str<strong>on</strong>g>of</str<strong>on</strong>g> dust particles reflected the dissimilar compositi<strong>on</strong>s. <str<strong>on</strong>g>Dust</str<strong>on</strong>g> particles withsharp boundaries are normally mineral dust particles as shown in Figure 5 Error! Reference source not found.<str<strong>on</strong>g>of</str<strong>on</strong>g> theoutdoor dust sample. Some dust particles are agglomerati<strong>on</strong>s <str<strong>on</strong>g>of</str<strong>on</strong>g> many particulates together as shown in Error!Reference source not found.the indoor dust sample. It seems to be small amount <str<strong>on</strong>g>of</str<strong>on</strong>g> chloride salt mixed quartz and othermineral particles (shown as point 1 <str<strong>on</strong>g>of</str<strong>on</strong>g> Figure 6). The showing <str<strong>on</strong>g>of</str<strong>on</strong>g> element S, Cl and Na indicated the presence <str<strong>on</strong>g>of</str<strong>on</strong>g> watersoluble salts, such as NaCl, KCl or NH 4 HSO 4 . They normally attached to the mineral particles to form a multi-layerstructure. There are normally more than tens <str<strong>on</strong>g>of</str<strong>on</strong>g> substances in the dust sample. More advanced techniques can beemployed in order to have further understanding.ElementCOAlSiKCaTotalsWeight%48.4722.683.6715.068.931.18100.00Atomic%63.2222.212.138.403.580.46100.00
As originally published in the <strong>IPC</strong> APEX EXPO Proceedings.Figure 5: SEM image <str<strong>on</strong>g>of</str<strong>on</strong>g> the outdoor dust sample with EDS compositi<strong>on</strong>al analysis resultsPoint 2Point 1Point 2ElementWeight %Atomic %Weight %Atomic%O55.6169.1960.8275.65Na--7.996.92Mg3.763.14--Point 1AlSi6.3724.524.817.74-2.12-1.51S--3.372.09Cl1.580.916.129.05K6.553.42.531.29Ca1.610.827.043.5Totals100100100100Figure 6: SEM image <str<strong>on</strong>g>of</str<strong>on</strong>g> the indoor dust sample with EDS compositi<strong>on</strong>al analysis resultsTest ResultsError! Reference source not found.Figure 7 shows the Bode plot <str<strong>on</strong>g>of</str<strong>on</strong>g> the c<strong>on</strong>trol group <str<strong>on</strong>g>of</str<strong>on</strong>g> the test coup<strong>on</strong>, which does nothave dust depositi<strong>on</strong>. Figure 8 and Figure 9 show the Bode plots <str<strong>on</strong>g>of</str<strong>on</strong>g> test coup<strong>on</strong>s deposited with outdoor and indoor dust,respectively. The data showed that the presence <str<strong>on</strong>g>of</str<strong>on</strong>g> dust had a significant impact <strong>on</strong> the reliability <str<strong>on</strong>g>of</str<strong>on</strong>g> PCBA. There wasnegligible change <str<strong>on</strong>g>of</str<strong>on</strong>g> the impedance spectra <str<strong>on</strong>g>of</str<strong>on</strong>g> c<strong>on</strong>trol samples at different relative humidifies, while there were orders <str<strong>on</strong>g>of</str<strong>on</strong>g>magnitude changes observed in the samples with both indoor and outdoor dust. <str<strong>on</strong>g>Dust</str<strong>on</strong>g> particles <strong>on</strong> the surface can increasethe total water sorpti<strong>on</strong> compared to a clean board, since water can both adsorb <strong>on</strong> the increased surface <str<strong>on</strong>g>of</str<strong>on</strong>g> the dustdeposit and further absorb into the dust. The formati<strong>on</strong> <str<strong>on</strong>g>of</str<strong>on</strong>g> water film and the increase <str<strong>on</strong>g>of</str<strong>on</strong>g> moisture uptake <strong>on</strong> the substratecan enhance the c<strong>on</strong>ductivity between two separated c<strong>on</strong>ductors. In additi<strong>on</strong>, water soluble salts in the dust sample candissolve in the water film and form the i<strong>on</strong>s, which can further increase c<strong>on</strong>ductivity.Comparis<strong>on</strong> tests were performed <strong>on</strong> indoor and outdoor samples under the same test c<strong>on</strong>diti<strong>on</strong>s and dust depositi<strong>on</strong>density. Figure 8 and Figure 9 show the results. Bode plots showed that indoor dust was more sensitive to the change <str<strong>on</strong>g>of</str<strong>on</strong>g>relative humidity compared to outdoor dust. For the test coup<strong>on</strong>s with outdoor dust, the impedance spectra <str<strong>on</strong>g>of</str<strong>on</strong>g> the testc<strong>on</strong>diti<strong>on</strong> <str<strong>on</strong>g>of</str<strong>on</strong>g> 80% RH started showing a significant separati<strong>on</strong> in low frequency from the spectra obtained at the lower RHlevels. A similar separati<strong>on</strong> occurred at a lower RH <str<strong>on</strong>g>of</str<strong>on</strong>g> 60% for the coup<strong>on</strong>s with indoor dust. Therefore, under the similardust depositi<strong>on</strong> density, the indoor dust test coup<strong>on</strong>s are more susceptible to induce moisture related failures to electr<strong>on</strong>icproducts, such as loss <str<strong>on</strong>g>of</str<strong>on</strong>g> surface insulati<strong>on</strong> resistance between electrodes, electrochemical migrati<strong>on</strong>, and corrosi<strong>on</strong>.We believe the difference is partially caused by the different compositi<strong>on</strong>s and weight percentages <str<strong>on</strong>g>of</str<strong>on</strong>g> each c<strong>on</strong>stituent inthe indoor and outdoor dust samples. As shown in the compositi<strong>on</strong>al analysis, indoor dust c<strong>on</strong>tains more water solublesalts, while outdoor dust c<strong>on</strong>tains more mineral particles in terms <str<strong>on</strong>g>of</str<strong>on</strong>g> weight percentage. Water soluble salts are the criticalc<strong>on</strong>stituent in dust sample due to their deliquescence. One <str<strong>on</strong>g>of</str<strong>on</strong>g> the dictating properties is the critical relative humidity(CRH), the temperature and humidity level at which a material will begin to absorb water vapor from the air [15]. At orabove CRH, water soluble salts can absorb relatively large amounts <str<strong>on</strong>g>of</str<strong>on</strong>g> water from the atmosphere if exposed to it,forming a liquid soluti<strong>on</strong>. For example, the CRH <str<strong>on</strong>g>of</str<strong>on</strong>g> NH 4 HSO 4 is 40% at 25 ºC, and it is 75% at 20 ºC for NaCl. Due tothe higher weight percentage <str<strong>on</strong>g>of</str<strong>on</strong>g> element Na, K, Cl and S, we believe there existed more water soluble salts in the indoordust sample including NH 4 HSO 4 , NaCl and KCl. As a result, the test coup<strong>on</strong> with indoor dust started absorbing largeamounts <str<strong>on</strong>g>of</str<strong>on</strong>g> water from the air at a lower RH.The difference between indoor and outdoor dust can also be attributed to the different size distributi<strong>on</strong> <str<strong>on</strong>g>of</str<strong>on</strong>g> dust particles.Indoor dust c<strong>on</strong>tains more fine-mode dust particles due to the usage <str<strong>on</strong>g>of</str<strong>on</strong>g> particulate filtrati<strong>on</strong> systems inside a building. Itwas observed in the particle size measurement shown in the previous secti<strong>on</strong>. Fine-mode particles have more surfaceareas, which make them act as c<strong>on</strong>densati<strong>on</strong> sites for moisture adsorpti<strong>on</strong> due to capillary wetting, the ability <str<strong>on</strong>g>of</str<strong>on</strong>g> a liquidto penetrate porous solids, such as a mass <str<strong>on</strong>g>of</str<strong>on</strong>g> fine dust particles. The fine mode dust particles may act as porous solids.Therefore, the fine mode particles are believed to absorb more moisture compared to coarse mode particles given thesame compositi<strong>on</strong> and depositi<strong>on</strong> density (μg/cm 3 ).
As originally published in the <strong>IPC</strong> APEX EXPO Proceedings.Figure 7: Bode plot <str<strong>on</strong>g>of</str<strong>on</strong>g> c<strong>on</strong>trol samples (no dust) at different relative humiditiesFigure 8: Bode plot <str<strong>on</strong>g>of</str<strong>on</strong>g> outdoor dust samples at different relative humiditiesFigure 9: Bode plot <str<strong>on</strong>g>of</str<strong>on</strong>g> indoor dust samples at different relative humiditiesNyquist plots <str<strong>on</strong>g>of</str<strong>on</strong>g> the outdoor dust samples are presented in Figure 10 and Figure 11, which are the results under thec<strong>on</strong>diti<strong>on</strong>s <str<strong>on</strong>g>of</str<strong>on</strong>g> 80% and 90% RH, respectively. In the Nyquist plot, impedance is decomposed into its real and imaginarycomp<strong>on</strong>ents. Figure 10 and Figure 11 show a semicircle and a tail from a frequency sweep <str<strong>on</strong>g>of</str<strong>on</strong>g> 20 Hz to 2 MHz. In Figure11, the curve does not reach origin due to the frequency limitati<strong>on</strong> <str<strong>on</strong>g>of</str<strong>on</strong>g> the test equipment. The apparent characteristicfrequency is defined by the frequency at the highest imaginary point <str<strong>on</strong>g>of</str<strong>on</strong>g> each semicircle [16]. We compared the realcomp<strong>on</strong>ent (resistance) at the apparent characteristic frequency in the Nyquist plot. It showed <strong>on</strong>e magnitude drop whenrelative humidity increased from 80% to 90%. We believe that the first semicircle reflects the properties <str<strong>on</strong>g>of</str<strong>on</strong>g> the dust
As originally published in the <strong>IPC</strong> APEX EXPO Proceedings.particles after absorbing water from the air between two electrodes. And the tail corresp<strong>on</strong>ds to the electrical properties<str<strong>on</strong>g>of</str<strong>on</strong>g> the interface between electrodes and the water film. In the c<strong>on</strong>trol group, resistance comp<strong>on</strong>ent could not bedetermined from Nyquist plots within the range <str<strong>on</strong>g>of</str<strong>on</strong>g> measured frequency.Figure 10: Nyquist plot <str<strong>on</strong>g>of</str<strong>on</strong>g> outdoor dust samples at 80% RHFigure 11: Nyquist plot <str<strong>on</strong>g>of</str<strong>on</strong>g> outdoor dust samples at 90% RHTable 2 and Table 3 summarize the characteristics <str<strong>on</strong>g>of</str<strong>on</strong>g> the impedance spectra. The data further c<strong>on</strong>firmed the impedancedrop due to dust at different RHs. For the indoor dust shown in Table 2, as the RH increased from 60% to 80%, theapparent characteristic frequency increased two orders <str<strong>on</strong>g>of</str<strong>on</strong>g> magnitude. The real comp<strong>on</strong>ent (Z’) decreased two orders <str<strong>on</strong>g>of</str<strong>on</strong>g>magnitude, which means that the c<strong>on</strong>ductivity between two electrodes increased significantly. It can be explained by theincrease <str<strong>on</strong>g>of</str<strong>on</strong>g> water film thickness <strong>on</strong> the substrate between two electrodes with the increase <str<strong>on</strong>g>of</str<strong>on</strong>g> RH. At the same testc<strong>on</strong>diti<strong>on</strong>s, no significant change was observed <strong>on</strong> the c<strong>on</strong>trol group as the RH increased from 40% to 90%.Characteristics <str<strong>on</strong>g>of</str<strong>on</strong>g> the impedance spectra <str<strong>on</strong>g>of</str<strong>on</strong>g> outdoor dust samples are summarized in Table 3. As the RH increased from80% to 90%, the apparent characteristic frequency increased <strong>on</strong>e order <str<strong>on</strong>g>of</str<strong>on</strong>g> magnitude, while the real comp<strong>on</strong>ent decreased<strong>on</strong>e order <str<strong>on</strong>g>of</str<strong>on</strong>g> magnitude. Under low RH levels the imagery comp<strong>on</strong>ent <str<strong>on</strong>g>of</str<strong>on</strong>g> the impedance (Z”) governed the overallimpedance within the range <str<strong>on</strong>g>of</str<strong>on</strong>g> measured frequency. Therefore, the apparent characteristic frequency could not bedetermined from Nyquist plots at the RH at 40% and 60% for the indoor and outdoor dust, respectively.Table 2: Characteristics <str<strong>on</strong>g>of</str<strong>on</strong>g> the impedance spectra <str<strong>on</strong>g>of</str<strong>on</strong>g> indoor dust samplesT (ºC) RH (%) Characteristic Frequency (Hz) Z’ Z”40 40 N/A N/A N/A40 60 2. 8E+03 7. 3E+05 6. 7E+0540 80 2. 8E+05 6. 7E+03 5. 9E+0340 90 N/A N/A N/ATable 3: Characteristics <str<strong>on</strong>g>of</str<strong>on</strong>g> the impedance spectra <str<strong>on</strong>g>of</str<strong>on</strong>g> outdoor dust samplesT (ºC) RH (%) Characteristic Frequency (Hz) Z’ Z”40 40 N/A N/A N/A40 60 N/A N/A N/A40 80 4. 2E+04 3. 0E+04 2. 6E+0440 90 8. 0E+05 1. 7E+03 1. 5E+03
As originally published in the <strong>IPC</strong> APEX EXPO Proceedings.C<strong>on</strong>clusi<strong>on</strong>sWe designed a group <str<strong>on</strong>g>of</str<strong>on</strong>g> experiments to gain some fundamental understanding <str<strong>on</strong>g>of</str<strong>on</strong>g> the physics <str<strong>on</strong>g>of</str<strong>on</strong>g> failure <str<strong>on</strong>g>of</str<strong>on</strong>g> dustc<strong>on</strong>taminati<strong>on</strong>. We used the dust collected from the field instead <str<strong>on</strong>g>of</str<strong>on</strong>g> a mixture <str<strong>on</strong>g>of</str<strong>on</strong>g> chemical compounds to simulate the realdust. The test results were more realistic representati<strong>on</strong> <str<strong>on</strong>g>of</str<strong>on</strong>g> the dust impact <strong>on</strong> the printed circuit assembly. AC impedancespectroscopy (IS) was employed as the measurement technique for the dust research, as it can provide interfacial and bulkproperties <str<strong>on</strong>g>of</str<strong>on</strong>g> the overall electrochemical system without losing the SIR informati<strong>on</strong> measured by DC voltage. To ourknowledge we are the first <strong>on</strong>es to use IS to analyze the effects <str<strong>on</strong>g>of</str<strong>on</strong>g> dust. The key findings <str<strong>on</strong>g>of</str<strong>on</strong>g> this paper are listed below.• The data showed that the presence <str<strong>on</strong>g>of</str<strong>on</strong>g> dust had a significant impact <strong>on</strong> the reliability <str<strong>on</strong>g>of</str<strong>on</strong>g> PCBA. There was negligiblechange <str<strong>on</strong>g>of</str<strong>on</strong>g> the impedance spectra <str<strong>on</strong>g>of</str<strong>on</strong>g> c<strong>on</strong>trol samples at different relative humidifies, while there were orders <str<strong>on</strong>g>of</str<strong>on</strong>g>magnitude changes observed in the samples in presence <str<strong>on</strong>g>of</str<strong>on</strong>g> indoor or outdoor dust.• Comparis<strong>on</strong> tests were performed <strong>on</strong> indoor and outdoor samples under the same test c<strong>on</strong>diti<strong>on</strong>s and dust depositi<strong>on</strong>density. Bode plots showed that indoor dust was more sensitive to the change <str<strong>on</strong>g>of</str<strong>on</strong>g> relative humidity compared tooutdoor dust. We believed the difference is due to weight percentage and species <str<strong>on</strong>g>of</str<strong>on</strong>g> the dominant water soluble saltsand dust particle sizes in the dust sample.• At the same dust depositi<strong>on</strong> density, we observed that test coup<strong>on</strong>s with indoor dust are more susceptible to inducemoisture related failures. These failure mechanisms include loss <str<strong>on</strong>g>of</str<strong>on</strong>g> surface insulati<strong>on</strong> resistance between electrodes,electrochemical migrati<strong>on</strong>, corrosi<strong>on</strong>, etc. In the real life usage c<strong>on</strong>diti<strong>on</strong>s, indoor dust <str<strong>on</strong>g>of</str<strong>on</strong>g>ten has much lowerdepositi<strong>on</strong> density compared to outdoor dust <strong>on</strong> the printed circuit assemblies due to the usage <str<strong>on</strong>g>of</str<strong>on</strong>g> air-filtering systemin buildings. We should put real use-case scenarios into c<strong>on</strong>siderati<strong>on</strong> when evaluating the impact <str<strong>on</strong>g>of</str<strong>on</strong>g> dust.Reference[1] M. Tencer, and J. S. Moss, “Humidity management <str<strong>on</strong>g>of</str<strong>on</strong>g> outdoor electr<strong>on</strong>ic equipment: methods, pitfalls, and recommendati<strong>on</strong>s”,IEEE Trans. Comp. Packag. Technol., vol 25, pp 66-71, Mar. 2002.[2] Michael Pecht and J<strong>on</strong> Fitch, The Fresh Air Cooling Soluti<strong>on</strong> for Energy Savings, to be submitted.[3] Xue-Yan Lin, Ji-Gao Zhang, “<str<strong>on</strong>g>Dust</str<strong>on</strong>g> Corrosi<strong>on</strong>”, 50th IEEE Holm C<strong>on</strong>ference <strong>on</strong> Electrical C<strong>on</strong>tacts, 2004[4] D. G. DeNure and E. S. Sproles, Jr. , “<str<strong>on</strong>g>Dust</str<strong>on</strong>g> test results <strong>on</strong> multic<strong>on</strong>tact circuit board c<strong>on</strong>nectors”, IEEE Transacti<strong>on</strong>s <strong>on</strong>Comp<strong>on</strong>ents, Hybrids, and Manufacturing Technology, Volume 14, No. 4, 1991[5] R. P. Frankenthal, D. J. Sic<strong>on</strong>olfi and J. D. Sinclair, “Accelerated Life Testing <str<strong>on</strong>g>of</str<strong>on</strong>g> Electr<strong>on</strong>ic Devices by Atmospheric Particles:Why and How”, J. Electrochemical Soc., Vol. 140, pp. 3129-3134, 1993.[6] F. S. Sandr<str<strong>on</strong>g>of</str<strong>on</strong>g>f, W. H. Burnett, “<strong>Reliability</strong> qualificati<strong>on</strong> test for circuit boards exposed to airborne hygroscopic dust”, Electr<strong>on</strong>icComp<strong>on</strong>ents and Technology C<strong>on</strong>ference Proceedings, pp384 – 389, 1992[7] GR-63-CORE: NEBSTM Requirements: Physical Protecti<strong>on</strong>, Telcordia Technologies Generic Requirements, Issue 3, March 2006.[8] R. Ambat, M.S. Jellesen, D. Minzari, U. Rathinavelu, M.A. K. Johnsen, P. Westermann, and P. Møller, “Solder flux residues andelectrochemical migrati<strong>on</strong> failures <str<strong>on</strong>g>of</str<strong>on</strong>g> electr<strong>on</strong>ic devices”, Proc. <str<strong>on</strong>g>of</str<strong>on</strong>g> Eurocorr 2009, Nice, France, 6-10 September 2009.[9] Rajan Ambat and Per Møller, A review <str<strong>on</strong>g>of</str<strong>on</strong>g> Corrosi<strong>on</strong> and envir<strong>on</strong>mental effects <strong>on</strong> electr<strong>on</strong>ics, Celcorr Publicati<strong>on</strong>s,www.celcorr.com/paper-DMS.pdf[10] M. Forslund, C. Leygraf, “Humidity Sorpti<strong>on</strong> Due to Deposited Aerosol Particles Studied In Situ outdoors <strong>on</strong> Gold Surfaces, J.Electrochem. Soc., Volume 144, Issue 1, pp. 105-113, 1997[11] Ling Chunxian Zou and Christopher Hunt, Characterizati<strong>on</strong> <str<strong>on</strong>g>of</str<strong>on</strong>g> the C<strong>on</strong>ducti<strong>on</strong> Mechanisms in Adsorbed Electrolyte Layers <strong>on</strong>Electr<strong>on</strong>ic Boards Using AC Impedance, J. Electrochem. Soc., Volume 156, Issue 1, pp. C8-C15, 2009.[12] Liang, Y. N. ; Zhang, J . G. ; Liu, J. J. ; Identificati<strong>on</strong> <str<strong>on</strong>g>of</str<strong>on</strong>g> inorganic compounds <str<strong>on</strong>g>of</str<strong>on</strong>g> dust and their effects <strong>on</strong> electrical c<strong>on</strong>tactfailure, Proceedings <str<strong>on</strong>g>of</str<strong>on</strong>g> the Forty-Third IEEE Holm C<strong>on</strong>ference <strong>on</strong> Electrical C<strong>on</strong>tacts, 1997, Philadelphia, PA, pp 315 – 327.[13] C. Leygraf, T. E. Graedel, “Atmospheric corrosi<strong>on</strong>”, John Wiley & S<strong>on</strong>s, Inc. , ISBN 0-471-37219-6, p 200.[14] Prabjit Singh, Joseph F. Prisco, Roger R. Schmidt Particulate and gaseous c<strong>on</strong>taminati<strong>on</strong>: effect <strong>on</strong> computer reliability andm<strong>on</strong>itoring, ASHRAE Transacti<strong>on</strong>s, Jan, 2009[15] <strong>IPC</strong>-HDBK, Guidelines for Design, Selecti<strong>on</strong> and Applicati<strong>on</strong> <str<strong>on</strong>g>of</str<strong>on</strong>g> C<strong>on</strong>formal Coatings.[16] Chunsheng Wang, John Appleby, Frank E. Little, Electrochemical impedance study <str<strong>on</strong>g>of</str<strong>on</strong>g> initial lithium i<strong>on</strong> intercalati<strong>on</strong> intographite powders, Electrochimica Acta, Vol 46, 2001, pp 1793–1813.[17] P-E Tegehall, “<str<strong>on</strong>g>Impact</str<strong>on</strong>g> <str<strong>on</strong>g>of</str<strong>on</strong>g> Humidity and C<strong>on</strong>taminati<strong>on</strong> <strong>on</strong> Surface Insulati<strong>on</strong> Resistance and Electrochemical Migrati<strong>on</strong>”, IVFIndustrial Research and Development Corporati<strong>on</strong>, http://www.europeanleadfree.net/
As originally published in the <strong>IPC</strong> APEX EXPO Proceedings.<str<strong>on</strong>g>Impact</str<strong>on</strong>g> <str<strong>on</strong>g>of</str<strong>on</strong>g> <str<strong>on</strong>g>Dust</str<strong>on</strong>g> <strong>on</strong> <strong>Printed</strong> <strong>Circuit</strong><strong>Assembly</strong> <strong>Reliability</strong>Bo S<strong>on</strong>g, Michael H. Azarian and Michael G. PechtCenter for Advanced Life Cycle Engineering (CALCE)University <str<strong>on</strong>g>of</str<strong>on</strong>g> Maryland, College Park, MD
As originally published in the <strong>IPC</strong> APEX EXPO Proceedings.• <str<strong>on</strong>g>Dust</str<strong>on</strong>g>Motivati<strong>on</strong>– Suspended solid particles in the atmosphere– Always present– Complex nature (e.g., compositi<strong>on</strong>s vary from locati<strong>on</strong> to locati<strong>on</strong>)• <str<strong>on</strong>g>Impact</str<strong>on</strong>g> <str<strong>on</strong>g>of</str<strong>on</strong>g> dust <strong>on</strong> reliability– Due to miniaturizati<strong>on</strong>– Unc<strong>on</strong>trolled envir<strong>on</strong>mental c<strong>on</strong>diti<strong>on</strong>s (e.g., free air cooling, outdoorapplicati<strong>on</strong>s)• Research is needed– The failure mechanisms <str<strong>on</strong>g>of</str<strong>on</strong>g> electr<strong>on</strong>ics in presence <str<strong>on</strong>g>of</str<strong>on</strong>g> dust are not wellunderstood.– Test methods are not well developed.– Some basic problems are not solved (e.g., classificati<strong>on</strong>s <str<strong>on</strong>g>of</str<strong>on</strong>g> dustparticles).
As originally published in the <strong>IPC</strong> APEX EXPO Proceedings.Key Questi<strong>on</strong>s• Since dust is always present in the atmosphere, under what c<strong>on</strong>diti<strong>on</strong>sis dust a reliability c<strong>on</strong>cern for electr<strong>on</strong>ics?• Are some dust types worse than others (e.g. dust that is morehydrophilic or “c<strong>on</strong>taminated”). Should there be classificati<strong>on</strong>s <str<strong>on</strong>g>of</str<strong>on</strong>g> dust?How would these classificati<strong>on</strong>s be made?• Some believe that there is a critical threshold below which the effect <str<strong>on</strong>g>of</str<strong>on</strong>g>dust is negligible, can we identify if this is correct?• What combinati<strong>on</strong>s <str<strong>on</strong>g>of</str<strong>on</strong>g> dust, voltage, RH, temperature, and perhapsother factors that will affect electr<strong>on</strong>ic materials and circuits?• Can <strong>on</strong>e develop an accelerated testing method to simulate the effects<str<strong>on</strong>g>of</str<strong>on</strong>g> dust? What would be the parameters in the accelerati<strong>on</strong> model? Canan accelerati<strong>on</strong> factor equati<strong>on</strong> be identified?
As originally published in the <strong>IPC</strong> APEX EXPO Proceedings.Literature ReviewFailure Mode Failure Mechanism Research Organizati<strong>on</strong>sComp<strong>on</strong>ent leads andcopper traces• Electrical leakage• Electrical short• Electrical openC<strong>on</strong>tacts and c<strong>on</strong>nectors• Intermittent failure• Noisy (signal line)• Overheating (powerline)• Heat sink• Overheating• PCB in high voltagedesign• Electricaloverstress• C<strong>on</strong>ductive water filminduced SIR degradati<strong>on</strong>• Electrochemical migrati<strong>on</strong>• Corrosi<strong>on</strong> (Atmospheric)C<strong>on</strong>tact resistance increase• Pore corrosi<strong>on</strong>• Fretting corrosi<strong>on</strong>• Physical coverage <str<strong>on</strong>g>of</str<strong>on</strong>g> thesurface• Spread <str<strong>on</strong>g>of</str<strong>on</strong>g> charge away fromcomp<strong>on</strong>ent pins and into thelayer <str<strong>on</strong>g>of</str<strong>on</strong>g> dust to cause arcing.• Bell Labs• Royal Institute <str<strong>on</strong>g>of</str<strong>on</strong>g> Technology, Sweden• Bellcore (Telcordia Technologies) CELCORR(Technical University <str<strong>on</strong>g>of</str<strong>on</strong>g> Denmark)• IBM• IVF (Industrial Research and DevelopmentCorporati<strong>on</strong>), Sweden• Tekes• Beijing University <str<strong>on</strong>g>of</str<strong>on</strong>g> Posts & Telecom (BUPT),China• Bell Labs• Tekes (Technology Development Center <str<strong>on</strong>g>of</str<strong>on</strong>g>Finland), Finland• IBM• Bellcore (Telcordia Technologies)
As originally published in the <strong>IPC</strong> APEX EXPO Proceedings.Test Preparati<strong>on</strong>• <str<strong>on</strong>g>Dust</str<strong>on</strong>g> samples were collected from both indoorand outdoor areas.– Outdoor dust: an outdoor multi-level garage in anurban area.– Indoor dust: a <str<strong>on</strong>g>of</str<strong>on</strong>g>fice building <str<strong>on</strong>g>of</str<strong>on</strong>g> a computers<str<strong>on</strong>g>of</str<strong>on</strong>g>tware company. Brushed <str<strong>on</strong>g>of</str<strong>on</strong>g>f the surfaces <str<strong>on</strong>g>of</str<strong>on</strong>g>smooth plastic plates located at a height <str<strong>on</strong>g>of</str<strong>on</strong>g> 2.5 m.• Test coup<strong>on</strong>s– Length <str<strong>on</strong>g>of</str<strong>on</strong>g> copper electrodes: 200 mm– Spacing: 0. 25 mm. (A thickness gauge was usedto set the spacing and c<strong>on</strong>trol parallelism <str<strong>on</strong>g>of</str<strong>on</strong>g> thetwo electrodes.)– Board: FR-4 board with a thickness <str<strong>on</strong>g>of</str<strong>on</strong>g> 1.57 mm• <str<strong>on</strong>g>Dust</str<strong>on</strong>g> depositi<strong>on</strong>– Small quantities <str<strong>on</strong>g>of</str<strong>on</strong>g> dust particles were suspendedin a 99. 9% isopropyl alcohol (IPA) soluti<strong>on</strong>, andthen distributed <strong>on</strong>to the test coup<strong>on</strong> using atransfer pipette.– The IPA volatilized quickly, thereby leaving thedust particles <strong>on</strong> the coup<strong>on</strong> surfaceTest coup<strong>on</strong> with 6 pairs <str<strong>on</strong>g>of</str<strong>on</strong>g> parallel electrodesCopper Electrode<str<strong>on</strong>g>Dust</str<strong>on</strong>g> ParticlesCopper ElectrodeOptical image <str<strong>on</strong>g>of</str<strong>on</strong>g> dust particles between electrodes
As originally published in the <strong>IPC</strong> APEX EXPO Proceedings.Impedance Spectroscopy• AC impedance spectroscopy (IS) to characterize the impact <str<strong>on</strong>g>of</str<strong>on</strong>g> dust.– The AC impedance technique uses small AC voltage to investigate the electrical resp<strong>on</strong>se<str<strong>on</strong>g>of</str<strong>on</strong>g> a system by scanning across a wide frequency range. It measures the relevantinterfacial and bulk properties <str<strong>on</strong>g>of</str<strong>on</strong>g> the system.• Reas<strong>on</strong>s <str<strong>on</strong>g>of</str<strong>on</strong>g> employing the IS as the measurement technique instead <str<strong>on</strong>g>of</str<strong>on</strong>g> surfaceinsulati<strong>on</strong> resistance (SIR) measurement by DC voltage.– Firstly, IS can distinguish between the i<strong>on</strong>ic soluti<strong>on</strong> impedance <str<strong>on</strong>g>of</str<strong>on</strong>g> electrolyte betweenelectrodes and the impedance from interfacial electrochemical reacti<strong>on</strong>s. Thus we canunderstand which the dominant impedance is in the overall system.– Sec<strong>on</strong>dly, it does not lose the SIR informati<strong>on</strong> measured by DC voltage since he DCmeasurement value is just the end point <str<strong>on</strong>g>of</str<strong>on</strong>g> the spectrum (frequency = 0). We can providean estimate <str<strong>on</strong>g>of</str<strong>on</strong>g> SIR through a c<strong>on</strong>structi<strong>on</strong> <str<strong>on</strong>g>of</str<strong>on</strong>g> an equivalent circuit <str<strong>on</strong>g>of</str<strong>on</strong>g> the test system and anextrapolati<strong>on</strong> to the SIR data.– Thirdly, IS applies a small amount <str<strong>on</strong>g>of</str<strong>on</strong>g> voltage, which has minimal impact <strong>on</strong> the operatingenvir<strong>on</strong>ment. DC bias is known to promote dendrite growth as a critical accelerati<strong>on</strong> factor,whereas AC does not promote dendrite formati<strong>on</strong> since there is insufficient time <strong>on</strong> eachcycle to form dendrites. The anodes and cathodes were changed c<strong>on</strong>tinuously during theAC voltage measurement.
As originally published in the <strong>IPC</strong> APEX EXPO Proceedings.Test C<strong>on</strong>diti<strong>on</strong>s• Impedance spectra were measuredat 40ºC and different relativehumidities, 40%, 60%, 80% and90%.• The ramp rate between the plateaus(soaking periods) is less than 2 ºC/minute.• There was no bias applied betweenmeasurements.• AC impedance spectroscopy wasmeasured by scanning a frequencyrange from 20 Hz to 2 MHz.RH (%)100806040200Test point0 40 80 120 160 200 240Time (minutes)Test pr<str<strong>on</strong>g>of</str<strong>on</strong>g>ile <str<strong>on</strong>g>of</str<strong>on</strong>g> relative humidity
As originally published in the <strong>IPC</strong> APEX EXPO Proceedings.Characterizati<strong>on</strong> <str<strong>on</strong>g>of</str<strong>on</strong>g> <str<strong>on</strong>g>Dust</str<strong>on</strong>g> Soluti<strong>on</strong>s• <str<strong>on</strong>g>Dust</str<strong>on</strong>g> soluti<strong>on</strong>s: dissolved 250 mg <str<strong>on</strong>g>of</str<strong>on</strong>g> dust particles in 10 mL <str<strong>on</strong>g>of</str<strong>on</strong>g> DI water.• Test results:– C<strong>on</strong>trol group with DI water <strong>on</strong>ly has a pH <str<strong>on</strong>g>of</str<strong>on</strong>g> 5.75. The c<strong>on</strong>ductivity <str<strong>on</strong>g>of</str<strong>on</strong>g> thec<strong>on</strong>trol group is 0.– Indoor dust has higher c<strong>on</strong>ductivity and lower pH compared to outdoor dust.• The higher c<strong>on</strong>ductivity <str<strong>on</strong>g>of</str<strong>on</strong>g> the indoor dust soluti<strong>on</strong> can lead to a lowerreal comp<strong>on</strong>ent <str<strong>on</strong>g>of</str<strong>on</strong>g> the impedance at relatively high RH levels.• The i<strong>on</strong>izati<strong>on</strong> and hydrolysis <str<strong>on</strong>g>of</str<strong>on</strong>g> the dominant substances in the dustsamples can result in the different pHs <str<strong>on</strong>g>of</str<strong>on</strong>g> the aqueous soluti<strong>on</strong>sproduced from the indoor and outdoor dust samplesSummary table <str<strong>on</strong>g>of</str<strong>on</strong>g> pH and c<strong>on</strong>ductivity measurementsGroup Sample pH C<strong>on</strong>ductivity (μS/cm)1 No dust (c<strong>on</strong>trol) 5.75 02 Indoor dust 5.13 25263 Outdoor dust 5.53 1640
As originally published in the <strong>IPC</strong> APEX EXPO Proceedings.Compositi<strong>on</strong>al Analysis - 1/2• The major elements detected in both dust samples are: C, O, Na, Mg, Al, Si, S, Cl,K and Ca.– Indicated that the analyzed dust samples c<strong>on</strong>sisted <str<strong>on</strong>g>of</str<strong>on</strong>g> naturally abundant inorganicminerals and water soluble salts.• There were some differences between the outdoor and indoor dust samples.– Na, K, Cl and S were more prevalent in the indoor dust sample compared to outdoordust in terms <str<strong>on</strong>g>of</str<strong>on</strong>g> distributi<strong>on</strong>. As the major compositi<strong>on</strong>s <str<strong>on</strong>g>of</str<strong>on</strong>g> water soluble salts, they coexistedwith other mineral particles.– Outdoor dust had higher weight percentages <str<strong>on</strong>g>of</str<strong>on</strong>g> Al, Si, and Ca as a result <str<strong>on</strong>g>of</str<strong>on</strong>g> wind blowing<str<strong>on</strong>g>of</str<strong>on</strong>g> inorganic mineral particles.– They differed in term <str<strong>on</strong>g>of</str<strong>on</strong>g> size distributi<strong>on</strong>. The outdoor dust sample had a larger averagedparticle size with a bigger variati<strong>on</strong> compared to indoor dust.• Due to the limited sensitivity <str<strong>on</strong>g>of</str<strong>on</strong>g> EDS for low atomic order elements, elements suchas nitrogen and hydrogen can not detected, even if they are present in the dustsample.– It is speculated that both (NH 4) 2SO 4and NH 4HSO 4existed in the analyzed indoor dustsamples due to the presence <str<strong>on</strong>g>of</str<strong>on</strong>g> element O and S, which have the CRH <str<strong>on</strong>g>of</str<strong>on</strong>g> 79% and 40%at the room temperature, respectively.
As originally published in the <strong>IPC</strong> APEX EXPO Proceedings.Compositi<strong>on</strong>al Analysis - 2/2• Different morphology <str<strong>on</strong>g>of</str<strong>on</strong>g> dust particlesreflected the dissimilar compositi<strong>on</strong>s.– <str<strong>on</strong>g>Dust</str<strong>on</strong>g> particles with sharp boundaries arenormally mineral dust particles asshown in the outdoor dust sample.– Some dust particle is an agglomerati<strong>on</strong><str<strong>on</strong>g>of</str<strong>on</strong>g> many particulates together in indoordust sample. It seems to be smallamount <str<strong>on</strong>g>of</str<strong>on</strong>g> chloride salt mixed quartzand other mineral particles in point 1 inthe indoor dust.– The showing <str<strong>on</strong>g>of</str<strong>on</strong>g> element S, Cl and Na inthe point 2 indicated the presence <str<strong>on</strong>g>of</str<strong>on</strong>g>water soluble salts, such as NaCl, KClor NH 4 HSO 4 . They normally attached tothe mineral particles to form a multilayerstructure.ElementWeight%Atomic%C48.4763.22O22.6822.21Al3.672.13Si15.068.40K8.933.58Ca1.180.46Totals100.00100.00the outdoor dust sample with EDS compositi<strong>on</strong>al analysis resultsPoint 2Point 1Point 1Point 2ElementWeight %Atomic %Weight %Atomic%O55.6169.1960.8275.65Na--7.996.92Mg3.763.14--Al6.374.8--Si24.5217.742.121.51S--3.372.09Cl1.580.916.129.05K6.553.42.531.29Ca1.610.827.043.5Totals100100100100the indoor dust sample with EDS compositi<strong>on</strong>al analysis results
As originally published in the <strong>IPC</strong> APEX EXPO Proceedings.Test Results – Bode PlotsBode plot <str<strong>on</strong>g>of</str<strong>on</strong>g> outdoor dust samples atdifferent relative humiditiesBode plot <str<strong>on</strong>g>of</str<strong>on</strong>g> indoor dust samplesat different relative humiditiesBode plot <str<strong>on</strong>g>of</str<strong>on</strong>g> c<strong>on</strong>trol samples (nodust) at different relativehumidities
As originally published in the <strong>IPC</strong> APEX EXPO Proceedings.Test Results• The presence <str<strong>on</strong>g>of</str<strong>on</strong>g> dust had a significant impact <strong>on</strong> the reliability <str<strong>on</strong>g>of</str<strong>on</strong>g> PCBA.– There was negligible change <str<strong>on</strong>g>of</str<strong>on</strong>g> the impedance spectra <str<strong>on</strong>g>of</str<strong>on</strong>g> c<strong>on</strong>trol samplesat different relative humidifies, while there were orders <str<strong>on</strong>g>of</str<strong>on</strong>g> magnitudechanges observed in the samples with both indoor and outdoor dust.• <str<strong>on</strong>g>Dust</str<strong>on</strong>g> particles <strong>on</strong> the surface can increase the total water sorpti<strong>on</strong> compared to aclean board due to the increased surface area <str<strong>on</strong>g>of</str<strong>on</strong>g> the sample.• Water soluble salts in the dust sample can dissolve in the water film and form thei<strong>on</strong>s, which can increase c<strong>on</strong>ductivity.– Indoor dust was more sensitive to the change <str<strong>on</strong>g>of</str<strong>on</strong>g> RH compared to outdoordust.• For the test coup<strong>on</strong>s with outdoor dust, the impedance spectra <str<strong>on</strong>g>of</str<strong>on</strong>g> the testc<strong>on</strong>diti<strong>on</strong> <str<strong>on</strong>g>of</str<strong>on</strong>g> 80% RH started showing a significant separati<strong>on</strong> in low frequencyfrom the spectra obtained at the lower RH levels. A similar separati<strong>on</strong> occurredat a lower RH <str<strong>on</strong>g>of</str<strong>on</strong>g> 60% for the coup<strong>on</strong>s with indoor dust.• The difference is partially caused by the different compositi<strong>on</strong>s and weightpercentages <str<strong>on</strong>g>of</str<strong>on</strong>g> each c<strong>on</strong>stituent in the indoor and outdoor dust samples, alsoattributed to the different size distributi<strong>on</strong> <str<strong>on</strong>g>of</str<strong>on</strong>g> dust particles.
As originally published in the <strong>IPC</strong> APEX EXPO Proceedings.Test Results – Nyquist Plots• Nyquist plots show a semicircle and atail from a frequency sweep <str<strong>on</strong>g>of</str<strong>on</strong>g> 20 Hz to2 MHz.– We believe that the first semicirclereflects the properties <str<strong>on</strong>g>of</str<strong>on</strong>g> the dustparticles after absorbing water from theair between two electrodes. And the tailcorresp<strong>on</strong>ds to the electrical properties<str<strong>on</strong>g>of</str<strong>on</strong>g> the interface between electrodes andthe water film.• Comparing the real comp<strong>on</strong>ent (Z’) atthe apparent characteristic frequency inthe Nyquist plots, they showed <strong>on</strong>emagnitude drop when relative humidityincreased from 80% to 90%.Nyquist plot <str<strong>on</strong>g>of</str<strong>on</strong>g> outdoor dust samples at 80%RHNyquist plot <str<strong>on</strong>g>of</str<strong>on</strong>g> outdoor dust samples at 90% RH
As originally published in the <strong>IPC</strong> APEX EXPO Proceedings.C<strong>on</strong>clusi<strong>on</strong>sTo our knowledge we are the first <strong>on</strong>es to use IS to analyze the effects <str<strong>on</strong>g>of</str<strong>on</strong>g> dust. Thekey findings <str<strong>on</strong>g>of</str<strong>on</strong>g> this paper are listed below.– Aqueous soluti<strong>on</strong> produced by indoor dust has higher c<strong>on</strong>ductivity and lowpH compared the <strong>on</strong>e produced by outdoor dust. This result can becorrelated to impedance spectrum <str<strong>on</strong>g>of</str<strong>on</strong>g> both dust samples at the same RH.– The presence <str<strong>on</strong>g>of</str<strong>on</strong>g> dust had a significant impact <strong>on</strong> the reliability <str<strong>on</strong>g>of</str<strong>on</strong>g> PCBA.– Indoor dust was more sensitive to the change <str<strong>on</strong>g>of</str<strong>on</strong>g> relative humidity comparedto outdoor dust.– The difference between indoor and outdoor dust is due to weight percentageand species <str<strong>on</strong>g>of</str<strong>on</strong>g> the dominant water soluble salts and dust particle sizes in thedust sample. Indoor dust c<strong>on</strong>tains more water soluble salts.– At the same dust depositi<strong>on</strong> density, we observed that test coup<strong>on</strong>s withindoor dust are more susceptible to induce moisture related failures. In thereal life usage c<strong>on</strong>diti<strong>on</strong>s, indoor dust <str<strong>on</strong>g>of</str<strong>on</strong>g>ten has much lower depositi<strong>on</strong>density compared to outdoor dust <strong>on</strong> the printed circuit assemblies due tothe usage <str<strong>on</strong>g>of</str<strong>on</strong>g> air-filtering system in buildings. We should put real use-casescenarios into c<strong>on</strong>siderati<strong>on</strong> when evaluating the impact <str<strong>on</strong>g>of</str<strong>on</strong>g> dust.
As originally published in the <strong>IPC</strong> APEX EXPO Proceedings.Q&AThank you!