Nikon GRI Guidelines Comparison Table
Nikon GRI Guidelines Comparison Table
Nikon GRI Guidelines Comparison Table

You also want an ePaper? Increase the reach of your titles
YUMPU automatically turns print PDFs into web optimized ePapers that Google loves.
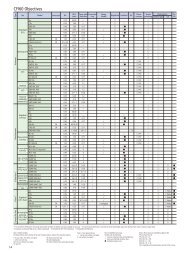
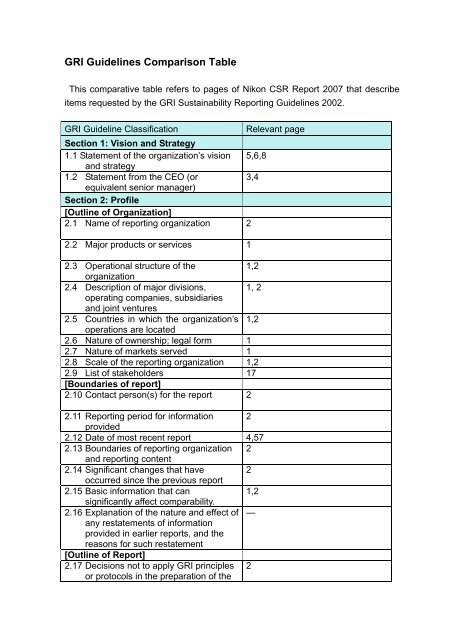
<strong>GRI</strong> <strong>Guidelines</strong> <strong>Comparison</strong> <strong>Table</strong>This comparative table refers to pages of <strong>Nikon</strong> CSR Report 2007 that describeitems requested by the <strong>GRI</strong> Sustainability Reporting <strong>Guidelines</strong> 2002.<strong>GRI</strong> Guideline ClassificationSection 1: Vision and Strategy1.1 Statement of the organization’s vision 5,6,8and strategy1.2 Statement from the CEO (or3,4equivalent senior manager)Section 2: Profile[Outline of Organization]2.1 Name of reporting organization 22.2 Major products or services 12.3 Operational structure of the1,2organization2.4 Description of major divisions, 1, 2operating companies, subsidiariesand joint ventures2.5 Countries in which the organization’s 1,2operations are located2.6 Nature of ownership; legal form 12.7 Nature of markets served 12.8 Scale of the reporting organization 1,22.9 List of stakeholders 17[Boundaries of report]2.10 Contact person(s) for the report 22.11 Reporting period for information 2provided2.12 Date of most recent report 4,572.13 Boundaries of reporting organization 2and reporting content2.14 Significant changes that have 2occurred since the previous report2.15 Basic information that can1,2significantly affect comparability.2.16 Explanation of the nature and effect of —any restatements of informationprovided in earlier reports, and thereasons for such restatement[Outline of Report]2.17 Decisions not to apply <strong>GRI</strong> principles 2or protocols in the preparation of theRelevant page
eport2.18 Criteria, definitions used in any 39accounting for economic,environmental and social costs andbenefits2.19 Significant changes from previous —years in the measurement methods2.20 Policies and internal practices to 2enhance and provide assuranceabout the accuracy and reliability thatcan be placed on the sustainabilityreport2.21 Policy and current practice with 58regard to providing independentassurance for the full report2.22 Means by which report users can 2obtain additional informationSection 3: Governance Structure andManagement Systems[Governance Structure and Management System]3.1 Governance structure of the11,12organization3.2 Percentage of directors that are —independent3.3 Process for determining the expertise —of board3.4 Board level processes for oversight 113.5 Linkage between executive11compensation and achievement3.6 Organizational structure and key 11individuals responsible for relatedpolicies3.7 Mission and value statements, 5, 6,7internally developed codes of conductor principles, and policies3.8 Mechanisms for shareholders to 22provide recommendations or directionto the Board of Directors[Stakeholder Engagement]3.9 Basis for identification and selection 17of major stakeholders3.10 Approaches to stakeholder17consultation3.11 Type of information generated by 17stakeholder consultations3.12 Use of information resulting from 17stakeholder engagements[Overarching Policies and ManagementSystems]
3.13 Explanation of whether and how theprecautionary approach or principle isaddressed by the organization3.14 Externally developed, voluntary,economic, environmental and socialcharters, sets of principles, or otherinitiatives to which the organizationsubscribes or which it endorses3.15 Principal memberships in industry andbusiness associations, and/ornational/international advocacyorganizations3.16 Policies and/or systems for managingupstream and downstream impacts3.17 Reporting organization’s approach tomanaging indirect economic,environmental and social impact of itsactivities3.18 Major decisions during the reportingperiod regarding the location of, orchanges in operations3.19 Programmes and procedurespertaining to economic, environmentaland social performance3.20 Status of certification pertaining toeconomic, environmental and socialmanagement systemsSection 4: Comparative <strong>Table</strong> with <strong>GRI</strong><strong>Guidelines</strong>6,7,9,10,11,12,13,14,19,20,21,25,26,27,28,29,33,40,51,52,53,54——18, 19,20, 29, 3334, 40, 47, 55,56——37,3821,35,40,43Section 5: Performance Indicators[Economic Performance Indicators]Direct InfluenceEC1, EC2 Customers 1,2EC6, EC7 Investors 22EC8 Public organs 1[Environmental Performance Indicators]EN1 Raw materials 33,51EN3, EN4, EN17 ,EN18 Energy 33, 37, 38, 43,44, 45, 47,48EN21 Water 33,54EN7 Biological versatility 31EN8, EN11 Emissions and waste 33, 37, 38, 49, 50EN33 Suppliers 29, 55,56EN14, EN15 Product and service 37, 38, 40, 41, 42, 43, 44, 45, 46EN16 Observation of laws 6, 7, 33, 51, 52, 53,54EN34 Transportation 37, 38, 47EN35 Overall 39[Social Performance Indicators]
Labor Practices and Fair WorkingConditionsLA1, LA12 Employment 6,7,25,27,28LA13Employer-employee 23relationshipLA6, LA15 Health and safety 26 27LA16, LA17 Training and education 24,36LA10Diversity and6,7,25opportunity3Human RightsHR1 Policies and 6,7,9,10managementHR4 Measures against 6,7,25discriminationSocietySO1, SO4 Local communities 6,7,30,31,32SO2 Bribery and corruption 6,7Product LiabilityPR1Health and safety of 18,21customersPR8 Product and service 6,7,15,16,18,19,20PR3Protection of customers’privacy20