Enzyme Action: Testing Catalase Activity - Vernier Software ...
Enzyme Action: Testing Catalase Activity - Vernier Software ...
Enzyme Action: Testing Catalase Activity - Vernier Software ...
Create successful ePaper yourself
Turn your PDF publications into a flip-book with our unique Google optimized e-Paper software.
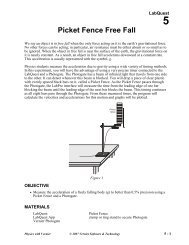
LabQuest 6A• Measure the production of oxygen gas as hydrogen peroxide is destroyed by the enzymecatalase or peroxidase at various pH values.• Measure and compare the initial rates of reaction for the enzyme at each pH value.MATERIALSFigure 1LabQuestenzyme suspensionLabQuest appice<strong>Vernier</strong> O 2 Gas SensorpH buffers400 mL beaker test tube rack10 mL graduated cylinder thermometerthree 18 × 150 mm test tubesthree dropper pipettes250 mL Nalgene bottle Logger Pro (optional)3.0% H 2 O 2PROCEDURE1. Obtain and wear goggles.2. Connect the O 2 Gas Sensor to LabQuest and choose New from the File menu. If you have anolder sensor that does not auto-ID, manually set up the sensor.3. On the Meter screen, tap Rate. Change the data-collection rate to 0.2 samples/second and thedata-collection length to 180 seconds.6A - 2Biology with <strong>Vernier</strong>
LabQuest 6Ain the water bath for 5 minutes before proceeding to Step 15. Record the temperature of thewater bath, as indicated on the thermometer, in the space provided in Table 3.12. Tap Table. Choose Clear All Data from the Table menu.13. Tap Graph to display the graph.14. Find the rate of enzyme activity for test tubes 1, 2, and 3:a. Add 10 drops of the enzyme solution to test tube 1. Repeat Steps 5–7. Record the reactionrate in Table 3.b. Add 10 drops of the enzyme solution to test tube 2. Repeat Steps 5–7. Record the reactionrate in Table 3.c. Add 10 drops of the enzyme solution to test tube 3. Repeat Steps 5–7. Record the reactionrate in Table 3.15. Calculate the average rate for the three trials you tested. Record the average in Table 3.16. Record the average rate and the temperature of your water bath from Table 3 on the classchalkboard. When the entire class has reported their data on the chalkboard, record the classdata in Table 4.Part III <strong>Testing</strong> the Effect of pH17. Place three clean test tubes in a rack and label them pH 4, pH 7, and pH 10.18. Add 5 mL of 3% H 2 O 2 and 5 mL of a pH buffer to each test tube, as in Table 1.Table 1pH of buffer Volume of 3% H 2 O 2 (mL) Volume of buffer (mL)pH 4 5 5pH 7 5 5pH 10 5 519. Tap Table. Choose Clear All Data from the Table menu.20. Tap Graph to display the graph.21. Using the test tube labeled pH 4, add 10 drops of enzyme solution and repeat Steps 5–8.22. Using the test tube labeled pH 7, add 10 drops of enzyme solution and repeat Steps 5–8.23. Using the test tube labeled pH 10, add 10 drops of enzyme solution and repeat Steps 5–7.24. Graph all three runs of data on a single graph.a. Tap Run 3 and select All Runs. All three runs will now be displayed on the same graphaxes.b. Use the displayed graph and the data in Table 5 to answer the questions for Part III.6A - 4Biology with <strong>Vernier</strong>
<strong>Enzyme</strong> <strong>Action</strong>: <strong>Testing</strong> <strong>Catalase</strong> <strong>Activity</strong>DATAPart I Effect of <strong>Enzyme</strong> ConcentrationTest tube label5 Drops10 Drops20 DropsTable 2Slope, or rate (%/s)Part II Effect of TemperatureTable 3Table 4 (Class data)Test tube label Slope, or rate (%/s) Temperature tested Average rateTrial 1Trial 2Trial 3AverageTemperature range:____°CPart III Effect of pHTest tube labelpH 4pH 7pH 10Table 5Slope, or rate (%/s)PROCESSING THE DATA1. For Part II of this experiment, make a graph of the rate of enzyme activity vs. temperature byhand or by using Logger Pro software. Plot the rate values for the class data in Table 4 on they-axis and the temperature on the x-axis. Use this graph to answer the questions for Part II.Biology with <strong>Vernier</strong> 6A - 5
LabQuest 6AQUESTIONSPart I Effect of <strong>Enzyme</strong> Concentration1. How does changing the concentration of enzyme affect the rate of decomposition of H 2 O 2 ?2. If one increases the concentration of enzyme to thirty drops, what do you think will happen tothe rate of reaction? Predict what the rate would be for 30 drops.Part II Effect of Temperature3. At what temperature is the rate of enzyme activity the highest? Lowest? Explain.4. How does changing the temperature affect the rate of enzyme activity? Does this follow apattern you anticipated?5. Why might the enzyme activity decrease at very high temperatures?Part III Effect of pH6. At what pH is the rate of enzyme activity the highest? Lowest?7. How does changing the pH affect the rate of enzyme activity?EXTENSIONS1. Repeat Step 9a to collect data with 10 drops of enzyme suspension. Using the Logger Procomputer software, import your collected data into a computer. In Logger Pro, use the mouseto select each of the time intervals from Table 6—calculate the rate using the Linear Fit foundin the Analyze menu.Table 6Time intervals (Minutes)Rates 0–30 s 30–60 s 60–90 s 90–120 s 120–180 s10 DropsQuestionsWhen is the reaction rate highest? Explain why.When is the reaction rate lowest? Why?2. Different organisms often live in very different habitats. Design a series of experiments toinvestigate how different types of organisms might affect the rate of enzyme activity.Consider testing a plant, an animal, and a protist.3. Presumably, at higher concentrations of H 2 O 2 , there is a greater chance that an enzymemolecule might collide with H 2 O 2 . If so, the concentration of H 2 O 2 might alter the rate ofoxygen production. Design a series of experiments to investigate how differingconcentrations of the substrate hydrogen peroxide might affect the rate of enzyme activity.4. Design an experiment to determine the effect of boiling the catalase on the rate of reaction.5. Explain how environmental factors affect the rate of enzyme-catalyzed reactions.6A - 6Biology with <strong>Vernier</strong>
TEACHER INFORMATION<strong>Enzyme</strong> <strong>Action</strong>:<strong>Testing</strong> <strong>Catalase</strong> <strong>Activity</strong>Experiment6A1. The student pages with complete instructions for data-collection using LabQuest App,Logger Pro (computers), EasyData or DataMate (calculators), and DataPro (Palm handhelds)can be found on the CD that accompanies this book. See Appendix A for more information.2. This experiment may take a single group several lab periods to complete. A good breakingpoint is after the completion of Step 10, when students have tested the effect of differentenzyme concentrations. Alternatively, if time is limited, different groups can be assigned oneof the three tests and the data can be shared.3. Your hot tap water may be in the range of 50-55°C for the hot-water bath. If not, you maywant to supply pre-warmed temperature baths for Part II, where students need to maintainvery warm water. Warn students not to touch the hot water.4. Many different organisms may be used as a source of catalase in this experiment. If enzymesfrom an animal, a protist, and a plant are used by different teams in the same class, it will bepossible to compare the similarities and differences among those organisms. Often, eitherbeef liver, beef blood, or living yeast are used.5. To prepare the yeast solution, dissolve 7 g (1 package) of dried yeast per 100 mL of 2%glucose solution. A 2% glucose is made by adding 20 g of glucose to enough distilled waterto make 1 L of solution. Incubate the suspension in 37 – 40°C water for at least 10 minutes toactivate the yeast. Test the experiment before the students begin. The yeast may need to bediluted if the reaction occurs too rapidly. The reaction in Step 4, with 6 mL of 1.5% hydrogenperoxide, and 5 drops of suspension produces enough oxygen to exceed a measuredconcentration of 22% in 40 to 60 seconds.6. To prepare a liver suspension, homogenize 0.5 to 1.5 g of beef liver in 100 mL of cold water.You will need to test the suspension before use, as its activity varies greatly depending on itsfreshness. Dilute the suspension until the reaction in Step 4, with 6 mL of 1.5% hydrogenperoxide, and 5 drops of suspension produces enough oxygen to exceed a measuredconcentration of 22 % in 40 to 60 seconds. The color of the suspension will be a faint pink.Keep the suspension on ice until used in an experiment.7. 3% H 2 O 2 may be purchased from any supermarket. If refrigerated, bring it to roomtemperature before starting the experiment.8. To extend the life of the O 2 Gas Sensor, always store the sensor upright in the box in which itwas shipped.9. <strong>Vernier</strong> <strong>Software</strong> sells a pH buffer package for preparing buffer solutions with pH values of4, 7, and 10 (order code PHB). Simply add the capsule contents to 100 mL of distilled water.10. You can also prepare pH buffers using the following recipes:• pH 4: Add 2.0 mL of 0.1 M HCl to 1000 mL of 0.1 M potassium hydrogen phthalate.• pH 7: Add 582 mL of 0.1 M NaOH to 1000 mL of 0.1 M potassium dihydrogen phosphate.• pH 10: Add 214 mL of 0.1 M NaOH to 1000 mL of 0.05 M sodium bicarbonate.Biology with <strong>Vernier</strong>6A - 1 T
Experiment 6A11. You may need to let students know that at pH values above 10, enzymes will becomedenatured and the rate of activity will drop. If you have pH buffers higher than 10, havestudents perform an experimental run using them.SAMPLE RESULTSSample class dataTest tube labelSlope, or rate (%/min)5 Drops xxxx10 Drops xxxx20 Drops xxxx0 – 5 °C range: 4°C xxxx20 – 25 °C range: 21 °C xxxx30 – 35 °C range: 34°C xxxx50 – 55 °C range: 51°C xxxxpH 4pH 7pH 10xxxxxxxxxxxxThe effect of H 2 O 2 concentration on the rate ofenzyme activityThe effect of pH on the rateof enzyme activity6A - 2 TBiology with <strong>Vernier</strong>
Teacher Information<strong>Enzyme</strong> <strong>Action</strong>: <strong>Testing</strong> <strong>Catalase</strong> <strong>Activity</strong>The effect of temperature on the rate of enzyme activitySample Data: Effect of H 2 O 2 concentration on the rate of enzyme activity.ANSWERS TO QUESTIONSAnswers have been removed from the online versions of <strong>Vernier</strong>curriculum material in order to prevent inappropriate student use.Graphs and data tables have also been obscured. Full answers andsample data are available in the print versions of these labs.Biology with <strong>Vernier</strong>6A - 3 T


