Rainfed rabi cropping in rice-fallows of Nepal - Research Into Use
Rainfed rabi cropping in rice-fallows of Nepal - Research Into Use
Rainfed rabi cropping in rice-fallows of Nepal - Research Into Use
- No tags were found...

Create successful ePaper yourself
Turn your PDF publications into a flip-book with our unique Google optimized e-Paper software.
<strong>Ra<strong>in</strong>fed</strong> Rabi Cropp<strong>in</strong>g <strong>in</strong> Rice-<strong>fallows</strong> <strong>of</strong> <strong>Nepal</strong>:<strong>Ra<strong>in</strong>fed</strong> Agriculture Impact Assessment Study No. 4Monitor<strong>in</strong>g Impact Assessment and Learn<strong>in</strong>g Component (MIL) <strong>of</strong>the <strong>Research</strong> <strong>in</strong>to <strong>Use</strong> Programme (RiU)i
<strong>Ra<strong>in</strong>fed</strong> Rabi Cropp<strong>in</strong>g <strong>in</strong> Rice-<strong>fallows</strong> <strong>of</strong> <strong>Nepal</strong>:<strong>Ra<strong>in</strong>fed</strong> Agriculture Impact Assessment Study No. 4Prepared by:Part A: Czech ConroyPart B: Dave HarrisPart C: Marlene Buchy and Ambika SapkotaAcknowledgementsIn addition to the authors <strong>of</strong> the different parts <strong>of</strong> this case study, several staff members <strong>of</strong>FORWARD were <strong>in</strong>volved <strong>in</strong> collect<strong>in</strong>g and process<strong>in</strong>g the <strong>in</strong>formation for both thestructured survey and the qualitative survey (see relevant parts <strong>of</strong> the report for details): weare grateful to them all. We would also like to thank FORWARD management for theirsupport throughout the study. We are also grateful to Dr Sheelagh O’Reilly <strong>of</strong> IOD for hercont<strong>in</strong>ual support, advice and encouragement throughout the study; and to Dr Krishna Joshifor his liaison role and logistical support <strong>in</strong> <strong>Nepal</strong>. F<strong>in</strong>ally, we acknowledge the contribution <strong>of</strong>the many farmers who made this study possible and gave so freely <strong>of</strong> their time.ii
TABLE OF CONTENTSAcknowledgements ..............................................................................................iiPART A: SYNTHESIS OF STUDY FINDINGS........................................................... 1INTRODUCTION .................................................................................................... 1GENERAL OVERVIEW OF THE METHODOLOGY............................................... 2CASE STUDY FINDINGS....................................................................................... 4LEARNINGS and INSIGHTS .................................................................................. 8PART B REPORT ON THE STRUCTURED SURVEY............................................... 9EXECUTIVE SUMMARY ...................................................................................... 10INTRODUCTION .................................................................................................. 14METHODOLOGY ................................................................................................. 16RESULTS ............................................................................................................. 20Characteristics <strong>of</strong> users and non users ............................................................. 20Pattern <strong>of</strong> adoption <strong>of</strong> varieties and RRC technologies..................................... 24Source <strong>of</strong> seed <strong>of</strong> new varieties ........................................................................ 27Pattern <strong>of</strong> adoption <strong>of</strong> new crop varieties with time........................................... 28Distribution <strong>of</strong> seeds <strong>of</strong> particular varieties by user households........................ 38Interaction between RRC technologies and crops ............................................ 43Household food self sufficiency <strong>of</strong> users ........................................................... 44Problems with the new varieties as perceived by users .................................... 44Non-users’ views on new project varieties ........................................................ 46Non-users’ <strong>in</strong>tentions ........................................................................................ 50Extent <strong>of</strong> adoption and susta<strong>in</strong>ability................................................................. 54Conclusions ...................................................................................................... 55References........................................................................................................ 56ANNEXES ................................................................................................................ 57ANNEX 1 .............................................................................................................. 57ANNEX 2 .............................................................................................................. 67PART C REPORT ON THE QUALITATIVE SURVEY.............................................. 76EXECUTIVE SUMMARY ...................................................................................... 79INTRODUCTION .................................................................................................. 81METHODOLOGY ................................................................................................. 83FINDINGS ............................................................................................................ 86Kapilvastu district .............................................................................................. 87Jhapa district..................................................................................................... 91INSIGHTS: IMPACT AND ISSUES OF RRC TECHNOLOGIES .......................... 95References: .......................................................................................................... 96ANNEXES ............................................................................................................ 97Annex A: Schedule and process ....................................................................... 97Annex B: Complementary data ......................................................................... 99iii
PART A: SYNTHESIS OF STUDY FINDINGSPrepared by:Czech ConroyNatural Resources InstituteUniversity <strong>of</strong> Greenwich, ME4 4TBUKINTRODUCTIONThis case study is an impact assessment <strong>of</strong> <strong>Ra<strong>in</strong>fed</strong> Rabi Cropp<strong>in</strong>g (RRC) technologies,developed <strong>in</strong> DFID Renewable Natural Resource Strategy (RNRRS) supported projects <strong>of</strong>the Plant Sciences <strong>Research</strong> Programme (PSP). A study supported by the PSP estimatedthe extent <strong>of</strong> <strong>rice</strong>-<strong>fallows</strong> and their spatial and temporal distribution <strong>in</strong> South Asia by us<strong>in</strong>ggeographic <strong>in</strong>formation system and satellite remote sens<strong>in</strong>g techniques. Rice <strong>fallows</strong> arethose lands that, although used to grow <strong>rice</strong> dur<strong>in</strong>g the monsoon (kharif) season, are leftfallow dur<strong>in</strong>g the follow<strong>in</strong>g post-ra<strong>in</strong>y (<strong>rabi</strong>) season. The study suggested that <strong>rice</strong>-<strong>fallows</strong> <strong>in</strong><strong>Nepal</strong> amounted to 26% <strong>of</strong> the total <strong>rice</strong> area.To try to promote susta<strong>in</strong>able <strong>in</strong>tensification <strong>of</strong> ra<strong>in</strong>fed <strong>rice</strong> <strong>fallows</strong>, the <strong>Ra<strong>in</strong>fed</strong> RabiCropp<strong>in</strong>g (RRC) project was conceptualized and a one-year pilot phase was implemented <strong>in</strong>four districts from October 2001 to June 2002. The project was managed by BangorUniversity’s CAZS Natural Resources and was implemented <strong>in</strong> collaboration withFORWARD, a <strong>Nepal</strong>-based NGO. It was found that more than half (58%) <strong>of</strong> the farmland <strong>in</strong>the project area rema<strong>in</strong>ed fallow after <strong>rice</strong> harvests. This was due to the low motivation <strong>of</strong>farmers to take up w<strong>in</strong>ter <strong>cropp<strong>in</strong>g</strong>, as they perceived low productivity <strong>of</strong> crops and high risk<strong>of</strong> crop failure as a result <strong>of</strong> poor soil fertility, lack <strong>of</strong> dry farm<strong>in</strong>g technologies and lack <strong>of</strong>drought tolerant crops and varieties. Draw<strong>in</strong>g on the experience <strong>of</strong> the pilot phase, thesecond phase <strong>of</strong> the project was implemented from July 2002 to 2006, <strong>in</strong> the same districts.Most households only received seeds <strong>of</strong> new varieties <strong>in</strong> any reasonable quantity from 2004onwards.In the second phase, the project aimed to validate suitable agronomic and social activitiesthat were <strong>in</strong>tended to support susta<strong>in</strong>able <strong>in</strong>tensification <strong>of</strong> the <strong>rice</strong>-fallow system by:<strong>in</strong>tegrat<strong>in</strong>g short duration <strong>rice</strong> varieties <strong>in</strong>to the ma<strong>in</strong> season to make easier the grow<strong>in</strong>g <strong>of</strong>w<strong>in</strong>ter legumes (e.g. lentil, chickpea); mak<strong>in</strong>g Mungbean, a spr<strong>in</strong>g season crop which can begrown after w<strong>in</strong>ter legumes, available for test<strong>in</strong>g by farmers. In addition to new varieties, theproject sought to validate and support the use <strong>of</strong>: <strong>in</strong>tegrated pest management (IPM) andIntegrated Plant Nutrient Management system (IPNM) approaches to improve the soil healthand to <strong>in</strong>crease productivity. For the purposes <strong>of</strong> this study, the technologies were grouped<strong>in</strong>to:o new <strong>rice</strong> varieties, <strong>of</strong>ten the products <strong>of</strong> client-oriented breed<strong>in</strong>g produced <strong>in</strong>sister projects;o new chickpea varieties;o new mungbean varieties;o ‘on-farm’ seed prim<strong>in</strong>g;o Improved compost<strong>in</strong>g;o Integrated Pest Management;o Integrated Plant Nutrient Management.1
This impact assessment used a variety <strong>of</strong> structured and semi-structured methods. Part B <strong>of</strong>this report describes the methodology and f<strong>in</strong>d<strong>in</strong>gs <strong>of</strong> fieldwork undertaken by CAZS-NR, <strong>in</strong>collaboration with the <strong>Nepal</strong>i NGO, FORWARD. Part C describes a subsequent semistructuredand more qualitative piece <strong>of</strong> fieldwork undertaken by Dr Marlene Buchy andFORWARD staff. This part <strong>of</strong> the document:• describes the overall methodology used <strong>in</strong> the case study;• synthesizes the key f<strong>in</strong>d<strong>in</strong>gs from the two studies, identify<strong>in</strong>g both similarities anddifferences; and also• draws lessons from the f<strong>in</strong>d<strong>in</strong>gs relat<strong>in</strong>g to impact assessment, technologydevelopment and <strong>in</strong>novation processes.This is one <strong>of</strong> seven case studies on ra<strong>in</strong>fed agriculture <strong>in</strong>novations <strong>in</strong> south Asia, which arepart <strong>of</strong> a broader ‘cluster study’. Each case study, and the broader cluster study, aims toobta<strong>in</strong> <strong>in</strong>formation regard<strong>in</strong>g:1. extent <strong>of</strong> use <strong>of</strong> the <strong>in</strong>novation2. factors expla<strong>in</strong><strong>in</strong>g extent <strong>of</strong> <strong>in</strong>novation (factors <strong>in</strong>fluenc<strong>in</strong>g use)3. Susta<strong>in</strong>ability <strong>of</strong> use <strong>of</strong> <strong>in</strong>novations by farmers.4. who the <strong>in</strong>novators are and are not5. impact (<strong>in</strong>clud<strong>in</strong>g benefits and disbenefits) <strong>of</strong> the <strong>in</strong>novation6. factors expla<strong>in</strong><strong>in</strong>g differential impact among potential users/<strong>in</strong>novators.GENERAL OVERVIEW OF THE METHODOLOGYThe structured survey was undertaken <strong>in</strong> the four districts where the PSP project had beenimplemented, namely: Kapilvastu, Siraha, Saptari and Jhapa. Six villages that had been<strong>in</strong>volved with project activities s<strong>in</strong>ce 2004 were randomly selected <strong>in</strong> each <strong>of</strong> the districts, but<strong>in</strong> one district only four villages were surveyed because there were <strong>in</strong>sufficient users <strong>in</strong> theother two. (See Part B for details.)The structured survey <strong>in</strong>volved village-wide group discussions, <strong>in</strong> which all households <strong>in</strong>each <strong>of</strong> the 22 survey villages were identified as either <strong>Use</strong>rs <strong>of</strong> RRC technologies or Nonusers.From the lists thus generated, 12 users and four non-users were randomly selected <strong>in</strong>each village for household <strong>in</strong>terviews. In total, 287 <strong>Use</strong>r households (HH) and 96 Non-userHHs were <strong>in</strong>terviewed, us<strong>in</strong>g a user- and a non-user questionnaire respectively. (See Part Bfor further details).The qualitative (semi-structured) study was conducted <strong>in</strong> two (Jhapa and Kapilvastu) <strong>of</strong> thefour districts covered by the structured survey, represent<strong>in</strong>g high and low adoption <strong>of</strong> theproject outputs respectively. Three villages (out <strong>of</strong> the six covered <strong>in</strong> the structured survey)were selected purposively <strong>in</strong> each district, based on two criteria: the <strong>in</strong>itial level <strong>of</strong> <strong>in</strong>terest <strong>in</strong>the new varieties; and the level <strong>of</strong> social differentiation with<strong>in</strong> the village. Villages wereselected with high level <strong>of</strong> use <strong>of</strong> the varieties <strong>in</strong>troduced by the project, whilst also mak<strong>in</strong>gsure that they were representative <strong>of</strong> other characteristics such as ethnic diversity.Key <strong>in</strong>formant discussions were used as the <strong>in</strong>itial contact activity <strong>in</strong> the village to gathergeneric <strong>in</strong>formation on the village and to f<strong>in</strong>d help to identify and contact the possibledifferent groups to <strong>in</strong>terview subsequently. The focus group discussion (FGD), a tool used toexplore one specific theme at a time by a group <strong>of</strong> selected participants (6-7 maximum), waschosen as the preferred tool. Depend<strong>in</strong>g on the theme explored, people were selected on2
the basis <strong>of</strong> their gender, class or caste or <strong>in</strong> relation to their pr<strong>of</strong>essional status. Althoughthe group discussions were fairly open-ended the survey aimed to cover a number <strong>of</strong> coretopics, such as changes <strong>in</strong> livelihoods and susta<strong>in</strong>ability <strong>of</strong> livelihoods.What k<strong>in</strong>d <strong>of</strong> comparison?Assess<strong>in</strong>g the impact <strong>of</strong> any particular development <strong>in</strong>tervention – be it a technology, policyor <strong>in</strong>stitutional change – is seldom straightforward. The context <strong>in</strong> which the <strong>in</strong>terventiontakes place is real life – dynamic, complex, uncontrolled and <strong>of</strong>ten spatially heterogeneous –and this makes it difficult to separate the effects (if any) <strong>of</strong> the <strong>in</strong>tervention from any otherchanges <strong>in</strong> people’s lives that may have been tak<strong>in</strong>g place. There may be other contextualchanges <strong>in</strong> rural study areas - such as electrification, development and roads and schools -that could have contributed to any general positive changes <strong>in</strong> local livelihoods that havetaken place s<strong>in</strong>ce the <strong>in</strong>tervention was implemented or <strong>in</strong>itiated.In controlled experiments scientific researchers <strong>of</strong>ten make ‘with and without’ comparisons<strong>in</strong>volv<strong>in</strong>g two or more very similar groups <strong>of</strong> people, livestock, crops or whatever is be<strong>in</strong>gstudied and is expected to be affected by the ‘<strong>in</strong>tervention’ or ‘treatment’. Any differencesthat develop between the groups dur<strong>in</strong>g the period <strong>of</strong> the experiment can then be plausiblyattributed to the ‘<strong>in</strong>tervention’. However, use <strong>of</strong> a ‘with and without’ approach was notpossible <strong>in</strong> this study, as it would have been difficult to ensure that any two villages <strong>in</strong>volved<strong>in</strong> a comparison were sufficiently similar, and hence be confident that any differencessubsequently identified between farmers <strong>in</strong> the two villages were due to the PSP projecttechnologies.The ‘before and after’ approach was used. This approach has its challenges – for example, ifwe had been measur<strong>in</strong>g impact <strong>in</strong> terms <strong>of</strong> changes <strong>in</strong> household <strong>in</strong>come s<strong>in</strong>ce technologieshad been ‘adopted’ by farmers then any <strong>in</strong>crease <strong>in</strong> <strong>in</strong>come could have been due to manyother factors. The ‘before and after’ comparison was made on the basis <strong>of</strong> survey data onthe current situation for certa<strong>in</strong> factors, and farmers’ recall <strong>of</strong> equivalent data prior to use <strong>of</strong>the project technologies. For example, the total quantity <strong>of</strong> food gra<strong>in</strong> produced by ahousehold was estimated, for two po<strong>in</strong>ts <strong>in</strong> time, on the basis <strong>of</strong> farmer recall data aboutcrop yields, areas planted etc. Another challenge has been the fact that the PSP projectstested a very large number <strong>of</strong> technologies, which makes it difficult, if not impossible, toattribute benefits to any particular technology.M<strong>in</strong>imis<strong>in</strong>g biasThe senior staff <strong>of</strong> RIUP’s MIL component decided that the structured survey would beimplemented by staff <strong>of</strong> the organisations that had been <strong>in</strong>volved <strong>in</strong> develop<strong>in</strong>g anddistribut<strong>in</strong>g the RRC technologies and varieties, as they were familiar with the technologyand with the locations where the projects had operated and the villagers liv<strong>in</strong>g there. An<strong>in</strong>dependent Cluster Study Team Manager (Czech Conroy) was appo<strong>in</strong>ted to oversee thedesign and implementation <strong>of</strong> this and several other case studies. He had the f<strong>in</strong>al say onsurvey methods, word<strong>in</strong>g <strong>of</strong> questionnaires etc. In the structured survey household selectionwas random, and for practical reasons the selection was done by the field teamsimplement<strong>in</strong>g the survey.In the questionnaire used <strong>in</strong> the structured household survey almost all <strong>of</strong> the questionswere closed (e.g. Yes/No) rather than open <strong>in</strong> order to avoid bias (sub-conscious as well asconscious) <strong>in</strong> the way that answers were recorded. The qualitative study, on the other hand,would be <strong>in</strong>herently semi-structured or unstructured, which would have <strong>in</strong>creased the3
potential for bias among survey team members creep<strong>in</strong>g <strong>in</strong>. For this reason, and alsobecause <strong>of</strong> the special skills required to undertake qualitative work <strong>of</strong> this nature, the orig<strong>in</strong>alplan was that this study would be done by a suitable qualified <strong>in</strong>dependent researcher.However, the person concerned withdrew his services as the work was about to commence.It was then decided that the study would be done by suitably qualified FORWARD staff,under the supervision <strong>of</strong> the Study Team’s social development advisor, Dr Marlene Buchy.The use <strong>of</strong> two different sets <strong>of</strong> study methods was seen as advantageous <strong>in</strong> terms <strong>of</strong>triangulation – cross-check<strong>in</strong>g – <strong>of</strong> survey f<strong>in</strong>d<strong>in</strong>gs.Assess<strong>in</strong>g the wealth status <strong>of</strong> respondentsThe Cluster Study Team developed a poverty <strong>in</strong>dex (PI) to be used <strong>in</strong> four technology impactassessment studies, <strong>in</strong>clud<strong>in</strong>g this one. The PI enables the study to dist<strong>in</strong>guish wealthierhouseholds from the rest <strong>of</strong> the households among those surveyed, and to compare thewealth status <strong>of</strong> technology users with that <strong>of</strong> non-users. There were six <strong>in</strong>dicators selectedfor the poverty <strong>in</strong>dex, each <strong>of</strong> which was given a set <strong>of</strong> possible scores (see Part B, Table 5for details), namely:• Livestock units• Total quantity <strong>of</strong> all food gra<strong>in</strong>s produced <strong>in</strong> the season 07-08 per capita• Ro<strong>of</strong> type• Number <strong>of</strong> jobholders <strong>in</strong> household who provide <strong>in</strong>come• Ownership <strong>of</strong> a tractor• Extent <strong>of</strong> unskilled labour migration.CASE STUDY FINDINGSThis section synthesizes the f<strong>in</strong>d<strong>in</strong>gs from the structured survey (found <strong>in</strong> Part B) and thesemi-structured, qualitative survey (Part C), and frames them around the six study questionslisted earlier. By and large the two sets <strong>of</strong> f<strong>in</strong>d<strong>in</strong>gs are consistent and complementary: wherediscrepancies occur they have been noted.(1) Extent <strong>of</strong> <strong>Use</strong> and (2) Factors Influenc<strong>in</strong>g Extent<strong>Use</strong> on survey household landNew <strong>rice</strong> varieties were grown on an average <strong>of</strong> 0.1 to 0.23 ha (9% to 24% <strong>of</strong> householdland) except for Barkhe 2014 <strong>in</strong> Saptari where it was grown on 43% <strong>of</strong> users’ land. The othermajor <strong>rice</strong> success story was that <strong>of</strong> BG 1442 <strong>in</strong> Jhapa where 82 households (99% <strong>of</strong> thehouseholds sampled) grew it as a spr<strong>in</strong>g (Chaite) crop on an average <strong>of</strong> 0.46 ha.As land suitable for grow<strong>in</strong>g chickpea is scarcer than that which is suitable for <strong>rice</strong>cultivation, mean area per HH grow<strong>in</strong>g chickpea was only around 0.05 ha to 0.15 ha.Although yields per unit area were <strong>of</strong>ten reasonable (given the low levels <strong>of</strong> <strong>in</strong>puts used)amounts <strong>of</strong> chickpea grown per HH were small. (In Kapilvastu chickpea was grown on smallareas <strong>of</strong> land and so production per HH was relatively low; whereas <strong>in</strong> Saptari and Sirahalarger areas were sown (but proportion <strong>of</strong> users was less) and hence production perhousehold was higher.)4
The land area sown to mungbean per HH was low so production per HH was also low.<strong>Use</strong> <strong>in</strong> survey villagesThe proportion <strong>of</strong> HHs grow<strong>in</strong>g mungbean <strong>in</strong> Jhapa and Kapilvastu has been steady ataround 30-40%. The household survey results suggest that seed prim<strong>in</strong>g has been adopted,on average, by around 50% <strong>of</strong> those HHs <strong>in</strong>itially tra<strong>in</strong>ed to do it. On average, the rate <strong>of</strong>adoption <strong>of</strong> improved compost<strong>in</strong>g was around 40% <strong>of</strong> those HHs <strong>in</strong>itially tra<strong>in</strong>ed.Extent <strong>of</strong> use <strong>in</strong> and between survey districtsSurround<strong>in</strong>g non-project villages were not surveyed and accurate <strong>in</strong>formation on the spread<strong>of</strong> the new varieties elsewhere <strong>in</strong> the districts is not available. However, seeds <strong>of</strong> newvarieties had been re-distributed by relatively few households, which is not surpris<strong>in</strong>g giventhe short timescale.Rice <strong>Use</strong> levels <strong>of</strong> new <strong>rice</strong> varieties varied by district and by variety. In Siraha, adoption <strong>of</strong>PVS <strong>rice</strong> varieties was low (only 4%) because the RRC project mostly tested (through PVS)short duration varieties which proved to be unsuitable for the project villages. Adoption <strong>of</strong><strong>rice</strong> varieties bred from COB was highest <strong>in</strong> Saptari (63%) which was ma<strong>in</strong>ly due to the rapiduptake <strong>of</strong> Barkhe 2014 that was particularly preferred as a very good replacement forKanchhi Masuli, the most popular local variety. Adoption <strong>of</strong> COB varieties (short to mediumduration) was lowest <strong>in</strong> Jhapa and Siraha (2%) where medium- to longer duration varietiesare preferred.Chickpea was not adopted <strong>in</strong> Jhapa where soils are deficient <strong>in</strong> boron and where diseasepressure, particularly from Botrytis Grey Mould, for chickpea is very high. Adoption <strong>of</strong>chickpea cvs Awarodhi and Tara was substantial <strong>in</strong> Kapilvastu and Saptari.Mungbean, particularly cvs Kalyan and Prateeksha, was grown <strong>in</strong> all four districts on verysmall areas, rang<strong>in</strong>g from 0.03 – 0.14 ha, and was particularly popular <strong>in</strong> Siraha.Improved compost<strong>in</strong>g, IPM and IPNM were all quite popular <strong>in</strong> Jhapa but less so <strong>in</strong> the otherthree districts, the only exception be<strong>in</strong>g IPNM <strong>in</strong> Siraha and, possibly, improved compost<strong>in</strong>g<strong>in</strong> Kapilvastu. These relatively high values for adoption <strong>of</strong> these three technologies <strong>in</strong> Jhapaare due to high rates <strong>of</strong> adoption <strong>in</strong> <strong>rice</strong> and <strong>in</strong> mungbean but not <strong>in</strong> chickpea (which is notgrown).Table A1 summarises the extent to which different technologies were found to be used <strong>in</strong>each district.Table A1: Extent <strong>of</strong> <strong>Use</strong> <strong>of</strong> the Crop and RRC Technologies by DistrictTechnology Jhapa Kapilvastu Saptari SirahaCrop varietiesRice - COB Low Medium High LowRice - PVS High Medium Low LowChickpea Low (0) Medium High LowMungbean Medium Medium High HighRRC technologiesSeed prim<strong>in</strong>g High High Low LowCompost<strong>in</strong>g High High Medium LowIPM High Medium Low LowIPNM High Low High HighNote: High = >30%; medium = 15-30%; low =
3. Susta<strong>in</strong>ability - cont<strong>in</strong>uity <strong>of</strong> useA limited amount <strong>of</strong> <strong>in</strong>formation suggests that for all three crops the number <strong>of</strong> householdsus<strong>in</strong>g new varieties, and the area <strong>of</strong> land that each household sows, are at least be<strong>in</strong>gma<strong>in</strong>ta<strong>in</strong>ed and may be <strong>in</strong>creas<strong>in</strong>g. Averaged over all four districts, the percentage <strong>of</strong>sampled households grow<strong>in</strong>g new <strong>rice</strong> varieties, the area grown per household and theproduction per household all <strong>in</strong>creased steadily between 2004 and 2008, although the timecourse <strong>of</strong> adoption varied between districts. The mean production per hectare rema<strong>in</strong>edrelatively constant over this period at between 3 and 4 t ha -1 .In the case <strong>of</strong> chickpea and mungbean the proportion <strong>of</strong> households <strong>in</strong> Kapilvastu that grewchickpea was high dur<strong>in</strong>g all four years; and the proportion grow<strong>in</strong>g mungbean <strong>in</strong> Jhapa andKapilvastu rema<strong>in</strong>ed fairly steady dur<strong>in</strong>g the four years at around 30-40%. In contrast,adoption by HHs <strong>in</strong> Saptari and Siraha <strong>in</strong>creased steadily over the four years and areassown were also larger <strong>in</strong> those two districts.In the household survey f<strong>in</strong>d<strong>in</strong>gs the one major exception to cont<strong>in</strong>ued use was chickpeagrowers <strong>in</strong> Jhapa, where the number <strong>of</strong> user households decl<strong>in</strong>ed steadily over the fouryears, down to zero <strong>in</strong> 2008: this was due to the factors mentioned earlier – diseasepressure and boron deficiency. The qualitative study, however, found that mungbean usehad also decl<strong>in</strong>ed among some farmers due to various factors such as the higher labourrequirements and lack <strong>of</strong> access to markets.4. Who are the <strong>in</strong>novators?Virtually 100% <strong>of</strong> the 287 users covered by the household survey were poor as def<strong>in</strong>ed bythe PI. This is not surpris<strong>in</strong>g, given that the orig<strong>in</strong>al selection by FORWARD <strong>of</strong> targetcommunities and households was highly poverty-focused. There were some significantdifferences between districts <strong>in</strong> the mean PI. On average, households <strong>in</strong> Jhapa wererelatively less poor than those <strong>in</strong> Kapilvastu and Saptari; and these, <strong>in</strong> turn, were less poorthan those <strong>in</strong> Siraha. Regard<strong>in</strong>g ethnicity, Brahm<strong>in</strong>s/Chhetris (50.5%) and members <strong>of</strong> theTerai group (35.9%) constituted the vast majority <strong>of</strong> the users.5. Differential impactThe poorest farmers were less likely to be users; and even if they were users they wouldtend to benefit from the technologies less then poor farmers with more land. Nevertheless,even the latter are poor - around 99% <strong>of</strong> all HHs sampled had a PI
widely on relatively large areas <strong>of</strong> land per HH. In districts where legume adoption wassignificant (Kapilvastu and Saptari) they were grown on small areas <strong>of</strong> land and contributedless, <strong>in</strong> absolute terms, to household food gra<strong>in</strong> self-sufficiency. The qualitative survey als<strong>of</strong>ound that HH food gra<strong>in</strong> self-sufficiency has improved by 2 to 4 months per year and <strong>in</strong> allgroups people reported that this had resulted <strong>in</strong> a decrease <strong>in</strong> food-related expenditure.All the groups <strong>in</strong>volved <strong>in</strong> the qualitative study mentioned that their agricultural knowledgehad <strong>in</strong>creased – e.g. <strong>in</strong> soil fertility management, <strong>in</strong>clud<strong>in</strong>g organic approaches and organicpesticides – which they attributed to FORWARD’s <strong>in</strong>tervention (see Part C). Even thoughsome farmers may not have been grow<strong>in</strong>g some <strong>of</strong> the <strong>in</strong>itially distributed <strong>rice</strong> or chick peavarieties anymore, they were now more likely to choose fast grow<strong>in</strong>g varieties <strong>of</strong> <strong>rice</strong>.Limitations and constra<strong>in</strong>ts <strong>of</strong> technologies and new varietiesOverall, <strong>in</strong> the household survey the two most important problems cited by users <strong>of</strong> the newvarieties <strong>of</strong> <strong>rice</strong>, chickpea and mungbean were pests and diseases. However, it should benoted that these are also the most important problems <strong>in</strong> general for these crops irrespective<strong>of</strong> variety. These constra<strong>in</strong>ts were also identified <strong>in</strong> the qualitative survey.The other important problems cited <strong>in</strong> the household survey were lack <strong>of</strong> seed and <strong>in</strong>puts,lack <strong>of</strong> irrigation and theft or damage from stray animals (<strong>in</strong> relation to legumes, particularlymungbean). Inadequate technical know-how was also considered important by users <strong>of</strong>legumes, particularly <strong>in</strong> Saptari and Siraha. Aga<strong>in</strong>, the f<strong>in</strong>d<strong>in</strong>gs from the qualitative surveywere quite similar.Farmers <strong>in</strong>volved <strong>in</strong> the qualitative survey identified <strong>in</strong>sufficient water and lack <strong>of</strong> irrigation asanother major constra<strong>in</strong>t on mung bean and chickpea production. They also reported thatKabuli chick pea is not grown <strong>in</strong>tensively as it is prone to pest damage and sensitive tomoisture. It also requires more frequent weed<strong>in</strong>g then local varieties. The threat <strong>of</strong> straycattle was given as another factor discourag<strong>in</strong>g mungbean cultivation; and the absence <strong>of</strong>good markets was mentioned as a deterrent to <strong>in</strong>vest<strong>in</strong>g <strong>in</strong> large scale mungbean cultivation.The qualitative survey found that <strong>in</strong> Jhapa the reduction <strong>of</strong> <strong>fallows</strong> has had an impact ongreen fodder availability. In all the groups farmers reported a decrease <strong>in</strong> livestock becausethe <strong>in</strong>crease <strong>in</strong> the grow<strong>in</strong>g period had reduced the area available for graz<strong>in</strong>g.The current lack <strong>of</strong> clarity on land tenure policy is a more generic factor h<strong>in</strong>der<strong>in</strong>g risk tak<strong>in</strong>gfor farmers (see Part C for details).ImpactThe qualitative survey found that there has been a general improvement <strong>in</strong> rural livelihoods<strong>in</strong> the terai dur<strong>in</strong>g the last few years, due to various factors: for example, electrification androads construction were mentioned by farmers as factors <strong>of</strong> change. It is very difficult toseparate the impacts <strong>of</strong> the new technologies and crop varieties from those <strong>of</strong> other changesthat have been tak<strong>in</strong>g place.Farmers <strong>in</strong> Kapilvastu reported that the <strong>in</strong>creased availability <strong>of</strong> home grown lentils hadresulted <strong>in</strong> an <strong>in</strong>creased consumption <strong>of</strong> lentils; and they perceived a l<strong>in</strong>k between this andother dietary improvements and their children becom<strong>in</strong>g ‘stronger’. Farmers <strong>in</strong> Kapilvastualso reported that the <strong>in</strong>crease <strong>in</strong> food gra<strong>in</strong> production had resulted <strong>in</strong> better education forchildren; and that the <strong>in</strong>troduction <strong>of</strong> w<strong>in</strong>ter crops had created more job opportunities for thelandless and small holders.7
LEARNINGS and INSIGHTSThe RRC project was highly complex. It used a community-development type approach <strong>in</strong>which many different technologies, and comb<strong>in</strong>ations <strong>of</strong> technologies, were made availableto farm<strong>in</strong>g households. The technologies themselves were: plant-based ones (new varieties)that could be readily tested by farmers without much additional project <strong>in</strong>volvement; andknowledge-based (e.g. seed prim<strong>in</strong>g, improved compost<strong>in</strong>g) <strong>in</strong>terventions that requiredvary<strong>in</strong>g degrees <strong>of</strong> farmer tra<strong>in</strong><strong>in</strong>g. It was perhaps <strong>in</strong>evitable, then, that the impact <strong>of</strong><strong>in</strong>dividual technologies would be difficult to determ<strong>in</strong>e.The strik<strong>in</strong>g differences between districts <strong>in</strong> use levels <strong>of</strong> different technologies serve as arem<strong>in</strong>der <strong>of</strong> the complexity and variability <strong>of</strong> farm<strong>in</strong>g systems, even with<strong>in</strong> one recognisableregion like the terai. The case study f<strong>in</strong>d<strong>in</strong>gs provide yet another example <strong>of</strong> the<strong>in</strong>appropriateness <strong>of</strong> a one-size-fits-all approach to technology generation anddissem<strong>in</strong>ation, which has implications for agricultural research and development. Theyhighlight the importance <strong>of</strong> hav<strong>in</strong>g a wide range <strong>of</strong> technologies such as crop varieties (as <strong>in</strong>the RRC project studied here).The need for PVS approach <strong>in</strong> order to match varieties to farmers’ needs for particularsituations was confirmed. For example, <strong>in</strong> at least one <strong>of</strong> the districts where the RRC projecttested short duration <strong>rice</strong> varieties it became apparent through the PVS process that mostfarmers were <strong>in</strong>terested <strong>in</strong> medium and long duration varieties; and <strong>in</strong> Jhapa district itbecame apparent the agro-ecological conditions were not conducive to chickpea production.Availability <strong>of</strong> land is a key issue for projects that seek to improve livelihoods by <strong>in</strong>creas<strong>in</strong>gagricultural productivity. Average land hold<strong>in</strong>g per household is very small <strong>in</strong> the projectvillages and even very large relative <strong>in</strong>creases <strong>in</strong> crop production are not large <strong>in</strong> absoluteterms.The focus <strong>of</strong> the PSP projects was on technological research rather than supportiveextension approaches. The RNRRS programme relied on spontaneous spread <strong>of</strong> effectivetechnologies by farmers; or on research project managers l<strong>in</strong>k<strong>in</strong>g up with extension-orientedprogrammes. However, the latter was not available <strong>in</strong> this case, and the former is <strong>of</strong>ten<strong>in</strong>adequate. The absence <strong>of</strong> a fund<strong>in</strong>g mechanism to promote promis<strong>in</strong>g research outputswas a generic weakness <strong>of</strong> the RNRRS programme: this is now be<strong>in</strong>g addressed for sometechnologies through DFID’s RIU programme.A methodological learn<strong>in</strong>g from this study is that group discussions tended to (a)underestimate the level <strong>of</strong> use with<strong>in</strong> a village <strong>of</strong> varieties that are relatively rare; and (b)overestimate the more popular varieties. This throws <strong>in</strong>to question the accuracy <strong>of</strong> resultsfrom group discussions, particularly those at which the entire village is not represented. Italso suggests that group discussions are particularly poor for estimat<strong>in</strong>g the early adoption <strong>of</strong>new varieties when they are likely to occur at a low frequency <strong>in</strong> a village.8
PART B REPORT ON THE STRUCTURED SURVEYPrepared by:Dave Harris, CAZS Natural Resources, Bangor UniversityAcknowledgementsThe follow<strong>in</strong>g people from FORWARD contributed to the study:SN Name Position Role1 Narayan P Khanal Senior Program Manager Coord<strong>in</strong>ation2 Ujjal Tiwari Program Officer Data clean<strong>in</strong>g3 Ambika Sapkota Program Officer Coord<strong>in</strong>ation and data clean<strong>in</strong>g4 Lakpa T Sherpa Senior Technician Data collection5 Krishna P Gupta Field Officer Data collection6 Shova R Devkota Senior Technician Data collection7 Achyut P Upreti Senior Technician Data collection8 Yaba N Tiwari Senior Technician Data collection9 Prativa Aryal Consultant Data entry10 Santosh Poudel Senior Program Officer Questionnaire development11 Bala R Bhandari Program Officer Data collection12 Mani R Aryal Consultant Data entry9
EXECUTIVE SUMMARY<strong>Use</strong>rs• The uptake and impact <strong>of</strong> a number <strong>of</strong> technologies, designed to improve thelivelihoods <strong>of</strong> resource-poor farm<strong>in</strong>g households <strong>in</strong> <strong>rice</strong> fallow areas <strong>of</strong> Jhapa,Kapilbastu, Saptari and Siraha districts <strong>of</strong> <strong>Nepal</strong>, were assessed <strong>in</strong> 2008 us<strong>in</strong>g GroupDiscussions and Household Questionnaires.• A wide range <strong>of</strong> <strong>Ra<strong>in</strong>fed</strong> Rabi Cropp<strong>in</strong>g (RRC) technologies had been dissem<strong>in</strong>atedand promoted by FORWARD and its partners dur<strong>in</strong>g DFID-funded projects s<strong>in</strong>ce2002. For the purposes <strong>of</strong> impact evaluation, the technologies were grouped <strong>in</strong>to:o new <strong>rice</strong> varieties, <strong>of</strong>ten the products <strong>of</strong> client-oriented breed<strong>in</strong>g produced <strong>in</strong>sister projects;o new chickpea varieties;o new mungbean varieties;o ‘on-farm’ seed prim<strong>in</strong>g;o Improved compost<strong>in</strong>g;o Integrated Pest Management (IPM);o Integrated Plant Nutrient Management.• On the basis <strong>of</strong> village-wide group discussions, all (1365 households) households <strong>in</strong>22 villages across the four districts were identified as either <strong>Use</strong>rs <strong>of</strong> RRCtechnologies or Non-users. From the lists (630 <strong>Use</strong>r households and 735 Non-userhouseholds) thus generated, twelve users and four non-users were randomlyselected <strong>in</strong> each village for household <strong>in</strong>terviews. In total, 287 <strong>Use</strong>r households (HH)and 96 Non-user HHs were <strong>in</strong>terviewed us<strong>in</strong>g a user- and a non-user questionnaire,respectively.• There were some significant differences between districts <strong>in</strong> HH Poverty Index (PI).On average, HHs <strong>in</strong> Jhapa were relatively less poor than those <strong>in</strong> Kapilvastu andSaptari that were, <strong>in</strong> turn, less poor than those <strong>in</strong> Siraha. Overall, <strong>Use</strong>r HHs weresignificantly less poor (PI=5.84) than Non-user HHs (PI=4.18) although around 99%<strong>of</strong> all HHs sampled had a PI
around 0.05 ha to 0.15 ha. Although yields per unit area were <strong>of</strong>ten reasonable(given the low levels <strong>of</strong> <strong>in</strong>puts used) amounts <strong>of</strong> chickpea grown per HH were small.• Mungbean, particularly cvs Kalyan and Prateeksha, was grown <strong>in</strong> all four districts onsmaller areas still, rang<strong>in</strong>g from 0.03 – 0.14 ha and was particularly popular <strong>in</strong>Siraha.• There was confusion amongst farmers (and enumerators) about what constitutes‘seed prim<strong>in</strong>g’ <strong>in</strong> <strong>rice</strong>; and responses do not differentiate between seed prim<strong>in</strong>g <strong>of</strong>dryland, direct-sown <strong>rice</strong> and <strong>rice</strong> sown <strong>in</strong>to nursery beds prior to transplant<strong>in</strong>g.Similarly <strong>in</strong> legumes seed prim<strong>in</strong>g with water was confused with nutrient prim<strong>in</strong>g <strong>in</strong>which micronutrients such as molybdenum are added to the prim<strong>in</strong>g water.Nevertheless, seed prim<strong>in</strong>g seems to have been adopted, on average, by around50% <strong>of</strong> those HHs <strong>in</strong>itially tra<strong>in</strong>ed to do it, although it was not possible to account forany spontaneous adoption by non-tra<strong>in</strong>ed HHs.• Improved compost<strong>in</strong>g, IPM and IPNM were all quite popular <strong>in</strong> Jhapa but less so <strong>in</strong>the other three districts, the only exception be<strong>in</strong>g IPNM <strong>in</strong> Siraha and, possibly,improved compost<strong>in</strong>g <strong>in</strong> Kapilvastu. These relatively high values for adoption <strong>of</strong> thesethree technologies <strong>in</strong> Jhapa are due to high rates <strong>of</strong> adoption <strong>in</strong> <strong>rice</strong> and <strong>in</strong>mungbean but not <strong>in</strong> chickpea (which is not grown). On average, the rate <strong>of</strong> adoption<strong>of</strong> improved compost<strong>in</strong>g was around 40% <strong>of</strong> those HHs <strong>in</strong>itially tra<strong>in</strong>ed.• Most HHs only received seeds <strong>of</strong> new varieties <strong>in</strong> any reasonable quantity from 2004onwards so adoption or rejection was predom<strong>in</strong>antly based on only 3-4 years <strong>of</strong> selftest<strong>in</strong>g.Seeds <strong>of</strong> new varieties were re-distributed by relatively few HHs, which is notsurpris<strong>in</strong>g given the short timescale.• Averaged over all four districts, <strong>Use</strong>r HHs reported that mean HH food gra<strong>in</strong> selfsufficiencyhad <strong>in</strong>creased from 10.2 months to 13.2 months (29%) s<strong>in</strong>ce projectvarieties had been adopted. It should be noted that the question did not mentionother RRC technologies such as seed prim<strong>in</strong>g, IPM, etc. Reported change wasgreatest <strong>in</strong> Jhapa (63%) where BG1442 was adopted widely on relatively large areas<strong>of</strong> land per HH. In districts where legume adoption was significant (Kapilvastu andSaptari) they were grown on small areas <strong>of</strong> land and contributed less, <strong>in</strong> absoluteterms, to HH food security.• Specific benefits <strong>of</strong> technologies reported by HHs may reflect values imparted dur<strong>in</strong>gtra<strong>in</strong><strong>in</strong>g rather than views formed after adoption and use. For <strong>in</strong>stance, farmers <strong>in</strong>Saptari and Siraha reported the obvious benefits to be expected from seed prim<strong>in</strong>geven though very few actually practiced it. A similar pattern was observed <strong>in</strong> views onimproved compost<strong>in</strong>g, IPM and IPNM.• Averaged over all four districts, the percentage <strong>of</strong> sampled HHs grow<strong>in</strong>g new <strong>rice</strong>varieties, the area grown per HH and the production per HH all <strong>in</strong>creased steadilybetween 2004 and 2008, although the time course <strong>of</strong> adoption varied betweendistricts. The mean production per hectare rema<strong>in</strong>ed relatively constant over thisperiod at between 3 and 4 t ha -1 .• The pattern <strong>of</strong> adoption with time <strong>of</strong> chickpea and mungbean differed from that <strong>of</strong><strong>rice</strong>. Although the proportion <strong>of</strong> HHs <strong>in</strong> Kapilvastu that grew chickpea was high dur<strong>in</strong>gall four years, they did so on small areas <strong>of</strong> land and so production per HH wasrelatively low. In contrast, the proportion <strong>of</strong> chickpea growers <strong>in</strong> Saptari was lower butlarger areas were sown so that production per HH was higher. This was a pattern11
also observed <strong>in</strong> Siraha, albeit with fewer HHs. The number <strong>of</strong> HHs <strong>in</strong> Jhapa decl<strong>in</strong>edsteadily over the four years, down to zero <strong>in</strong> 2008.• The proportion <strong>of</strong> HHs grow<strong>in</strong>g mungbean <strong>in</strong> Jhapa and Kapilvastu rema<strong>in</strong>ed fairlysteady dur<strong>in</strong>g the four years at around 30-40% but land area sown per HH was lowso production per HH was also low. In contrast, adoption by HHs <strong>in</strong> Saptari andSiraha <strong>in</strong>creased steadily over the four years and areas sown were also larger <strong>in</strong>those two districts. S<strong>in</strong>ce production per hectare was also higher, production per HHwas substantially greater than <strong>in</strong> Jhapa and Kapilvastu.• Most gra<strong>in</strong> from new <strong>rice</strong> varieties was sold as gra<strong>in</strong> or eaten by the HHs, withrelatively little sold as seed, fed to animals or given as gifts. Rice seed was saved byvirtually all HHs <strong>in</strong> 2008, around 40 kg per HH on average, which is enough to re-sowthe average land area used for these varities. In contrast, home consumption was themajority use for new chickpea varieties, with less sold as gra<strong>in</strong>. Although most HHssaved seed, particularly <strong>in</strong> Kapilvastu, Saptari and, to a lesser extent, <strong>in</strong> Siraha,amounts saved were small and reflected the low levels <strong>of</strong> production and <strong>of</strong> the smallareas sown. Most HHs <strong>in</strong> all districts ate the new varieties <strong>of</strong> mungbean and savedsome for seed. A large proportion <strong>of</strong> HHs <strong>in</strong> Saptari (56% and 47% <strong>in</strong> the two years)sold gra<strong>in</strong> and a significant m<strong>in</strong>ority <strong>of</strong> HHs <strong>in</strong> Saptari and Siraha sold seed. As forchickpea, the amounts <strong>of</strong> the new mungbean varieties transacted were small.• There was a premium <strong>of</strong> around 100% for <strong>rice</strong> sold as seed over that sold as gra<strong>in</strong>.The unit p<strong>rice</strong> for chickpea gra<strong>in</strong> was much higher than for <strong>rice</strong> but the premium forchickpea sold as seed rather than for gra<strong>in</strong> was smaller, around 40%, than that for<strong>rice</strong>. However, there is already generally a premium for Kabuli (bold-seeded)chickpea over Desi (local) varieties. For mungbean, p<strong>rice</strong>s <strong>of</strong> both gra<strong>in</strong> and seedwere higher than those for chickpea and differed between districts, be<strong>in</strong>g highest <strong>in</strong>Jhapa, although there was actually very little premium for seed over gra<strong>in</strong> <strong>in</strong> anydistrict.• Overall, the two most important problems cited by users <strong>of</strong> the new varieties <strong>of</strong> <strong>rice</strong>,chickpea and mungbean were pests and diseases although it should be noted thatthese are also the most important problems <strong>in</strong> general for these crops irrespective <strong>of</strong>variety. The other important problems cited were lack <strong>of</strong> seed and <strong>in</strong>puts, lack <strong>of</strong>irrigation and theft or damage from stray animals (<strong>in</strong> relation to legumes, particularlymungbean). Inadequate technical know-how was also considered important by users<strong>of</strong> legumes, particularly <strong>in</strong> Saptari and Siraha.Non <strong>Use</strong>rs• The number <strong>of</strong> Non-users sampled <strong>in</strong> each district was not large so disaggregation <strong>of</strong>responses by district may be unreliable. Over all four districts, 68% <strong>of</strong> Non-user HHsknew about short-duration (SD) <strong>rice</strong> varieties but only 38% <strong>of</strong> those (25 HHs) hadgrown them. Of the latter, 88% (22 HHs) cited as a benefit be<strong>in</strong>g able to grow w<strong>in</strong>tercrops (vegetables) <strong>in</strong> time. When asked why they had not then tried any <strong>of</strong> theproject SD <strong>rice</strong> varieties, the most frequently cited reasons were “don’t know aboutthe varieties”, “unavailability <strong>of</strong> seed” and, to a lesser extent “lack <strong>of</strong> technicalknowledge”. The most important reasons for not grow<strong>in</strong>g SD <strong>rice</strong> varieties cited byNon-users who knew about them but had not tried them were “lack <strong>of</strong> irrigation”, “notthe best variety for the land” and “lower yield than exist<strong>in</strong>g variety”. “Lack <strong>of</strong> land” and“not suitable for exist<strong>in</strong>g <strong>cropp<strong>in</strong>g</strong> pattern” were not considered very important.• Almost all Non-user HHs sampled <strong>in</strong> Jhapa, Saptari and Siraha knew about w<strong>in</strong>terseason legumes (WSLs, <strong>in</strong>clud<strong>in</strong>g chickpea) but only around half the sample <strong>in</strong>Kapilvastu knew about them. However, only 9% <strong>of</strong> the knowledgeable HHs (2 HHs)12
<strong>in</strong> Jhapa had actually grown them, <strong>in</strong> contrast with the high proportion <strong>of</strong> HHs <strong>in</strong> theother three Districts who had tried them. Overall, 86% knew about them and, <strong>of</strong>those, 63% (52 HHs) had grown them. The ma<strong>in</strong> reasons cited for not grow<strong>in</strong>gproject WSLs were similar to those cited for not grow<strong>in</strong>g project SD <strong>rice</strong>s, i.e. “don’tknow about the varieties”, “unavailability <strong>of</strong> seed” and “lack <strong>of</strong> technical knowledge”.For those Non-user HHs that were aware <strong>of</strong> WSLs but had not grown any, the mostimportant reason cited was “high moisture” followed by “lack <strong>of</strong> family labour”,although the responses are highly skewed towards those from Jhapa (whereadoption <strong>of</strong> WSLs, i.e. chickpea was very poor). Although the most commonconstra<strong>in</strong>t on grow<strong>in</strong>g chickpea cited by <strong>Use</strong>rs was pests and diseases, Non-usersbarely mentioned it.• Overall, 72% <strong>of</strong> Non-users knew about spr<strong>in</strong>g season legumes (SSLs, <strong>in</strong>clud<strong>in</strong>gmungbean) and, <strong>of</strong> those, only 30% (21 HHs) had grown them. As for the other twocrops, the ma<strong>in</strong> reasons cited for not grow<strong>in</strong>g project SSLs were “don't know aboutthe varieties” followed by “lack <strong>of</strong> seed” and “lack <strong>of</strong> knowledge”. “Lack <strong>of</strong> irrigation”,“lack <strong>of</strong> labour” and “lack <strong>of</strong> seed” were the ma<strong>in</strong> reasons cited by Non-user HHs whoknew about SSLs but had never grown them.• The percentage <strong>of</strong> the Non-users <strong>in</strong>terviewed who <strong>in</strong>tended to grow short duration<strong>rice</strong> was 53%, 29% <strong>of</strong> non-users <strong>in</strong>tended to grow chickpea and 36% <strong>in</strong>tended togrow mungbean, although the question was ambiguous about whether they <strong>in</strong>tendedto grow project varieties or not. Of these, most (61%) <strong>in</strong>tended to use <strong>rice</strong> seedobta<strong>in</strong>ed from neighbours while 31% reported that they would use their own seed.Intend<strong>in</strong>g chickpea growers reported that they would seek seed from a variety <strong>of</strong>sources <strong>in</strong>clud<strong>in</strong>g FORWARD, neighbours, the bazaar, Agrovets or use their ownseed. Almost 70% <strong>of</strong> Non-user HHs <strong>in</strong>tend<strong>in</strong>g to grow mungbean were look<strong>in</strong>g toneighbours to provide seeds.• Of the 45 Non-user HHs who were not <strong>in</strong>tend<strong>in</strong>g to grow SD <strong>rice</strong> <strong>in</strong> 2009, the ma<strong>in</strong>reasons cited were “lack <strong>of</strong> family labour” and “lack <strong>of</strong> land”. These reasons, togetherwith “lack <strong>of</strong> irrigation” were also the ones cited most for not grow<strong>in</strong>g chickpea andmungbean.• Surround<strong>in</strong>g non-project villages were not surveyed and accurate <strong>in</strong>formation on thespread <strong>of</strong> the new varieties elsewhere <strong>in</strong> the districts is not available so it is notpossible to estimate the overall impact <strong>of</strong> the project. We can conclude however that,with<strong>in</strong> the project villages sampled, there has been substantial adoption <strong>of</strong> a range <strong>of</strong>technologies and the farmers report that, s<strong>in</strong>ce those technologies have beenavailable, food gra<strong>in</strong> self sufficiency has improved.13
INTRODUCTIONA study supported by the UK Department for International Development Plant Sciences<strong>Research</strong> Programme (DFID-PSRP) estimated the extent <strong>of</strong> <strong>rice</strong>-<strong>fallows</strong> and their spatialand temporal distribution <strong>in</strong> South Asia by us<strong>in</strong>g geographic <strong>in</strong>formation system (GIS) andsatellite remote sens<strong>in</strong>g techniques. Rice <strong>fallows</strong> are those lands that, although used to grow<strong>rice</strong> dur<strong>in</strong>g the monsoon (kharif) season, are left fallow dur<strong>in</strong>g the follow<strong>in</strong>g post-ra<strong>in</strong>y (<strong>rabi</strong>)season. Based on the satellite image analysis, <strong>rice</strong>-<strong>fallows</strong> <strong>in</strong> <strong>Nepal</strong> were estimated as392,000 ha, and this amounted to 26% <strong>of</strong> the total <strong>rice</strong> area (Subbarao et al. 2001). To try topromote susta<strong>in</strong>able <strong>in</strong>tensification <strong>of</strong> ra<strong>in</strong>fed <strong>rice</strong> <strong>fallows</strong>, the <strong>Ra<strong>in</strong>fed</strong> Rabi Cropp<strong>in</strong>g (RRC)project was conceptualized and a one-year pilot phase was launched <strong>in</strong> October 2001 <strong>in</strong>selected villages <strong>of</strong> four eastern Terai districts from October 2001 to June 2002. Based on<strong>in</strong>formation from 389 households it was found that more than half (58%) <strong>of</strong> the farmlandrema<strong>in</strong>ed fallow after <strong>rice</strong> harvests. The high <strong>in</strong>cidence <strong>of</strong> ra<strong>in</strong>fed <strong>rice</strong> <strong>fallows</strong> <strong>in</strong> the projectdistricts was due to low motivation <strong>of</strong> farmers to take up w<strong>in</strong>ter <strong>cropp<strong>in</strong>g</strong>. Farmers perceivedlow productivity <strong>of</strong> crops and high risk <strong>of</strong> crop failure as a result <strong>of</strong> poor soil fertility, lack <strong>of</strong>dry farm<strong>in</strong>g technologies and lack <strong>of</strong> drought tolerant crops and varieties. Less than 4% <strong>of</strong>the sampled farmland <strong>in</strong> the project districts had irrigation facilities. About two-thirds <strong>of</strong> thefarm households perceived stagnant or decl<strong>in</strong><strong>in</strong>g productivity <strong>of</strong> crops on their farm andthought that external <strong>in</strong>terventions were necessary to enable them to reverse the trend(Khanal et al., 2004).Draw<strong>in</strong>g on the experience <strong>of</strong> the pilot phase and based on improved understand<strong>in</strong>g <strong>of</strong> theconstra<strong>in</strong>ts and opportunities for crop <strong>in</strong>tensification and diversification, the second phase <strong>of</strong>the project (R 8221) was implemented from July 2002 to 2006. In the second phase, theproject aimed to validate suitable agronomic and social activities that were <strong>in</strong>tended tosupport susta<strong>in</strong>able <strong>in</strong>tensification <strong>of</strong> the <strong>rice</strong>-fallow system. The project sought to improvethe overall system by <strong>in</strong>tegrat<strong>in</strong>g short duration <strong>rice</strong> varieties <strong>in</strong>to the ma<strong>in</strong> season to makeeasier the grow<strong>in</strong>g <strong>of</strong> w<strong>in</strong>ter legumes such as lentil and chickpea <strong>in</strong> the residual moisturerema<strong>in</strong><strong>in</strong>g after <strong>rice</strong> harvest. Mungbean, a spr<strong>in</strong>g season crop which can be grown afterw<strong>in</strong>ter legumes, ma<strong>in</strong>ly <strong>in</strong> partially irrigated and irrigated areas, was relatively unknown andwas made available for test<strong>in</strong>g by farmers.In addition to new varieties, the project sought to validate technological and resourcemanagement options and to empower farmers to adopt <strong>in</strong>tegrated pest management (IPM)and Integrated Plant Nutrient System (IPNM) approaches to improve the soil health and to<strong>in</strong>crease productivity. These approaches <strong>in</strong>cluded, among others: farmers’ trials <strong>of</strong> “on-farm”seed prim<strong>in</strong>g (soak<strong>in</strong>g seeds <strong>in</strong> water for pre-determ<strong>in</strong>ed times before sow<strong>in</strong>g); nutrientload<strong>in</strong>g (whereby trace elements such as molybdenum are added to the water used forprim<strong>in</strong>g seeds, particularly <strong>in</strong> the case <strong>of</strong> mungbean and chickpea); soil solarization(sterilization, us<strong>in</strong>g plastic sheet<strong>in</strong>g, <strong>of</strong> the soil <strong>in</strong> <strong>rice</strong> nursery beds before sow<strong>in</strong>g);improvements to animal hous<strong>in</strong>g, <strong>in</strong>clud<strong>in</strong>g designs to facilitate collection <strong>of</strong> cattle ur<strong>in</strong>e, avaluable material; use <strong>of</strong> that ur<strong>in</strong>e for foliar feed<strong>in</strong>g <strong>of</strong> plants and as an <strong>in</strong>secticide; compostmak<strong>in</strong>g; establishment and ma<strong>in</strong>tenance <strong>of</strong> nurseries for multi-purpose tree seedl<strong>in</strong>gs.Parallel activities <strong>in</strong>cluded the development, tra<strong>in</strong><strong>in</strong>g and mobilization <strong>of</strong> Local ResourcePersons (LRPs) and community based seed producer groups (CBSPs). Table 1 summarisesthe chronology <strong>of</strong> major project activities.It is important to note that these were all research activities, funded from a research budget,and widespread dissem<strong>in</strong>ation <strong>of</strong> the technologies was not a stated major objective. Aproject funded by RiUP to scale out the validated outputs <strong>of</strong> this project is currently be<strong>in</strong>gimplemented (2008-2011).14
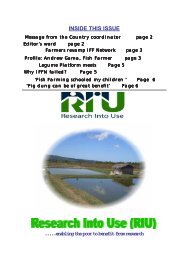
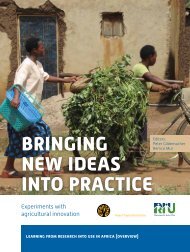
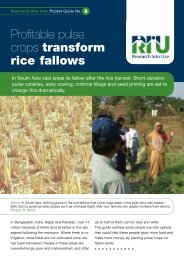
Table 1: Timel<strong>in</strong>e <strong>of</strong> major events <strong>in</strong> PVS, COB, and RRC technologies/approachesProcess Year Event2001-2002ParticipatoryVarietalSelectionRRCtechnologies• One-year RNRRS pilot phase <strong>of</strong> R8221 project on RRC <strong>in</strong>four Terai districts (Kapilvastu, Siraha, Saptari and Jhapa).These districts were selected based on the distribution <strong>of</strong> <strong>rice</strong><strong>fallows</strong> determ<strong>in</strong>ed us<strong>in</strong>g GIS and satellite remote sens<strong>in</strong>g(Subbarao et al., 2001).2002 • Trials <strong>of</strong> seed prim<strong>in</strong>g, nutrient load<strong>in</strong>g,2002- • New varieties <strong>of</strong> <strong>rice</strong>, chickpea, mungbean (from 2003) tested2006 <strong>in</strong> PVS trials2005 • Barkhe 2014 <strong>in</strong> <strong>rice</strong>, Kalyan and Prateeksha <strong>in</strong> Mungbean,and Tara and Avrodhi <strong>in</strong> chickpea identified as the mostpopular varieties with farmers.• Verification and scal<strong>in</strong>g up <strong>of</strong> promis<strong>in</strong>g varieties began onsmall scale2006 • Most promis<strong>in</strong>g two mungbean varieties <strong>of</strong>ficially released byGoN (Kalyan and Prateeksha)2008 • Most promis<strong>in</strong>g two varieties <strong>of</strong> chickpea <strong>of</strong>ficially released byGoN (Tara and Avarodhi)2003 • Trials <strong>of</strong> seed prim<strong>in</strong>g, soil solarisation2004 • Trials <strong>of</strong> seed prim<strong>in</strong>g, nutrient load<strong>in</strong>g, soil solarisation2005- • Trials <strong>of</strong> seed prim<strong>in</strong>g, nutrient load<strong>in</strong>g, soil solarisation,2007 animal shade improvement, use <strong>of</strong> animal ur<strong>in</strong>e <strong>in</strong> plants,establish<strong>in</strong>g multi-purpose nurseries and plantation <strong>of</strong>2008-2011sapl<strong>in</strong>gs/seedl<strong>in</strong>gs• Scal<strong>in</strong>g out RRC technologies to wider communities (newRiUP project)The adoption and impact <strong>of</strong> short duration <strong>rice</strong>, legumes and other crop varieties andagronomic <strong>in</strong>terventions were <strong>in</strong>vestigated <strong>in</strong> four selected districts (Figure 1). The study wasimplemented between June 2008 and February 2009 to assess the impact <strong>of</strong> the <strong>Ra<strong>in</strong>fed</strong>Rabi Cropp<strong>in</strong>g (RRC) activities that were implemented by FORWARD from 2002-2006 withsupport from CAZS-NR and <strong>in</strong> partnership with the Department <strong>of</strong> Agriculture (DoA) and the<strong>Nepal</strong> Agriculture <strong>Research</strong> Council (NARC). This report presents the results from thatstudy.K apilvastuSirhaSaptariJhapaAdoption study <strong>of</strong> RRC technologies• In four districts• Six villages per district:• In each village one GD followed bysurvey <strong>of</strong>:• 12 grower households• 4 non-grower householdsFig. 1. The ma<strong>in</strong> activities and their locations <strong>in</strong> the two studies. GD = Group discussion.15
METHODOLOGYA comb<strong>in</strong>ation <strong>of</strong> methods (structured and semi-structured) was used to triangulate the<strong>in</strong>formation and make the study robust and more reliable. Details <strong>of</strong> the methods used aresummarized <strong>in</strong> Table 2.Table 2: Summary <strong>of</strong> survey methods usedSurvey Method To measure Who doesit?1. Select at random 6 (i) Adoption FORWARDvillages per district levelsfrom the list <strong>of</strong> those<strong>in</strong>volved with the (ii)Benefitsproject.2. Village-level groupdiscussions to compilea list <strong>of</strong> all <strong>Use</strong>rs andNon-<strong>Use</strong>rs <strong>in</strong> thevillage. <strong>Use</strong>rs def<strong>in</strong>edas householdsgrow<strong>in</strong>g at least one <strong>of</strong>the new varieties.3. Select randomly 12farmers per villagefrom the household listand adm<strong>in</strong>ister thequestionnaire <strong>in</strong>Annex 1.4. In-depth semistructured,survey <strong>of</strong>:(a) <strong>in</strong>dividual (♀ &♂)receivers/adopters(b) <strong>in</strong>dividual nonusers,esp.landlesslabourers(c) focus groups(i) Adoptionlevels(ii)Benefits(i) Adoptionlevels(ii)BenefitsIMPACTInclud<strong>in</strong>g relatedemerg<strong>in</strong>g issues,e.g. impact onlandless livestockgrazers,organisation <strong>of</strong>social fenc<strong>in</strong>gFORWARDFORWARDIndependentOnly results from methods 1-3 are presented <strong>in</strong> this report.Where? **Selectedvillages <strong>of</strong> ;JhapaSaptariSirahaKapilvastuSelectedvillages <strong>of</strong> ;JhapaSaptariSirahaKapilvastuSelectedvillages <strong>of</strong> ;JhapaSaptariSirahaKapilvastuSample <strong>of</strong>projectvillagescovered bymethod 1Numbers willdepend onresults <strong>of</strong> 1& degree <strong>of</strong>variability<strong>in</strong>dicatedWhatvillages?Recipientvillages:2004/5Recipientvillages:2004/5Recipientvillages:2004/5To bedeterm<strong>in</strong>edStructured studyThe structured study was done <strong>in</strong> all four project districts <strong>in</strong> which project activities (Table 3)were implemented dur<strong>in</strong>g the RNRRS project. Six project villages from each district that hadbeen <strong>in</strong>volved with project activities s<strong>in</strong>ce 2004 were randomly selected for the study.Altogether 24 group discussions (GD) were conducted with 15-20 participants <strong>in</strong> each GD toidentify all the <strong>Use</strong>r- and the Non-user households <strong>in</strong> a village. The criterion for classify<strong>in</strong>g ahousehold as a <strong>Use</strong>r was that they were grow<strong>in</strong>g at least one <strong>of</strong> the varieties <strong>in</strong>troduced bythe project. From the list <strong>of</strong> users and non-users, twelve users and four non-users per villagewere randomly selected to be <strong>in</strong>terviewed us<strong>in</strong>g the questionnaires <strong>in</strong> Annexes 1 (for users)and 2 (for non-users). In two villages (Bhotiya Tole and Laxmaniya <strong>of</strong> Padariya VDC) <strong>of</strong>16
Siraha district, the number <strong>of</strong> users for the study was <strong>in</strong>sufficient so these villages weredisregarded and the number <strong>of</strong> respondents (users and non-users) that needed to becovered <strong>in</strong> lieu <strong>of</strong> those villages was covered by <strong>in</strong>creas<strong>in</strong>g the number <strong>of</strong> respondents fromother districts (Jhapa, Saptari and Kapilvastu). In total, 287 users and 96 non-users were<strong>in</strong>terviewed (Table 4).Table 3: Various crop varieties and technologies promoted <strong>in</strong> RRC and total number <strong>of</strong>farmers and quantity <strong>of</strong> seeds/<strong>in</strong>puts used <strong>in</strong> RRC projects <strong>in</strong> Siraha, Saptari, Kapilvastu andJhapa districts 2001 to 2006.Crop/approach Varieties No <strong>of</strong> farmers Amount <strong>of</strong> seed (kg)Barkhe 1027 455 3000RiceBarkhe 2001 125 225Barkhe 2014 100 200Sugandha 1 700 2500Ashoka 228 20 50PR 101 350 800BG 1442 890 2450KPG 59 350 650ChickpeaAvarodhi 630 1200Tara 650 1365ICCV 2 158 105KAK 2 160 365Kalyan 1200 2886Pratiksha 1425 3210MungbeanNM 92 400 850VC 3960 350 600IPM 981IPNM, <strong>of</strong> which:981Technologyseed prim<strong>in</strong>g (455) (<strong>in</strong> 41 villages)improved compost<strong>in</strong>g (526)Multipurpose nursery 120ApproachLRP 32CBSP 110Total 10187 20456Field staff were tra<strong>in</strong>ed to adm<strong>in</strong>ister the survey questionnaires (Annexes 1 and 2) and theywere pre-tested with 15 farmers each from Badahara and Purena VDCs <strong>in</strong> Kapilvastu districtto check for relevancy, consistency, measurement errors, ambiguities, and miss<strong>in</strong>g<strong>in</strong>formation. Based on the feedback from pre-test<strong>in</strong>g, necessary corrections were made <strong>in</strong>the questionnaire.Generally, the questionnaires were adm<strong>in</strong>istered with the head <strong>of</strong> each householdirrespective <strong>of</strong> their sex. If a randomly selected HH was not available for <strong>in</strong>terview, wereplaced it with new HHs taken randomly from the GD list. Households were revisited, ifnecessary, to collect any miss<strong>in</strong>g <strong>in</strong>formation, correct <strong>in</strong>consistencies and clarify<strong>in</strong>appropriate responses.17
Table 4: The villages <strong>in</strong> which the <strong>in</strong>terviews took place and the number <strong>of</strong> farmers that were<strong>in</strong>terviewed (users and non users) by district and village <strong>in</strong> 2008District Village <strong>Use</strong>rs Non <strong>Use</strong>rs TotalKapilvastu Badehara A 12 5 17Badehara B 7 5 12Pur<strong>in</strong>ea 13 5 19Mahendrakot (Valali) 13 4 17Gajeda (Kubarpur) 14 4 18Motipur (Laga<strong>in</strong>) 14 3 16District total 73 26 99Siraha Bishanpur 12 5 17Bakhar 14 5 19Padariya 13 5 18Ghaletole 12 4 16District total 51 19 70Saptari Madhupatti 12 5 17Kadmaha 15 4 19Shreepur 13 4 17Kadorbana 12 5 17Mahuliya 14 5 19Karmonia 14 4 18District total 80 27 107Jhapa Thakthake A 13 4 17Thakthake B 16 4 20Pragati tole 13 5 18Jambadi A 15 4 19Jambadi B 10 3 13S<strong>in</strong>ghadevi 16 4 20District total 83 24 107Grand Total across districts 287 96 383Poverty <strong>in</strong>dexA poverty <strong>in</strong>dex was constructed to enable the study to dist<strong>in</strong>guish between poor andwealthier households among those households surveyed. The poverty <strong>in</strong>dex did not attemptto place households <strong>in</strong> relation to the poverty l<strong>in</strong>e established by the government <strong>of</strong> <strong>Nepal</strong> asthe data demands for such an exercise were too big.There were six <strong>in</strong>dicators selected for the poverty <strong>in</strong>dex, each <strong>of</strong> which was given a set <strong>of</strong>possible scores (Table 5).A total score (overall poverty <strong>in</strong>dex), for which the maximumpossible was 23, was calculated for each household derived from the sum <strong>of</strong> the <strong>in</strong>dividualscores.18
Table 5: Scores for the poverty <strong>in</strong>dicatorsScoreIndicator -1 0 1 2 3 4 5 6Livestock
RESULTSCharacteristics <strong>of</strong> users and non usersOf the 287 user households surveyed, 253 (88%) were male-headed whereas 90 (94%) <strong>of</strong>the 96 non-user households surveyed were male-headed. Gender <strong>of</strong> the respondent wasdeterm<strong>in</strong>ed by who was available at the time <strong>of</strong> survey; 109 (38%) <strong>of</strong> the respondents <strong>in</strong> userhouseholds were women and 37 (39%) <strong>of</strong> the respondents <strong>in</strong> non-user households.Tractor ownership was rare and did not differ between users and non-users (Table 6). <strong>Use</strong> <strong>of</strong>rented tractors was similar for each category at 32-35% but use <strong>of</strong> their own animals fortraction was more common (74%) by users than by non-users (51%) who were moredependent on rented animals (25% versus 16%).Table 6: Type <strong>of</strong> traction usedType <strong>of</strong> traction<strong>Use</strong>rs (n=287)Non-users (n=96)Number Percent Number PercentOwn animal 212 74 49 51Rented animal 47 16 24 25Own tractor 3 1 2 2Rented tractor 99 35 31 32Labour exchange 2 1 5 5Total* 363 (287) 127 (100) 111 (96) 115 (100)*Totals do not sum as expected because <strong>of</strong> citation <strong>of</strong> more than one type <strong>of</strong> traction. Numbers <strong>in</strong> parenthesesare expected totals <strong>in</strong> the absence <strong>of</strong> multiple responses.There was a tendency for user households to be more likely to own rum<strong>in</strong>ant livestock,particularly large rum<strong>in</strong>ants, although a higher proportion <strong>of</strong> non-user HHs owned poultry(Table 7). There were no user/non-user differences between HHs who did own any particulartype <strong>of</strong> animal, except for poultry where non-user HHs owned more <strong>of</strong> them than user HHs.It is possible that poultry ownership requires less capital and <strong>in</strong>frastructure than for othercategories <strong>of</strong> livestock and so there might be a l<strong>in</strong>k to HH poverty status (see later).Table 7: Household livestock ownership (users, n=287; non-users, n=96).HHs own<strong>in</strong>g livestock Mean no. per own<strong>in</strong>gAnimal(%)HHMean no. per all HHs<strong>Use</strong>r Non-user <strong>Use</strong>r Non-user <strong>Use</strong>r Non-userCow 45 40 1.65 1.68 0.73 0.67Ox 70 50 2.19 2.22 1.54 1.06Buffalo (m) 8 1 1.74 2.17 0.14 0.14Buffalo (f) 45 30 1.79 1.59 0.81 0.48Goat 82 77 3.41 3.53 2.81 2.72Pig
Table 8: Ethnic group <strong>of</strong> households surveyedEthnicity<strong>Use</strong>rs (n=287)Non-users (n=96)Number Percent Number PercentDalit 24 8.4 10 10.4Janjati 15 5.2 13 13.5Terai group 103 35.9 36 37.5Brahm<strong>in</strong>/Chhetri 145 50.5 37 38.5<strong>Use</strong>r households were significantly larger (6.5 adult equivalents) than non-user households(5.7 adult equivalents). A slightly higher percentage <strong>of</strong> user households had male memberswith full-time jobs although the mean number per household <strong>of</strong> male full-time jobholders wasthe same for user and non-user households (Table 9). Almost all user households hadwomen who work on the farm and, <strong>in</strong> those households where women did so, the meannumber <strong>of</strong> farm-work<strong>in</strong>g women was slightly higher (1.81) <strong>in</strong> user households than <strong>in</strong> nonuserhouseholds (1.69).Table 9: Male and female work patterns<strong>Use</strong>rs (n=287)Non-users (n=96)Percent <strong>of</strong> HHs No. per HH Percent <strong>of</strong> HHs No. per HHFull time jobM 35 1.23 27 1.23F 4 1.30 5 1.20Work on farmM 87 1.54 78 1.53F 97 1.81 88 1.69Note: number per HH is calculated for only those HHs that had jobholders.<strong>Use</strong>r households both owned and cultivated more upland and medium land than non-userhouseholds, although non-users owned and cultivated slightly more low land (Table 10).However, the greatest proportion <strong>of</strong> household land was medium land so users owned 51%more total land and cultivated 60% more total land than non-users. <strong>Use</strong>rs also had morethan twice as much irrigated land. Both users (34%) and non-users (38%) transferred <strong>in</strong>similar proportions <strong>of</strong> the land they cultivated whereas non-users transferred out about twiceas much land (23%) as users (13%) when expressed as a proportion <strong>of</strong> the land theyeventually cultivated. Giv<strong>in</strong>g land out for share <strong>cropp<strong>in</strong>g</strong> was much more common thanrent<strong>in</strong>g or mortgag<strong>in</strong>g.Table 10: Land ownership and use <strong>in</strong> kattha (30 kattha = 1 hectare). U = user household;NU = non-user householdUpland Medium land Low land TotalU NU U NU U NU U NUTotal owned 6.78 4.10 22.69 13.52 2.11 3.24 31.58 20.85Total cultivated 3.60 1.79 19.61 11.20 1.71 2.55 24.92 15.55Own irrig. cultivated 1.62 1.05 8.01 2.69 0.85 0.82 10.49 4.56Rented out 0 0 0.14 0.21 0.07 0 0.20 0.21Shared out 0.38 0.79 2.21 1.89 0.33 0.48 2.92 3.16Mortgaged out 0.07 0 0.14 0 0 0.21 0.21 0.21Rented <strong>in</strong> 0.18 0.18 1.49 0.83 0.32 0.65 1.99 1.66Shared <strong>in</strong> 1.54 0.19 3.45 3.94 1.21 0.23 6.18 4.25Mortgaged <strong>in</strong> 0 0.05 0.22 0 0 0 0.22 0.0521
Twenty-five percent <strong>of</strong> user households reported that members had migrated <strong>in</strong> 2007-2008whereas only 15% <strong>of</strong> non-user households reported migration (Table 11). This trend wasconsistent for all Districts except Saptari where a higher proportion (26%) <strong>of</strong> non-usersreported migration versus only 9% <strong>of</strong> users. No-one migrated from non-user HHs <strong>in</strong>Kapilvastu.Table 11: Percent <strong>of</strong> Households with members who migrated <strong>in</strong> 2007-2008Households with membermigrat<strong>in</strong>gJhapa Kapilvastu Saptari Siraha OverallA. Non-usersTotal (%) 21 0 26 11 15Unskilled (%) 4 0 26 0 8Semi-skilled (%) 13 0 0 11 5Skilled (%) 4 0 0 0 1No. <strong>of</strong> HH sampled 24 26 27 19 96B. <strong>Use</strong>rsTotal (%) 41 30 9 18 25Unskilled (%) 23 14 6 10 14Semi-skilled (%) 13 5 3 6 7Skilled (%) 11 11 0 6 7No. <strong>of</strong> HH sampled 83 73 80 51 287Table 12: Mean poverty <strong>in</strong>dex by District (comb<strong>in</strong>ed users and non-users)Jhapa Kapilvastu Saptari SirahaMean Poverty Index 5.91 4.83 4.95 4.37(SE mean) (0.27) (0.27) (0.26) (0.32)There were statistically significant differences (P=0.002) <strong>in</strong> Poverty Index (PI) betweenDistricts. Households <strong>in</strong> Jhapa were better <strong>of</strong>f than those <strong>in</strong> Kapilvastu and Saptari thatwere, <strong>in</strong> turn, better <strong>of</strong>f than those <strong>in</strong> Siraha (Table 12). Comb<strong>in</strong>ed over all Districts, nonuserswere significantly (Table 13, P
Table 14: Mean components <strong>of</strong> Poverty Index by DistrictDistrictProdn.(kg)percapitaJobholders perHHOwntractor(perHH)Unskilledmigrants(per HH)Livestockunits (perHH)Thatchro<strong>of</strong>(%)Tiles/sheetro<strong>of</strong> (%)Concretero<strong>of</strong> (%)Jhapa 939 0.64 0.02 0.14 3.46 37 61 3Kapilvastu 299 0.66 0.03 0.07 2.53 13 40 47Saptari 597 0.15 0 0.16 3.22 12 74 14Siraha 419 0.33 0.01 0.05 3.15 10 84 6Sig. *** *** ns ns * *** *** ***<strong>Use</strong>rs produced significantly more food per capita (80% more) than non-users, owned 30%more livestock units and were less likely to have a thatched ro<strong>of</strong> (Table 15). Othercomponents <strong>of</strong> the Poverty Index did not differ between users and non-users.Table 15: Mean components <strong>of</strong> Poverty Index by <strong>Use</strong>r/Non-userProdn.(kg)percapitaJob holdersper HHOwntractor(perHH)Unskilledmigrants(per HH)Livestockunits (perHH)Thatchro<strong>of</strong>(%)Tiles/sheetro<strong>of</strong> (%)Concretero<strong>of</strong> (%)<strong>Use</strong>r/Nonuser<strong>Use</strong>r 726 0.49 0.01 0.13 3.51 13 67 19Nonuser401 0.39 0.02 0.08 2.67 23 62 16Sig. *** ns ns ns *** * Ns nsThere were statistically significant <strong>in</strong>teractions between District and <strong>Use</strong>r/Non-user only forproduction per capita and for the number <strong>of</strong> unskilled migrants per HH (Table 16). Whereasproduction per capita was greater for users than for non-users <strong>in</strong> Jhapa, Siraha and Saptari,there was no difference <strong>in</strong> Kapilvastu. In Saptari, more non-user HHs had unskilled migrantsthan did user HHs, whereas the reverse was true <strong>in</strong> the other three Districts. The reason forthese differences between Districts is not known.Table 16: Mean components <strong>of</strong> Poverty Index by District and by <strong>Use</strong>r/Non-userDistrictProdn.(kg)percapitaJobholdersper HHOwntractor(perHH)Unskilledmigrants(per HH)Livestockunits (perHH)Thatchro<strong>of</strong>(%)Tiles/sheetro<strong>of</strong>(%)Concretero<strong>of</strong> (%)Jhapa U 1332 0.69 0 0.23 4.02 28 71 1NU 545 0.58 0.04 0.04 2.91 46 50 4Kapilvastu U 296 0.66 0.03 0.14 2.71 7 37 56NU 301 0.65 0.04 0 2.34 19 42 38Saptari U 766 0.23 0 0.06 3.72 9 77 14NU 428 0.07 0 0.26 2.73 15 70 15Siraha U 509 0.39 0.02 0.10 3.58 10 84 6NU 328 0.26 0 0 2.72 11 84 5Sig. <strong>of</strong><strong>in</strong>teraction* ns ns ** ns Ns ns ns23
Pattern <strong>of</strong> adoption <strong>of</strong> varieties and RRC technologiesDur<strong>in</strong>g the Focus Group Discussions (FGDs), a total <strong>of</strong> 1365 households were identified aseither users (630) or non-users (735) on the basis <strong>of</strong> whether or not they grew at least one <strong>of</strong>the new <strong>rice</strong>, chickpea or mungbean varieties that had been promoted by the project. Fromwith<strong>in</strong> the 630 households identified as users, 287 were sampled us<strong>in</strong>g the userquestionnaire while 96 were randomly sampled from the 735 non-users us<strong>in</strong>g the non-userquestionnaire. Table 17 shows the percentage <strong>of</strong> the 630 users who were reported <strong>in</strong> theFGDs as grow<strong>in</strong>g a particular variety <strong>in</strong> the four districts, together with the percentage <strong>of</strong> the287 sampled users who reported grow<strong>in</strong>g the same varieties.Table 17: Comparison <strong>of</strong> use levels (%) <strong>of</strong> varieties as determ<strong>in</strong>ed by GD and by householdsurvey (HS).RiceBarkhe1027Barkhe2001BarkheJhapa K’bastu Saptari Siraha TotalGD HS GD Survey GD Survey GD Survey GD Survey000108978720140045213Sugandha 1 0 0 0 3 4 11 1 0 2 4Ashoka 0 0 9 4 3 0 0 0 2 1PR 101 2 0 2 3 1 0 1 0 1 1BG 1442 95 99 16 16 30 11 16 4 48 37ChickpeaKPG 59 0 0 4 0 8 11 3 0 4 3Avarodhi 0 0 7 32 12 24 19 6 8 16Tara 0 0 21 27 9 15 3 2 7 11ICCV 2 0 0 0 1 1 0 0 0 0 0KAK 2 0 0 0 0 2 4 4 2 2 1Mung beanKalyan 24 28 7 11 7 13 81 71 23 27Pratiksha 3 11 15 10 26 28 16 27 15 18NM 92 0 1 8 4 1 4 0 0 2 2VC 3960 0 0 11 7 1 1 1 0 2 2Totalfarmers6665218 83 100 73 223 80 89 51 630 287101100400432555The data <strong>in</strong> Table 17 are compared <strong>in</strong> graphical form <strong>in</strong> Fig 2 and it is clear that the level <strong>of</strong>adoption with<strong>in</strong> a village <strong>of</strong> varieties that are relatively rare was underestimated by GDwhereas more popular varieties were overestimated. This throws <strong>in</strong>to question the accuracy<strong>of</strong> results from group discussions, particularly those at which the entire village is notrepresented. It also suggests that group discussions are particularly poor for estimat<strong>in</strong>g theearly adoption <strong>of</strong> new varieties when they are likely to occur at a low frequency <strong>in</strong> a village.24
Figure 2. Comparison <strong>of</strong> adoption <strong>of</strong> new varieties accord<strong>in</strong>g to the FGDs and the data fromthe questionnaires6050Adoption (%)40302010FGDSurvey0Barkhe 1027Barkhe 2001Barkhe 2014Sugandha 1AshokaPR 101Hard<strong>in</strong>ath 1KPG 59AvarodhiTaraICCV 2KAK 2KalyanPratikshaNM 92VC 3960Variety<strong>Use</strong>rs were def<strong>in</strong>ed dur<strong>in</strong>g the GD as those households that were grow<strong>in</strong>g at least one newvariety promoted by the project. Analysis <strong>of</strong> the responses from the questionnaires suggestsa m<strong>in</strong>or anomaly <strong>in</strong> that only 97% <strong>of</strong> the households <strong>in</strong> Kapilvastu had actually adopted anynew varieties (Table 18). Most (<strong>in</strong> Jhapa and Saptari) and all (<strong>in</strong> Kapilvastu and Siraha)variety users were also users <strong>of</strong> some other RRC technologies (seed prim<strong>in</strong>g, improvedcompost<strong>in</strong>g, IPM or IPNM).Table 18: Adoption by variety or technology <strong>of</strong> 287 surveyed farmers (%)HouseholdsDistrictJhapa Kapilvastu Saptari Siraha Total<strong>Use</strong>rs (by FGD def<strong>in</strong>ition) 100 100 100 100 100Variety user 100 97 100 100 99Technology users 98 100 86 100 95COB <strong>rice</strong> user 2 18 63 2 23PVS <strong>rice</strong> user 100 18 11 4 37Total Number <strong>of</strong> HH 83 73 80 51 287New <strong>rice</strong> varieties were grown on an average <strong>of</strong> 0.1 to 0.23 ha (9% to 24% <strong>of</strong> HH land)except for Barkhe 2014 <strong>in</strong> Saptari where 36 households (50% <strong>of</strong> the sample) grew it on anaverage <strong>of</strong> 0.47 ha which was 43% <strong>of</strong> their land Tables (19 and 20). The other major <strong>rice</strong>success story was that <strong>of</strong> BG 1442 <strong>in</strong> Jhapa where 82 households (99% <strong>of</strong> the householdssampled) grew BG 1442 as a spr<strong>in</strong>g (Chaite) crop on an average <strong>of</strong> 0.46 ha.In Siraha, adoption <strong>of</strong> PVS <strong>rice</strong> varieties was low (only 4%) because the RRC project mostlypromoted short duration varieties which were unsuitable for the project villages. Adoption <strong>of</strong><strong>rice</strong> varieties bred from COB was highest <strong>in</strong> Saptari (63%) which was ma<strong>in</strong>ly due to the rapiduptake <strong>of</strong> Barkhe 2014 that was particularly preferred as a very good replacement forKanchhi Masuli, the most popular local variety. Adoption <strong>of</strong> COB varieties (short to medium25
duration) was lowest <strong>in</strong> Jhapa and Siraha (2%) where medium- to longer duration varietiesare preferred.Chickpea varieties were not adopted at all <strong>in</strong> Jhapa as soils there are generally deficient <strong>in</strong>boron which results <strong>in</strong> poor- or no pod set <strong>in</strong> chickpea. Chickpea is also particularlysusceptible to fungal diseases, particularly Botrytis Grey Mould, <strong>in</strong> Jhapa. In contrast, <strong>in</strong>Kapilvastu and Saptari, groundnut cvs Awarodhi and Tara were grown by appreciablenumbers <strong>of</strong> households (Table 20) on mean amounts <strong>of</strong> land rang<strong>in</strong>g from 0.05 ha to 0.15 ha(Table 19). The smaller (relative to <strong>rice</strong>) areas <strong>of</strong> land used for chickpea reflect the lesseravailability <strong>of</strong> medium land suitable for chickpea and may also be a consequence <strong>of</strong> thesmaller amounts <strong>of</strong> chickpea seed circulat<strong>in</strong>g <strong>in</strong> the villages.Mungbean, particularly Kalyan and Prateeksha, was grown <strong>in</strong> all four Districts on smallerareas still, rang<strong>in</strong>g from 0.03 – 0.14 ha. These mungbean varieties were particularly popular<strong>in</strong> Siraha (Tables 19 and 20). On the whole, reported yield levels for all crops were similar tothose reported from previous Mother and Baby trials exercises <strong>in</strong> the Districts.Table 19: Area <strong>of</strong> adoption <strong>of</strong> varieties <strong>of</strong> <strong>rice</strong>, chickpea and mungbean among the 287surveyed user HHs <strong>in</strong> hectares and as a percentage <strong>of</strong> the total cultivated landJhapa Kapilvastu Saptari Siraha All(ha) (%) (ha) (%) (ha) (%) (ha) (%) (ha) (%) NRiceBarkhe1027 0.50 100 0.24 25 0.19 9 0.23 14 15Barkhe2001 0.14 20 0.26 25 0.22 24 14Barkhe2014 0.47 43 0.17 33 0.46 43 37Sugandha1 0.07 8 0.17 10 0 0.15 9 11BG 1442ma<strong>in</strong> 0.42 17 0.05 14 0.08 4 0.22 23 0.11 9 25BG 1442spr<strong>in</strong>g 0.46 43 0.46 43 82ChickpeaKPG 59 0.14 10 0.14 10 9Awarodhi 0.07 10 0.15 7 0.07 9 0.11 8 45Tara 0.05 11 0.11 6 0.17 33 0.07 8 33KAK 2 0.08 3 0.02 3 0.07 3 4MungbeanKalyan 0.04 3 0.05 7 0.13 15 0.14 12 0.10 9 77Prateeksha 0.04 5 0.04 10 0.12 9 0.12 9 0.09 9 52NM 92 0.03 1 0.03 20 0.09 5 0.06 4 7VC 3960 0.03 8 0.10 6 0.04 7 626
Table 20: Number <strong>of</strong> observations on which the areas are based (<strong>in</strong> Table 19) among the287 surveyed user HHs, plus mean yield.Jhapa(no)Kapilvastu(no)Saptari(no)Siraha(no)All(no)Mean yield(t ha -1 )Barkhe 1027 1 6 8 15 3.14Barkhe 2001 5 9 14 3.70Barkhe 2014 36 1 37 3.47Sugandha 1 2 9 11 3.47BG 1442 ma<strong>in</strong> 2 12 9 2 25 4.52BG 1442 spr<strong>in</strong>g 82 82 4.55KPG 59 9 9 0.78Awarodhi 23 19 3 45 0.51Tara 20 12 1 33 0.57KAK 2 3 1 4 0.41Kalyan 23 8 10 36 77 0.39Prateeksha 9 7 22 14 52 0.46NM 92 1 3 3 7 0.47VC 3960 5 1 6 0.48Source <strong>of</strong> seed <strong>of</strong> new varietiesNone <strong>of</strong> the HHs obta<strong>in</strong>ed any seed <strong>of</strong> the new COB <strong>rice</strong> and Mungbean varieties from theproject (the only source <strong>of</strong> seed at the time) before 2002 and most HHs obta<strong>in</strong>ed seeds <strong>of</strong>new varieties <strong>in</strong> any reasonable quantity only from 2004 onwards (Table 21), so adoption orrejection were predom<strong>in</strong>antly based on only 3-4 years <strong>of</strong> self-test<strong>in</strong>g, although HHs mayhave been exposed previously to the new varieties if grown by neighbours, etc. Very few <strong>of</strong>the HHs received new seeds for the first time <strong>in</strong> 2007, apart from 22 HHs who took upHard<strong>in</strong>ath 1 (BG1442) for the first time.Table 21: Number <strong>of</strong> HHs obta<strong>in</strong><strong>in</strong>g seed <strong>of</strong> project varieties for the first time <strong>in</strong> anyparticular year2002 2003 2004 2005 2006 2007 TotalChickpeaKPG 59 1 2 15 7 1 1 27Awarodhi 13 9 11 11 6 0 50Tara 20 10 9 13 6 0 58ICCV 2 0 3 6 5 0 0 14KAK 2 2 3 5 4 1 0 15MungbeanKalyan 6 4 14 30 40 0 94Prateeksha 17 8 8 17 22 0 72MN 92 6 6 1 2 1 0 16VC 3960 1 1 1 2 2 0 7RiceBarkhe 1027 0 6 1 2 8 0 17Barkhe 2001 3 1 2 5 4 2 17Barkhe 2014 3 0 6 21 11 1 42Barkhe 3004 0 1 0 1 0 0 2Sughanda 1 5 3 10 11 3 0 32PR 101 9 4 10 7 2 0 32Hard<strong>in</strong>ath 1 0 2 10 40 25 22 99Ashoka 1 3 2 4 0 1 11Total 87 66 111 182 132 27 60527
Analysis <strong>of</strong> the orig<strong>in</strong>al source <strong>of</strong> seed <strong>of</strong> two <strong>rice</strong> varieties and one mungbean varietysuggests that, for <strong>rice</strong>, neighbours – farmer-to-farmer spread – are the ma<strong>in</strong> source while formungbean it is FORWARD (Tables 22-24). The small numbers <strong>of</strong> non-users who reportedreceiv<strong>in</strong>g seed are probably dis-adopters. Any impact follow<strong>in</strong>g adoption <strong>of</strong> these varietiescan be safely attributed to the project as, apart from neighbours, there is no major source <strong>of</strong>seed other than FORWARD.Table 22: Orig<strong>in</strong>al source <strong>of</strong> seed <strong>of</strong> Barkhe 2014 <strong>rice</strong>SourceNonuser<strong>Use</strong>rTotalFORWARD 6 10 16Neighbour 26 26Not received 244 1 245Grand Total 250 37 287Table 23: Orig<strong>in</strong>al source <strong>of</strong> seed <strong>of</strong> BG 1442 <strong>rice</strong>SourceNonuser<strong>Use</strong>rTotalAGROVET 1 1FORWARD 3 56 59Govt Farm 2 2Neighbour 1 47 48Not received 177 177Grand Total 181 106 287Table 24: Orig<strong>in</strong>al source <strong>of</strong> seed <strong>of</strong> Kalyan mungbeanSourceNonuser<strong>Use</strong>rTotalBazaar 1 1FORWARD 17 61 78Neighbour 4 11 15Not received 189 4 193Grand Total 210 77 287Pattern <strong>of</strong> adoption <strong>of</strong> new crop varieties with timeRiceOverall, the percentage <strong>of</strong> user HHs (as def<strong>in</strong>ed <strong>in</strong> 2008) that grew one or more <strong>of</strong> the new<strong>rice</strong> varieties <strong>in</strong>creased steadily from 2004-2005 (Fig. 3A). However, this was mostly due tosteady <strong>in</strong>creases with time <strong>in</strong> Jhapa (where there was 100% adoption <strong>in</strong> 2007-08) and <strong>in</strong>Saptari. Adoption <strong>in</strong> Kapilvastu was moderate, at around 40%, over all four years, whereasadoption <strong>in</strong> Siraha was very low. Area grown per HH mostly followed the same pattern (Fig.3B), reach<strong>in</strong>g around 0.5 ha <strong>in</strong> Jhapa by 2007-08, 0.45 ha <strong>in</strong> Saptari and 0.15 <strong>in</strong> Kapilvastu.In Siraha, however, although only a small proportion <strong>of</strong> households grew them, they did soon a reasonably large area <strong>of</strong> 0.25 ha compared, for <strong>in</strong>stance with those HHs <strong>in</strong> Kapilvastu.Production per HH followed closely the area grown (Fig. 3C) as the yield per hectare, as28
ecalled by farmers, (Fig. 3D) was quite constant with<strong>in</strong> each District (apart from unusuallyhigh yields <strong>in</strong> Siraha <strong>in</strong> 2005-06)over the four years, averag<strong>in</strong>g around 4 t ha -1 <strong>in</strong> Jhapa andKapilvastu and around 3.5 t ha -1 <strong>in</strong> Saptari and Siraha.Figure 3. New <strong>rice</strong> varieties from 04-05 to 07-08A. Percent <strong>of</strong> HHs grow<strong>in</strong>gPercent <strong>of</strong> HHs grow<strong>in</strong>g120100806040200Jhapa Kapilvastu Saptari Siraha Grand TotalDistrict04-0505-0606-0707-08B. Area grown per HH0.600.50Area (ha) per HH0.400.300.200.1004-0505-0606-0707-080.00Jhapa Kapilvastu Saptari Siraha Grand TotalDistrictC. Production per HH2500Production (kg) per HH20001500100050004-0505-0606-0707-080Jhapa Kapilvastu Saptari Siraha Grand TotalDistrictD. Production per hectare6000Production (kg) per ha5000400030002000100004-0505-0606-0707-080Jhapa Kapilvastu Saptari Siraha Grand TotalDistrict29
ChickpeaThere were large contrasts between Districts <strong>in</strong> the uptake <strong>of</strong> new chickpea varieties (Fig.4A). In Kapilvastu, adoption was over 60% <strong>in</strong> all four years whereas adoption <strong>in</strong> Saptari<strong>in</strong>creased over the four years to reach around 45% <strong>in</strong> 2007-08. Adoption <strong>in</strong> Jhapa, however,decl<strong>in</strong>ed steadily from a small <strong>in</strong>itial number <strong>of</strong> HHs and, by 2007-08, was zero. The<strong>in</strong>cidence <strong>of</strong> <strong>in</strong>sect pests such as pod borer was similar <strong>in</strong> all the four districts, whereasBotrytis Gray Mould was higher <strong>in</strong> Jhapa. In addition, Jhapa is particularly unsuitable forsuccessful chickpea cultivation because <strong>of</strong> soil boron deficiency that results <strong>in</strong> poor- or nopod set. In Jhapa, once farmers had access to seeds <strong>of</strong> BG 1442 and irrigation, most startedgrow<strong>in</strong>g Chaite <strong>rice</strong> (their seasons overlap considerably) and did not bother about chickpeawhich was not pr<strong>of</strong>itable. In Siraha, adoption never rose above 15% <strong>of</strong> <strong>Use</strong>r HHs. Thereason for this low adoption is not known.Chickpea was grown on much smaller areas than <strong>rice</strong>. Overall, mean areas grown over thefour years were <strong>in</strong> the range 0.08 to 0.1 hectares but there were large differences betweenDistricts (Fig. 4B). In Jhapa, where chickpea was the least popular, when it was growndur<strong>in</strong>g the first three years it was only grown on around 0.02 ha per HH. In Kapilvastu, wherethe highest percentage <strong>of</strong> HHs grew chickpea, it was grown on a relatively constant area <strong>of</strong>0.06 ha per HH. In Saptari the area grown per HH followed the <strong>in</strong>crease <strong>in</strong> the percentage <strong>of</strong>HHs grow<strong>in</strong>g the varieties, up to about 0.16 ha per HH <strong>in</strong> 2007-08. In contrast, the few HHs<strong>in</strong> Siraha that did grow the varieties <strong>in</strong> 2004-05 did so on a similarly large area but theaverage area per HH decl<strong>in</strong>ed dur<strong>in</strong>g the subsequent three years to around 0.07 ha.Production per HH was negligible (around 20 kg) <strong>in</strong> Jhapa and <strong>in</strong> Kapilvastu (Fig. 4C),reflect<strong>in</strong>g the small areas sown (Fig. 4B) and the relatively low productivity, around 400 kgha -1 (Fig. 4D). In contrast, HHs <strong>in</strong> Saptari produced around 100 kg per HH, reflect<strong>in</strong>g thelarger areas sown and also higher productivity <strong>of</strong> around 700 kg ha -1 . Productivity <strong>in</strong> Sirahawas similar or slightly higher, with a particularly good season <strong>in</strong> 2005-06, the same seasonwhen better yields <strong>of</strong> <strong>rice</strong> were obta<strong>in</strong>ed <strong>in</strong> this District (see Fig. 4D).30
Figure 4. New chickpea varieties from 04-05 to 07-08A. Percent <strong>of</strong> HHs grow<strong>in</strong>g70Percent <strong>of</strong> HHs grow<strong>in</strong>g60504030201004-0505-0606-0707-080Jhapa Kapilvastu Saptari Siraha Grand TotalDistrictB. Area grown per HHArea (ha) per HH0.180.160.140.120.100.080.060.040.020.00Jhapa Kapilvastu Saptari Siraha Grand TotalDistrict04-0505-0606-0707-08C. Production per HH160Production (kg) per HH140120100806040200Jhapa Kapilvastu Saptari Siraha Grand TotalDistrict04-0505-0606-0707-08D. Production per hectareProduction (kg) per ha16001400120010008006004002000Jhapa Kapilvastu Saptari Siraha Grand TotalDistrict04-0505-0606-0707-0831
MungbeanThere was appreciable adoption (above 40% <strong>of</strong> all HHs) <strong>of</strong> new Mungbean varieties <strong>in</strong> allDistricts (Fig. 5A). Adoption was steady around this level over all four years <strong>in</strong> Jhapa andKapilvastu but <strong>in</strong>creased to that level from a low base <strong>in</strong> Saptari. In Siraha, adoption wasrelatively low <strong>in</strong> the first two years but <strong>in</strong>creased to around 90% <strong>in</strong> 2006-07 and 2007-08.Areas grown per HH were <strong>of</strong> a similar order <strong>of</strong> magnitude to those <strong>of</strong> chickpea (Fig 5B)around 0.04 ha <strong>in</strong> Jhapa and Kapilvastu and around 0.12 ha <strong>in</strong> Saptari and Siraha.Production per HH (Fig. 5C) was very low (below 20 kg) <strong>in</strong> Jhapa and Kapilvastu but higher<strong>in</strong> Siraha (around 50 kg, with a ‘spike’ <strong>in</strong> 2004-05) and <strong>in</strong> Saptari (around 70-80 kg). In terms<strong>of</strong> per unit productivity, Saptari, Jhapa and Kapilvastu had similar productivity while Sirahahad the lowest productivity <strong>of</strong> all. Apart from Kapilvastu, where productivity was relativelyconstant at around 400 kg ha -1 over the four years, there was a trend towards decl<strong>in</strong><strong>in</strong>gproductivity with time <strong>in</strong> each <strong>of</strong> the other three Districts, albeit from <strong>in</strong>itially higher levelsthan Kapilvastu (Fig. 5D). Mungbean is ma<strong>in</strong>ly grown as a ra<strong>in</strong>fed crop <strong>in</strong> the Terai, <strong>in</strong> aseason where irrigation water and residual soil moisture are scarce, so yields tend to bedirectly proportional to current, local ra<strong>in</strong>fall. The crop is also susceptible to <strong>in</strong>sect pests andcompetition with weeds.32
Figure 5. New mungbean varieties from 04-05 to 07-08A. Percent <strong>of</strong> HHs grow<strong>in</strong>gPercent <strong>of</strong> HHs grow<strong>in</strong>g120100806040200JhapaKapilvastuSaptariSirahaGrand Total04-0505-0606-0707-08DistrictB. Area grown per HHArea (ha) per HH0.160.140.120.100.080.060.040.020.00Jhapa Kapilvastu Saptari Siraha GrandTotal04-0505-0606-0707-08DistrictC. Production per HHProduction (kg) per HH100806040200Jhapa Kapilvastu Saptari Siraha GrandTotal04-0505-0606-0707-08DistrictD. Production per hectareProduction (kg) per ha10008006004002000JhapaKapilvastuSaptariSirahaGrand Total04-0505-0606-0707-08District33
<strong>Use</strong> <strong>of</strong> gra<strong>in</strong>s and seeds by user householdsRiceAlmost all HHs saved seed <strong>of</strong> new <strong>rice</strong> varieties <strong>in</strong> 2006-07 and 2007-08 (Table 25) apartfrom <strong>in</strong> Kapilvastu where the percentage <strong>of</strong> HHs sav<strong>in</strong>g seed was lower <strong>in</strong> both years. Therewere more HHs that sold gra<strong>in</strong> <strong>in</strong> Jhapa than <strong>in</strong> the other three Districts. The other commonfate <strong>of</strong> new <strong>rice</strong> gra<strong>in</strong> was to be eaten by the family. Very few HHs sold seed, gave it as agift, or fed it to livestock. Only one HH (<strong>in</strong> Jhapa) gave gra<strong>in</strong> to a landowner.Table 25: Percentage <strong>of</strong> HHs that disposed <strong>of</strong> gra<strong>in</strong> <strong>of</strong> new project <strong>rice</strong> varieties <strong>in</strong> aparticular fashion <strong>in</strong> 2006-07 and 2007-08% <strong>of</strong> HHs dispos<strong>in</strong>g <strong>of</strong>harvest.GrandTotalYear Jhapa Kapilvastu Saptari SirahaSold as gra<strong>in</strong> 06-07 76 43 21 33 5107-08 77 25 23 33 50Sold as seed 06-07 6 13 13 33 1007-08 8 11 11 33 10Eaten by family 06-07 75 87 100 67 8507-08 78 100 100 100 89Saved for seed 06-07 99 43 100 100 9107-08 99 86 100 100 97Given as gift 06-07 0 4 0 0 107-08 0 4 2 33 2Feed for livestock 06-07 1 9 0 0 207-08 1 7 0 0 2Given to landowner 06-07 1 0 0 0 107-08 1 0 0 0 1Number <strong>of</strong> growers <strong>of</strong>project <strong>rice</strong> varieties06-0772 23 52 3 15007-08 83 28 53 3 167When gra<strong>in</strong> was sold, the largest amounts per HH were <strong>in</strong> Jhapa and Saptari and the least <strong>in</strong>Siraha (Table 26); conversely, HHs <strong>in</strong> Saptari ate the most gra<strong>in</strong>. The amount saved forseed <strong>in</strong> Jhapa and Kapilvastu (only <strong>in</strong> 06-07) was around twice as much as <strong>in</strong> Saptari andSiraha. Note, however, that there were only three growers <strong>in</strong> Siraha. The few HHs <strong>in</strong> Jhapaand Kapilvastu who fed gra<strong>in</strong> to livestock fed amounts rang<strong>in</strong>g from 30-120 kg/HH. Only onelandowner, <strong>in</strong> Jhapa, was repaid with <strong>rice</strong> gra<strong>in</strong> but the repayment was substantial <strong>in</strong> bothyears. No other landlords were reported as be<strong>in</strong>g repaid with chickpea or mungbean (Tables28 and 31) although, as there were significant areas <strong>of</strong> land shared <strong>in</strong> (around a quarter <strong>of</strong>cultivated land, Table 10) re-payments may have been with cash, <strong>in</strong> k<strong>in</strong>d or with gra<strong>in</strong> fromother crops or <strong>of</strong> non-project <strong>rice</strong> varieties.34
Table 26: Amount <strong>of</strong> gra<strong>in</strong> (kg per ‘dispos<strong>in</strong>g’ HH) <strong>of</strong> new <strong>rice</strong> varieties disposed <strong>of</strong> <strong>in</strong> aparticular fashion <strong>in</strong> 2006-07 and 2007-08Amounts <strong>of</strong> gra<strong>in</strong> disposed(kg per HH)Year Jhapa Kapilvastu Saptari Siraha GrandTotalSold as gra<strong>in</strong> 06-07 1910 609 1339 485 164107-08 1960 551 813 200 1658Sold as seed 06-07 259 227 37 40 13407-08 66 243 53 20 90Eaten by family 06-07 558 400 967 960 70607-08 695 351 1301 762 847Saved for seed 06-07 56 47 27 18 4307-08 57 30 28 27 43Given as gift 06-07 0 25 0 0 2507-08 0 30 30 15 25Feed for livestock 06-07 40 85 0 0 7007-08 120 30 0 0 60Given to landowner 06-07 920 0 0 0 92007-08 800 0 0 0 800For those HHs that sold gra<strong>in</strong> or seed, the p<strong>rice</strong> obta<strong>in</strong>ed varied slightly between years andbetween Districts (Table 27). In particular, gra<strong>in</strong> sold for a higher p<strong>rice</strong> <strong>in</strong> Saptari whereasthe p<strong>rice</strong> for seed was consistently highest <strong>in</strong> Siraha (where there were very few growers).There was a premium <strong>of</strong> around 100% for seed relative to gra<strong>in</strong>, reflect<strong>in</strong>g the perceivedhigher quality (and extra production cost) <strong>of</strong> seed.In Saptari, where cv Kanchhi Masuli is the most popular local variety, farmers sell gra<strong>in</strong> <strong>of</strong>the new varieties regardless <strong>of</strong> their quality at the p<strong>rice</strong> <strong>of</strong> Kanchhi Masuli and vice versa.The likely reason for the differences <strong>in</strong> p<strong>rice</strong> <strong>of</strong> new <strong>rice</strong> varieties <strong>in</strong> Siraha and Saptari is thatthe CBSP group <strong>in</strong> Saptari is more experienced than that <strong>of</strong> Siraha. So, the group fixes thep<strong>rice</strong> <strong>of</strong> seed <strong>in</strong> consultation with DADOs and Agrovets/seed companies. Whereas <strong>in</strong> Sirha,the group is not as mature and <strong>in</strong>dividual farmers sold the seed to other farmers withoutknowledge <strong>of</strong> any p<strong>rice</strong> fixation policy <strong>of</strong> seed <strong>in</strong> 2006-08. Generally farmers are ready topay higher p<strong>rice</strong>s for new varieties but once the varieties are locally produced then theirp<strong>rice</strong> gradually decl<strong>in</strong>es and becomes stable.Table 27: P<strong>rice</strong> <strong>of</strong> gra<strong>in</strong> and seed (Rs/kg) <strong>of</strong> new <strong>rice</strong> varieties sold <strong>in</strong> 2006-07 and 2007-08P<strong>rice</strong> Year Jhapa Kapilvastu Saptari Siraha GrandTotalP<strong>rice</strong> <strong>of</strong> gra<strong>in</strong> sold(Rs/kg) 06-07 7.6 10.7 16.6 8.0 9.307-08 8.4 10.3 13.3 9.0 9.3P<strong>rice</strong> <strong>of</strong> seed sold(Rs/kg) 06-07 18.0 17.7 17.0 25.0 17.907-08 18.6 21.3 18.3 25.0 19.435
ChickpeaAll HHs <strong>in</strong> Kapilvastu and Saptari <strong>in</strong> both years (and the s<strong>in</strong>gle HH <strong>in</strong> Jhapa <strong>in</strong> 2006-07) atesome <strong>of</strong> the chickpeas that they grew whereas a slightly lower percentage <strong>of</strong> HHs <strong>in</strong> Sirahadid so (Table 28). Around 30% <strong>of</strong> HHs <strong>in</strong> Saptari sold seeds whereas only a few HHs <strong>in</strong> any<strong>of</strong> the other three Districts did so. A few (7 <strong>in</strong> Kapilvastu and 1 <strong>in</strong> Saptari) HHs gave seed asgifts. Only two HH, <strong>in</strong> Kapilvastu, used chickpea to feed livestock.Table 28: Percentage <strong>of</strong> HHs that disposed <strong>of</strong> gra<strong>in</strong> <strong>of</strong> new chickpea varieties <strong>in</strong> a particularfashion <strong>in</strong> 2006-07 and 2007-08% <strong>of</strong> HHs dispos<strong>in</strong>g <strong>of</strong>harvest.Year Jhapa Kapilvastu Saptari Siraha GrandTotalSold as gra<strong>in</strong> 06-07 100 20 66 13 3807-08 0 13 69 0 35Sold as seed 06-07 0 2 34 13 1607-08 0 2 29 0 13Eaten by family 06-07 100 100 100 75 9807-08 0 100 100 80 99Saved for seed 06-07 0 96 100 63 9307-08 0 100 100 80 99Given as gift 06-07 0 15 3 0 907-08 0 16 3 0 9Feed for livestock 06-07 0 4 0 0 207-08 0 4 0 0 2Number <strong>of</strong> growers <strong>of</strong>new chickpea varieties06-071 46 35 8 9007-08 0 45 35 5 85The amounts <strong>of</strong> gra<strong>in</strong> <strong>of</strong> new chickpea varieties transacted were small, reflect<strong>in</strong>g the lowlevels <strong>of</strong> production (Table 29). The larger amounts sold and eaten <strong>in</strong> Siraha wereattributable to only one HH.For those who sold gra<strong>in</strong> or seed, the unit p<strong>rice</strong> (Table 30) was much higher than for <strong>rice</strong>(Table 27) but, <strong>of</strong> course, the returns per HH were low because the volumes traded weresmall. The premium for chickpea sold as seed rather than for gra<strong>in</strong> was smaller, around40%, than that for <strong>rice</strong> but note that there is already generally a premium for Kabuli (boldseeded)chickpea over Desi (local, small-seeded) varieties.Table 29: Amount <strong>of</strong> gra<strong>in</strong> (kg per ‘dispos<strong>in</strong>g’ HH) <strong>of</strong> new chickpea varieties disposed <strong>of</strong> <strong>in</strong>various ways <strong>in</strong> 2006-07 and 2007-08.Amounts <strong>of</strong> gra<strong>in</strong>disposed (kg per HH)Year Jhapa Kapilvastu Saptari Siraha GrandTotalSold as gra<strong>in</strong> 06-07 10 29 48 180 4607-08 0 25 57 0 51Sold as seed 06-07 0 7 31 130 3607-08 0 16 37 0 35Eaten by family 06-07 10 15 45 18 2707-08 0 14 46 60 29Saved for seed 06-07 0 3 10 8 607-08 0 2 10 6 6Given as gift 06-07 0 7 15 0 807-08 0 58 54 0 55Feed for livestock 06-07 0 4 0 0 407-08 0 30 59 0 5636
Table 30: P<strong>rice</strong> <strong>of</strong> gra<strong>in</strong> and seed (Rs/kg) <strong>of</strong> new chickpea varieties sold <strong>in</strong> 2006-07 and2007-08P<strong>rice</strong> Year Jhapa Kapilvastu Saptari Siraha GrandTotalP<strong>rice</strong> <strong>of</strong> gra<strong>in</strong> sold (Rs/kg) 06-07 40 50 51 48 4007-08Nonesold 58 54Nonesold 55P<strong>rice</strong> <strong>of</strong> seed sold (Rs/kg) 06-07 0 40 55 70 4007-08Nonesold 30 59Nonesold 56MungbeanMost HHs <strong>in</strong> all Districts ate the new varieties <strong>of</strong> mungbean and sold some for seed (Table31). In addition, a large proportion <strong>of</strong> HHs <strong>in</strong> Saptari (56% and 47% <strong>in</strong> the two years) soldgra<strong>in</strong>. A significant m<strong>in</strong>ority <strong>of</strong> HHs <strong>in</strong> Saptari and Siraha sold seed.Table 31: Percentage <strong>of</strong> HHs that disposed <strong>of</strong> gra<strong>in</strong> <strong>of</strong> mungbean varieties <strong>in</strong> a particularfashion <strong>in</strong> 2006-07 and 2007-08% <strong>of</strong> HHs dispos<strong>in</strong>g <strong>of</strong>harvest.Year Jhapa Kapilvastu Saptari Siraha GrandTotalSold as gra<strong>in</strong> 06-07 9 0 56 14 2107-08 6 5 47 10 18Sold as seed 06-07 22 4 29 30 2307-08 6 0 47 18 20Eaten by family 06-07 97 100 100 95 9807-08 91 91 100 80 89Saved for seed 06-07 91 92 100 100 9607-08 88 95 100 82 90Given as gift 06-07 3 4 6 30 1307-08 3 5 0 16 7Number <strong>of</strong> mungbeangrowers 06-07 32 24 34 43 13307-08 32 22 36 49 139As for chickpea, the amounts <strong>of</strong> the new mungbean varieties transacted were small (Table32). P<strong>rice</strong>s for both gra<strong>in</strong> and seed were higher than those for chickpea and differedbetween Districts, be<strong>in</strong>g higher <strong>in</strong> Jhapa, although there was actually very little premium forseed over gra<strong>in</strong> <strong>in</strong> any District (Table 33).37
Table 32: Amount <strong>of</strong> gra<strong>in</strong> (kg per ‘dispos<strong>in</strong>g’ HH) <strong>of</strong> new mungbean varieties disposed <strong>of</strong> <strong>in</strong>a particular fashion <strong>in</strong> 2006-07 and 2007-08.Amounts <strong>of</strong> gra<strong>in</strong>disposed (kg per HH)GrandTotalYear Jhapa Kapilvastu Saptari SirahaSold as gra<strong>in</strong> 06-07 9 0 56 25 4507-08 4 45 46 31 40Sold as seed 06-07 11 20 14 29 2007-08 3 0 22 17 19Eaten by family 06-07 12 12 39 27 2407-08 9 13 44 33 27Saved for seed 06-07 2 2 5 4 407-08 2 2 5 5 4Given as gift 06-07 1 3 14 6 607-08 1 2 0 10 9Table 33. P<strong>rice</strong> <strong>of</strong> gra<strong>in</strong> and seed (Rs/kg) <strong>of</strong> new mungbean varieties sold <strong>in</strong> 2006-07 and2007-08Amounts <strong>of</strong> gra<strong>in</strong>disposed (kg per HH)Year Jhapa Kapilvastu Saptari Siraha GrandTotalP<strong>rice</strong> <strong>of</strong> gra<strong>in</strong> sold (Rs/kg) 06-07 73 None sold 54 54 5607-08 73 50 59 66 61P<strong>rice</strong> <strong>of</strong> seed sold (Rs/kg) 06-07 74 60 58 62 6307-08 80 None sold 73 67 72Distribution <strong>of</strong> seeds <strong>of</strong> particular varieties by user householdsSeed <strong>of</strong> new varieties was distributed by relatively few HHs and seed travelled, on average,quite short distances (Table 34). However, when HHs did supply seed to others, totalamounts transacted could be quite large, e.g. 460 kg <strong>of</strong> BG 1442 <strong>rice</strong> by six HH <strong>in</strong> Jhapaand 700 kg <strong>of</strong> Barkhe 2014 by two farmers <strong>in</strong> Kapilvastu. Distribution <strong>of</strong> legume seeds(mungbean and chickpea) was generally <strong>in</strong> smaller amounts, perhaps reflect<strong>in</strong>g the smallervolumes <strong>of</strong> seed available as a consequence <strong>of</strong> low productivity and the <strong>in</strong>herently smallermultiplication rates <strong>of</strong> legumes relative to <strong>rice</strong>. Farmers <strong>in</strong> Saptari distributed seed more thanthose <strong>in</strong> other Districts.38
Table 34: Seed distribution patterns by variety usersSeed supplied Jhapa Kapilvastu Saptari Siraha OverallBG 1442 (no. HH supply<strong>in</strong>g) 6.0 1.0 7.0BG 1442 mean distance (km) 1.4 1.0 1.3BG 1442 total supplied (kg) 460.0 30.0 490.0Barkhe 2014 (no. HH supply<strong>in</strong>g) 2.0 6.0 1.0 9.0Barkhe 2014 mean distance (km) 2.0 2.9 50.0 7.9Barkhe 2014 total supplied (kg) 700.0 295.0 20.0 1015.0Sughanda 1 (no. HH supply<strong>in</strong>g) 1.0 1.0Sughanda 1 mean distance (km) 2.0 2.0Sughanda 1 total supplied (kg) 25.0 25.0KPG59 chickpea (no. HH supply<strong>in</strong>g) 6.0 6.0KPG59 chickpea mean distance (km) 6.9 6.9KPG59 chickpea seed total supplied(kg)192.0 192.0Awarodhi chickpea (no. HH supply<strong>in</strong>g) 1.0 4.0 5.0Awarodhi chickpea mean distance (km) 1.0 1.6 1.5Awarodhi chickpea total supplied (kg) 16.0 95.0 111.0KAK 2 chickpea (no. HH supply<strong>in</strong>g) 4.0 4.0KAK 2 chickpea mean distance (km) 9.8 9.8KAK 2 chickpea total supplied (kg) 81.0 81.0Tara chickpea (no. HH supply<strong>in</strong>g) 1.0 1.0Tara chickpea mean distance (km) 2.0 2.0Tara chickpea total supplied (kg) 5.0 5.0Prateeksha mungbean (no. HHsupply<strong>in</strong>g)Prateeksha mungbean mean distance(km)Prateeksha mungbean total supplied(kg)1.0 10.0 11.01.0 2.0 1.93.0 223.0 226.0Kalyan mungbean (no. HH supply<strong>in</strong>g) 1.0 6.0 9.0 16.0Kalyan mungbean mean distance (km) 1.0 1.0 4.2 2.8Kalyan mungbean total supplied (kg) 2.0 145.0 148.5 295.5VC 3690 mungbean (no. HH supply<strong>in</strong>g) 1.0 1.0VC 3690 mungbean mean distance2.0 2.0(km)VC 3690 mungbean total supplied (kg) 5.0 5.0Specific benefits reported by usersThe proportion <strong>of</strong> technology users who mentioned a specific benefit when asked an ‘open’question, i.e. a list <strong>of</strong> possible answers was not read out, is a crude measure <strong>of</strong> theimportance <strong>of</strong> that benefit. However, farmers’ rank<strong>in</strong>gs <strong>of</strong> the cited benefits allow thecalculation <strong>of</strong> a more <strong>in</strong>formative <strong>in</strong>dex <strong>of</strong> the relative importance <strong>of</strong> benefits. For eachtechnology <strong>in</strong> Tables 35 – 39, data are first presented (column A) on the crude basis <strong>of</strong> what39
proportion <strong>of</strong> respondents (users <strong>of</strong> that technology) cited any particular benefit. In column B,that value is then divided by the mean rank value for that benefit. Thus, for example, for abenefit from a range <strong>of</strong> 10 benefits that was cited by all HHs (100% mention it) itsimportance could range from 100% (if all ranked it 1st out <strong>of</strong> 10) down to 10% (if all ranked it10 th out <strong>of</strong> 10).From new varietiesFarmers were asked about benefits <strong>of</strong> new varieties <strong>in</strong> general and answers cannot bedisaggregated accord<strong>in</strong>g to crop or variety (Table 35). Increased consumption <strong>of</strong> legumesand improved soil fertility was less important <strong>in</strong> Jhapa (where chickpea adoption was zero)than benefits likely to be associated with <strong>in</strong>creased <strong>rice</strong> production such as <strong>in</strong>creasedconsumption <strong>of</strong> cereals and <strong>in</strong>creased food self-sufficiency (Table 35). Better health wasassociated with <strong>in</strong>creased consumption <strong>of</strong> legumes, i.e. was not thought as important <strong>in</strong>Jhapa as <strong>in</strong> the other three Districts.Cropp<strong>in</strong>g as a source <strong>of</strong> cash was particularly important <strong>in</strong> Saptari, while <strong>in</strong>creased soilfertility was most important <strong>in</strong> Siraha. Reduc<strong>in</strong>g or avoid<strong>in</strong>g migration was the least importantbenefit mentioned <strong>in</strong> all Districts. Overall, source <strong>of</strong> cash and <strong>in</strong>creased consumption <strong>of</strong>cereals were cited as the most important benefits.Table 35: Percentage (A) <strong>of</strong> new chickpea/mungbean/<strong>rice</strong> users who mentioned a particularbenefit from new crops and varieties and (B) that percentage divided by the mean rank forthat benefitBenefitJhapa Kapilvastu Saptari Siraha OverallA B A B A B A B A BSource <strong>of</strong> cash 90 33 62 19 95 53 75 24 82 32Increased consumption <strong>of</strong> legumes 42 11 80 37 76 30 90 34 70 26Increased consumption <strong>of</strong> cereals 99 42 92 35 94 27 75 22 91 32Increased food self sufficiencymonths 100 50 39 13 86 22 76 20 77 25Better health 35 6 79 22 76 16 61 13 62 13Reduce or avoid migration 25 5 48 10 3 0 4 1 21 4Increased soil fertility 69 14 86 18 75 21 98 54 80 21Increased fodder for livestock 98 23 83 16 84 14 45 8 81 16No. HHs grow<strong>in</strong>g new varieties 83 83 71 71 80 80 51 51 285 285From RRC technologiesProject records do not allow the <strong>in</strong>tensity <strong>of</strong> promotion <strong>of</strong> these activities to be disaggregatedby district so, for a given district, the l<strong>in</strong>k between level <strong>of</strong> promotion and level <strong>of</strong> adoption isunclear. We do know, however, that the project tra<strong>in</strong>ed 455 farmers <strong>in</strong> 41 villages <strong>in</strong> seedprim<strong>in</strong>g techniques and 526 farmers <strong>in</strong> the same 41 villages <strong>in</strong> IPNM (Table 4).Seed prim<strong>in</strong>gOn average, we would expect 244 HHs <strong>in</strong> the 22 sampled villages (22/41 x 455) to havebeen tra<strong>in</strong>ed <strong>in</strong> seed prim<strong>in</strong>g, so the 128 HHs that reported us<strong>in</strong>g seed prim<strong>in</strong>g (Table 36)represent around 50% adoption <strong>of</strong> those <strong>in</strong>itially tra<strong>in</strong>ed (although this takes no account <strong>of</strong>any spontaneous adoption by HHs who were not <strong>in</strong>itially tra<strong>in</strong>ed).The most obvious benefits <strong>of</strong> seed prim<strong>in</strong>g are quick- and higher germ<strong>in</strong>ation and that isreflected <strong>in</strong> the farmers’ views <strong>in</strong> all districts, although that conclusion is based on only asmall number <strong>of</strong> farmers <strong>in</strong> Saptari and Siraha (Table 36). Most farmers <strong>in</strong> Kapilvastu alsocited plant vigour and resistance to drought and disease and <strong>in</strong>creased yield although they40
anked these benefits lower than quick germ<strong>in</strong>ation. It should be noted that these six benefitsare those generally put forward dur<strong>in</strong>g tra<strong>in</strong><strong>in</strong>g sessions as justification for implement<strong>in</strong>gseed prim<strong>in</strong>g, so citation <strong>of</strong> them might reflect on the effectiveness <strong>of</strong> the tra<strong>in</strong><strong>in</strong>g. Farmersneed reasons to try new technologies and persuasion almost always <strong>in</strong>cludes <strong>in</strong>formation onexpectations from the <strong>in</strong>tervention so confound<strong>in</strong>g <strong>of</strong> expected benefits with actual benefitswhen asked is always a possibility.Table 36: Percent (A) <strong>of</strong> users who mentioned a particular benefit from seed prim<strong>in</strong>g and (B)that percentage divided by the mean rank for that benefit.BenefitJhapa Kapilvastu Saptari Siraha OverallA B A B A B A B A BHigher germ<strong>in</strong>ation 92 42 90 30 100 50 100 50 91 35Quick germ<strong>in</strong>ation 96 77 100 52 100 100 100 75 98 61Disease resistance 8 2 93 32 83 25 67 15 60 19Drought resistance 33 10 94 27 100 22 100 33 72 21Plant vigour 48 17 96 23 100 23 67 17 77 20Increase yield 23 7 80 16 100 19 100 19 60 13Uniform growth 8 3 0 - 0 - 0 - 3 1Reduces bird damage 13 5 0 - 0 - 0 - 5 2Fewer pest problems 0 - 3 1 0 - 0 - 2 0No. seed prim<strong>in</strong>gusers 48 48 71 71 6 6 3 3 128 128Improved compost<strong>in</strong>gAs for seed prim<strong>in</strong>g, on average we would expect 282 HHs <strong>in</strong> the 22 sampled villages (22/41x 526) to have been tra<strong>in</strong>ed <strong>in</strong> improved compost<strong>in</strong>g techniques, so the 119 HHs thatreported us<strong>in</strong>g improved compost<strong>in</strong>g (Table 37) represent around 40% adoption <strong>of</strong> those<strong>in</strong>itially tra<strong>in</strong>ed. Aga<strong>in</strong>, this takes no account <strong>of</strong> any spontaneous adoption by HHs who werenot <strong>in</strong>itially tra<strong>in</strong>ed.The ma<strong>in</strong> perceived benefit <strong>of</strong> improved compost<strong>in</strong>g <strong>in</strong> all districts was improved soil fertilityand, to a lesser extent, low cost <strong>of</strong> production (Table 37). Surpris<strong>in</strong>gly, <strong>in</strong>creased production(usually a consequence <strong>of</strong> improved soil fertility) was barely mentioned and it may be thatthere had been some substitution <strong>of</strong> lower-cost compost for more expensive fertilizers. It isthought that fewer HHs <strong>in</strong> Saptari and Siraha adopted improved compost<strong>in</strong>g because, unlike<strong>in</strong> Kapilvastu and Jhapa, cattle dung is widely used there for mak<strong>in</strong>g dung cakes for cook<strong>in</strong>gand is not available for mak<strong>in</strong>g compost. It seems likely that ‘<strong>in</strong>creased shelf life’ may be anexpectation carried over from <strong>in</strong>itial tra<strong>in</strong><strong>in</strong>g (see above).Table 37: Percentage (A) <strong>of</strong> compost<strong>in</strong>g users who mentioned a particular benefit fromimproved compost<strong>in</strong>g and (B) that percentage divided by the average rank<strong>in</strong>g for thatbenefit.BenefitJhapa Kapilvastu Saptari Siraha OverallA B A B A B A B A BImprove soil fertility 100 87 98 63 100 88 67 44 98 76Low cost <strong>of</strong> production 98 50 88 39 100 50 67 44 94 45High product p<strong>rice</strong> 27 9 52 23 33 13 33 8 37 14Increase shelf-life 37 12 43 13 0 - 33 11 34 11Increase <strong>in</strong> production 8 4 19 7 7 2 0 - 12 4<strong>Use</strong> <strong>of</strong> local resources 5 2 0 - 7 2 0 - 3 1Fewer disease problems 3 2 0 - 0 - 0 - 2 1No. <strong>of</strong> HH compost<strong>in</strong>g 59 59 42 42 15 15 3 3 119 11941
IPNMThe expected primary benefit <strong>of</strong> IPNM – <strong>in</strong>creased soil fertility – was the most important one,cited by almost all IPNM users <strong>in</strong> all Districts (Table 38). Increased yield, low cost <strong>of</strong>production and use <strong>of</strong> local materials were also all cited widely and deemed to be quiteimportant, whereas pest and disease control were deemed to be less important benefits. Thesoils <strong>in</strong> Kapilvastu are generally more fertile than that <strong>of</strong> the other districts and might expla<strong>in</strong>why so few HHs adopted IPNM there (impact <strong>of</strong> IPNM practices is <strong>of</strong>ten more visible <strong>in</strong>marg<strong>in</strong>al areas). Unanimous report<strong>in</strong>g <strong>of</strong> all six benefits <strong>in</strong> Kapilvastu and Saptari aga<strong>in</strong>suggests recall <strong>of</strong> benefits mentioned dur<strong>in</strong>g tra<strong>in</strong><strong>in</strong>g.Table 38: Percentage (A) <strong>of</strong> IPNM users who mentioned a particular benefit from IPNM and(B) that percentage divided by the mean rank for that benefitBenefitJhapa Kapilvastu Saptari Siraha OverallA B A B A B A B A BIncrease soil fertility 92 41 100 30 100 45 100 95 96 49Increase yield 77 24 100 30 100 31 100 51 89 32Low cost <strong>of</strong> production 84 27 100 27 100 31 100 33 93 30Disease control 36 8 100 23 100 23 5 1 46 10Insect/Pest control 69 20 100 33 100 20 5 1 61 15<strong>Use</strong> <strong>of</strong> local resources 97 38 100 30 100 33 54 14 86 29No. <strong>of</strong> HHs us<strong>in</strong>g IPNM 64 64 3 3 36 36 37 37 140 140IPMBenefits <strong>of</strong> IPM were mentioned by relatively few users <strong>in</strong> Kapilvastu, Saptari and,particularly, Siraha (Table 39). The expected primary benefits from IPM – disease and pestcontrol – were cited <strong>in</strong> all Districts but were only considered to be the most importantbenefits <strong>in</strong> Jhapa. One reason why <strong>in</strong>creased soil fertility was cited widely as be<strong>in</strong>gmoderately important was that use <strong>of</strong> animal ur<strong>in</strong>e was one <strong>of</strong> the most importantcomponents <strong>of</strong> IPM. Although animal ur<strong>in</strong>e repels some pests and reduces the <strong>in</strong>cidence <strong>of</strong>fungal foliar diseases, it is also a source <strong>of</strong> nitrogen (and and some hormones such asaux<strong>in</strong>s) and can be used as a foliar feed. Increased growth and yield could thus be<strong>in</strong>terpreted as result<strong>in</strong>g from ‘<strong>in</strong>creased (soil) fertility’, although a similar <strong>in</strong>terpretation –‘improved plant vigour’ – was barely mentioned.Table 39: Percent (A) <strong>of</strong> IPM users who mentioned a particular benefit from IPM and (B) thatpercentage divided by the average rank<strong>in</strong>g for that benefitBenefitJhapa Kapilvastu Saptari Siraha OverallA B A B A B A B A BIncrease soil fertility 55 11 94 31 58 12 100 20 64 14Increase yield 64 17 88 31 83 23 100 25 72 20Low cost <strong>of</strong> production 75 21 94 33 100 32 100 50 83 25Disease control 77 25 88 27 100 30 0 - 82 26Insect/Pest control 96 57 88 20 100 33 100 100 95 40Better environment 96 41 88 21 92 46 100 33 94 35Knowledge <strong>of</strong> IPM 2 1 0 - 0 - 0 - 1 1Plant vigour 2 1 0 - 0 - 0 - 1 0No. <strong>of</strong> HHs us<strong>in</strong>g IPM 53 53 17 17 12 12 1 1 83 8342
Interaction between RRC technologies and cropsTable 40 shows the reported application <strong>of</strong> other (non-cultivar) RRC technologies (seedprim<strong>in</strong>g, improved compost<strong>in</strong>g, IPM, IPNM) to each <strong>of</strong> the crops. Note that there seems tohave been some confusion over what constitutes ‘seed prim<strong>in</strong>g’ <strong>in</strong> <strong>rice</strong>. It is customary <strong>in</strong>some areas to pre-germ<strong>in</strong>ate or sprout <strong>rice</strong> seeds before sow<strong>in</strong>g them <strong>in</strong>to nurseries.Farmers may have confused this practice, applicable to the transplanted <strong>rice</strong> that iscommonly grown, with seed prim<strong>in</strong>g (NOT pre-germ<strong>in</strong>ation) that is appropriate for directseeded<strong>rice</strong> that is uncommon <strong>in</strong> these areas. Thus we do not have any confidence <strong>in</strong> theresults for seed prim<strong>in</strong>g <strong>in</strong> <strong>rice</strong> <strong>in</strong> Table 40 (nor, by <strong>in</strong>ference, <strong>in</strong> those for the ‘any crop’category that <strong>in</strong>cludes <strong>rice</strong>).Seed prim<strong>in</strong>g <strong>in</strong> chickpea was only used by appreciable numbers <strong>of</strong> farmers <strong>in</strong> Kapilvastu(hardly any chickpea was grown <strong>in</strong> Jhapa) whereas mungbean seed was primed by 33% <strong>of</strong>mungbean growers <strong>in</strong> Jhapa and 36% <strong>of</strong> mungbean growers <strong>in</strong> Kapilvastu. The ‘other’ cropsprimed by 51% <strong>of</strong> HH <strong>in</strong> Kapilvastu are not known.Improved compost<strong>in</strong>g, IPM and IPNM for ‘any crop’ were all quite popular <strong>in</strong> Jhapa (wherepoor soil fertility is perceived to be a major problem) but less so <strong>in</strong> the other three Districts,the only exception be<strong>in</strong>g IPNM <strong>in</strong> Siraha and, possibly, improved compost<strong>in</strong>g <strong>in</strong> Kapilvastu.These relatively high values for adoption <strong>of</strong> these three technologies <strong>in</strong> Jhapa are due tohigh rates <strong>of</strong> adoption <strong>in</strong> <strong>rice</strong> and <strong>in</strong> mungbean but not <strong>in</strong> chickpea (which is barely grown) or<strong>in</strong> ‘other crops’.Table 40: <strong>Use</strong> <strong>of</strong> technologies <strong>in</strong> particular crops (% <strong>of</strong> users <strong>of</strong> each crop) with<strong>in</strong> the 287surveyed farmers <strong>in</strong> the four districtsDistrictJhapa Kapilvastu Saptari Siraha OverallAny cropSeed prim<strong>in</strong>g 64 97 10 4 47Improved Compost<strong>in</strong>g 78 58 20 6 44IPM 64 23 15 2 29IPNM 77 4 45 73 49Number <strong>of</strong> farmers 83 73 80 51 287Rice cropSeed prim<strong>in</strong>g 57 47 1 2 29Improved Compost<strong>in</strong>g 70 30 8 4 31IPM 54 8 0 0 18IPNM 61 1 34 20 31Number <strong>of</strong> <strong>rice</strong> users 83 73 80 51 287Chickpea cropSeed prim<strong>in</strong>g 25 32 3 9 18Improved Compost<strong>in</strong>g 25 45 0 0 22IPM 25 25 11 9 18IPNM 0 2 0 9 2Number chickpea users 4 44 38 11 97Mung bean cropSeed prim<strong>in</strong>g 33 36 8 4 17Improved Compost<strong>in</strong>g 64 23 3 4 21IPM 73 5 0 2 18IPNM 64 5 0 44 31Number mungbean users 33 22 36 50 141Other cropsSeed prim<strong>in</strong>g 8 51 5 0 17Improved Compost<strong>in</strong>g 14 27 15 2 1643
IPM 13 11 13 0 10IPNM 18 3 16 12 13Number 83 73 80 51 287Household food self sufficiency <strong>of</strong> usersThe majority <strong>of</strong> households reported a change <strong>in</strong> food self-sufficiency <strong>in</strong> Saptari, Siraha andJhapa but only 40% <strong>of</strong> the households <strong>in</strong> Kapilvastu reported a change (Table 41). Thereason for this is unknown. Overall there was a 29% <strong>in</strong>crease <strong>in</strong> household food gra<strong>in</strong> selfsufficiency reported by users follow<strong>in</strong>g adoption <strong>of</strong> RRC technologies, an <strong>in</strong>crease <strong>of</strong> 3months up from 10.2 months. However, the <strong>in</strong>crease was greatest <strong>in</strong> Jhapa (63%) wheremean food gra<strong>in</strong> self-sufficiency was already the highest (Table 41). It seems likely that thewidespread adoption <strong>of</strong> BG1442 as a Chaite <strong>rice</strong> crop (<strong>in</strong> effect, an ‘extra’ <strong>rice</strong> crop) <strong>in</strong> Jhapawould have contributed to this large <strong>in</strong>crease. As a general pr<strong>in</strong>ciple, <strong>in</strong>creased productivity<strong>of</strong> the staple crop <strong>rice</strong>, that is grown on most <strong>of</strong> the land types available, is more likely to<strong>in</strong>crease household food gra<strong>in</strong> self sufficiency than improvements <strong>in</strong> other crops (such aschickpea and mungbean) that have more restrictive land requirements.Table 41: Reported change <strong>in</strong> household food self-sufficiency <strong>of</strong> users.HH food self-sufficiency Jhapa Kapilvastu Saptari Siraha OverallPercent <strong>of</strong> HH report<strong>in</strong>g change 100.0 39.7 86.3 76.5 76.7Average before RRC (months) 11.9 8.8 9.9 10.0 10.2Average after RRC (months) 19.4 9.7 11.2 11.2 13.2Average Change (months) 7.5 0.8 1.3 1.3 3.0Percent change +62.8 +9.4 +13.2 +12.6 +29.0Problems with the new varieties as perceived by usersFor each technology <strong>in</strong> Tables 42 – 44, data are first presented (column A) on the crudebasis <strong>of</strong> what proportion <strong>of</strong> respondents (users <strong>of</strong> that technology) cited any particularbenefit. In column B, that value is then divided by the mean rank value for that benefit. Thus,for example, for a benefit from a range <strong>of</strong> 10 benefits that was cited by all HHs (100%mention it) its importance could range from 100% (if all ranked it 1st out <strong>of</strong> 10) down to 10%(if all ranked it 10 th out <strong>of</strong> 10).RiceOverall, the two most important problems cited by growers <strong>of</strong> the new <strong>rice</strong> varieties werepests and diseases (Table 42) although it should be noted that these are also the mostimportant problems for <strong>rice</strong> <strong>in</strong> general. Lack <strong>of</strong> irrigation was reported to be a significantproblem <strong>in</strong> Kapilvastu. Most <strong>rice</strong> is produced <strong>in</strong> the kharif season when irrigation availabilityis less <strong>of</strong> an issue although, even <strong>in</strong> the kharif, irrigation can <strong>in</strong>crease yield when ra<strong>in</strong>fall iserratic. Lack <strong>of</strong> seed was also deemed quite important, particularly <strong>in</strong> Kapilvastu and Siraha.44
Table 42: Percentage (A) <strong>of</strong> new <strong>rice</strong> variety users who mentioned a particular problem withgrow<strong>in</strong>g new <strong>rice</strong> varieties and (B) that percentage divided by the average rank<strong>in</strong>g for thatproblemBenefit Jhapa Kapilvastu Saptari Siraha OverallA B A B A B A B A BLack <strong>of</strong> market 4 2 67 16 22 4 0 - 12 3Lack <strong>of</strong> seed 10 5 75 40 44 9 50 25 21 9Lack <strong>of</strong> <strong>in</strong>puts 10 4 58 15 89 37 100 40 24 8Pests 92 68 83 40 78 39 100 40 90 60Disease 48 22 75 24 78 29 100 29 55 22Inadequate technicalknow how 27 9 67 17 78 29 50 50 36 12Need <strong>of</strong> more fertilizer 4 2 0 - 0 - 0 - 3 2Low seed germ<strong>in</strong>ation 11 5 0 - 0 - 0 - 8 4Need <strong>of</strong> more irrigation 16 11 17 45 11 11 0 - 15 9No. HHs us<strong>in</strong>g new<strong>rice</strong> varieties 83 83 12 12 9 9 2 2106 106ChickpeaInsects, pests and diseases were also the most important problems cited for grow<strong>in</strong>g newvarieties <strong>of</strong> chickpea (Table 43) – aga<strong>in</strong>, these are the most important constra<strong>in</strong>ts forchickpea <strong>in</strong> general. There were no responses from Jhapa because there were no growers<strong>of</strong> new chickpea varieties. Lack <strong>of</strong> seed and lack <strong>of</strong> other <strong>in</strong>puts were mentioned frequently,as were theft and damage from stray animals, the latter particularly <strong>in</strong> Kapilvastu andSaptari. Inadequate technical know-how was also considered important <strong>in</strong> Saptari andSiraha (although there were only 5 growers <strong>in</strong> Siraha).Table 43: Percentage (A) <strong>of</strong> new chickpea users who mentioned a particular problem withgrow<strong>in</strong>g new chickpea varieties and (B) that percentage divided by the average rank<strong>in</strong>g forthat problemBenefit Jhapa Kapilvastu Saptari Siraha OverallA B A B A B A B A BTheft 0 - 43 9 89 17 40 13 62 13Space required forgraz<strong>in</strong>g 0 - 59 13 11 2 40 13 38 8Damage from strayanimals 0 - 57 12 91 19 60 16 71 15Encroachment from wildanimals 0 - 43 7 9 1 20 7 27 4Lack <strong>of</strong> seed 0 - 77 24 74 14 40 9 74 18Lack <strong>of</strong> other <strong>in</strong>puts 0 - 59 12 89 23 40 7 70 16Insects/Pests 0 - 95 44 100 57 80 53 96 49Diseases 0 - 93 24 100 35 60 13 94 27Inadequate technicalknow how 0 - 55 10 86 21 80 36 69 15Too late to sow after <strong>rice</strong>harvest 0 - 39 5 3 0 40 11 24 3Low pod formation 0 - 0 - 0 - 20 20 1 1High moisture 0 - 0 - 23 18 0 - 10 8No. HHs us<strong>in</strong>g newchickpea varieties 0 0 44 44 35 35 5 5 84 8445
MungbeanAga<strong>in</strong> pests and diseases, particularly pests, were considered most important for newvarieties <strong>of</strong> mungbean (as well as for mungbean <strong>in</strong> general, see above) followed by lack <strong>of</strong>other <strong>in</strong>puts and <strong>of</strong> seed (particularly <strong>in</strong> Saptari) and <strong>in</strong>adequate technical know-how(particularly <strong>in</strong> Saptari and Siraha) (Table 44). Thrips and suck<strong>in</strong>g bugs are the major pests<strong>of</strong> mungbean and there are no resistant varieties. Although spray<strong>in</strong>g with chemical pesticideat the time <strong>of</strong> flower<strong>in</strong>g is recommended to manage these pests, successful adoptionrequires technical know-how and access to <strong>in</strong>puts.Table 44: Percentage (A) <strong>of</strong> new mungbean users who mentioned a particular problem withgrow<strong>in</strong>g new mungbean varieties and (B) that percentage divided by the average rank<strong>in</strong>g forthat problemBenefit Jhapa Kapilvastu Saptari Siraha OverallA B A B A B A B A BSpace required forgraz<strong>in</strong>g 0 - 14 5 8 2 10 5 8 3Encroachment from wildanimals 0 - 5 1 8 1 12 3 7 2Lack <strong>of</strong> seed 9 3 27 10 83 17 42 11 43 10Lack <strong>of</strong> other <strong>in</strong>puts 12 5 18 7 94 27 40 12 44 13Weeds 15 7 5 5 28 5 24 6 20 5Pests 88 65 100 73 97 47 78 39 89 50Disease 33 15 68 30 97 32 80 25 72 25Lack <strong>of</strong> labour 3 3 5 2 0 - 8 4 4 2Lack <strong>of</strong> knowledge onhow to grow 18 8 14 5 89 26 76 30 56 19Too late to sow afterw<strong>in</strong>ter crop harvest 3 2 5 2 8 2 4 2 5 1Low moisture 9 5 5 2 31 22 18 10 17 10Low pod formation 18 11 9 6 3 1 22 20 14 11No. HHs us<strong>in</strong>g newmungbean varieties 33 33 22 22 36 36 50 50141 141Non-users’ views on new project varietiesThese questions were designed to f<strong>in</strong>d out why non-users were not users. However, itshould be noted that this part <strong>of</strong> the questionnaire did not mention ‘new’ or ‘project’ varietiesso there may be some confusion <strong>in</strong> the m<strong>in</strong>ds <strong>of</strong> the respondents as to what they were be<strong>in</strong>gasked. For <strong>in</strong>stance for <strong>rice</strong>, staff may have used “SD varieties” and “new varieties”synonymously while ask<strong>in</strong>g questions.RiceThe proportion <strong>of</strong> the non-user HHs sampled that knew about short-duration (SD) <strong>rice</strong> variedfrom 32% <strong>in</strong> Siraha to 96% <strong>in</strong> Saptari (Table 45). Only 3 HH (11% <strong>of</strong> those that knew aboutSD <strong>rice</strong>) <strong>in</strong> Jhapa had ever grown them, whereas around 50% had tried them <strong>in</strong> the otherthree Districts.Table 45: Non-user HHs that know about SD <strong>rice</strong> varieties and have grown themHouseholds Jhapa Kapilvastu Saptari Siraha Overall% <strong>of</strong> HHs who know about SD <strong>rice</strong> cvs 79 54 96 32 68% <strong>of</strong> those HHs who have grown SD<strong>rice</strong> cvs 11 57 46 50 38Number <strong>of</strong> HHs <strong>in</strong> sample 24 26 27 19 9646
The number <strong>in</strong> each District <strong>of</strong> non-user HHs that had tried SD <strong>rice</strong> was rather small but,overall, the most frequently mentioned benefit was that <strong>of</strong> be<strong>in</strong>g able to grow w<strong>in</strong>ter crops(vegetables) <strong>in</strong> time (Table 46). Other benefits were mentioned with a frequency <strong>of</strong> around10% – 20% except for ‘high crop density’ and ‘moisture reta<strong>in</strong>ed’, both mentioned by onlyone respondent.Table 46: Percentage <strong>of</strong> non-user HHs who had grown SD <strong>rice</strong> and reported a particularbenefitBenefits* Jhapa Kapilvastu Saptari Siraha OverallIncrease <strong>in</strong> year round production 50 13 0 33 12W<strong>in</strong>ter crops (vegetables) <strong>in</strong> time 50 100 92 67 88High crop density 0 0 0 33 4Low irrigation requirement 0 0 42 0 20Moisture reta<strong>in</strong>ed 0 0 8 0 4Production <strong>in</strong> less fertile land 0 0 33 0 16Production <strong>in</strong> food scarce month 0 0 33 0 16Number <strong>of</strong> HHs <strong>in</strong> sample 2 8 12 3 25*Rank<strong>in</strong>g was not asked for this question.The ma<strong>in</strong> reasons for not grow<strong>in</strong>g project SD <strong>rice</strong> varieties even after hav<strong>in</strong>g tried SD <strong>rice</strong> <strong>in</strong>general were “Don’t know about the varieties”, “unavailability <strong>of</strong> seed” and, to a lesser extent“lack <strong>of</strong> technical knowledge” (Table 47).Table 47: Percentage (A) <strong>of</strong> non-user HHs who have grown SD <strong>rice</strong> who cite any particularreason why they have not grown project SD <strong>rice</strong> varieties and (B) that percentage divided bythe mean rank for that reasonReason Jhapa Kapilvastu Saptari Siraha OverallA B A B A B A B A BDon't know about thevarieties 50 50 88 68 92 56 100 60 88 59Unavailability <strong>of</strong> seed 50 25 63 31 92 46 100 50 80 40Lack <strong>of</strong> market 50 25 13 13 0 0 - 8 5Pests 0 - 0 - 58 16 0 - 28 8Diseases 0 - 0 - 58 14 0 - 28 7Lack <strong>of</strong> tech. knowledge 50 17 13 6 100 38 100 43 68 26Lack <strong>of</strong> family labour 50 50 13 4 8 4 0 - 12 6Lack <strong>of</strong> land 0 - 0 - 8 8 0 - 4 4Lack <strong>of</strong> irrigation 50 50 13 13 0 - 0 - 8 8No. <strong>of</strong> HHs <strong>in</strong> sample 2 2 8 8 12 12 3 3 25 25The most important reasons for not grow<strong>in</strong>g SD <strong>rice</strong> varieties cited by non-users who knewabout SD <strong>rice</strong> but had NOT tried it were “lack <strong>of</strong> irrigation”, “not the best variety for the land”and “lower yield than exist<strong>in</strong>g variety”. “Lack <strong>of</strong> land” and “not suitable for exist<strong>in</strong>g <strong>cropp<strong>in</strong>g</strong>pattern” were not considered very important. (Table 48)47
Table 48: Percentage (A) <strong>of</strong> non-user HHs who know about SD <strong>rice</strong> but have NOT grown itwho cite any particular reason why they have not grown any SD <strong>rice</strong> varieties and (B) thatpercentage divided by the mean rank for that reason.Reason Jhapa Kapilvastu Saptari Siraha OverallA B A B A B A B A BNot the best variety for land 65 51 17 17 57 35 67 33 55 38Lack <strong>of</strong> seed 0 - 67 44 14 6 100 100 23 14Lower yield than exist<strong>in</strong>gvariety 53 32 17 8 79 36 33 33 55 29Not suitable for exist<strong>in</strong>g<strong>cropp<strong>in</strong>g</strong> pattern 18 9 17 6 0 - 0 - 10 4Low consumer preference 29 12 33 8 36 9 0 - 30 9Lower market p<strong>rice</strong> 18 6 17 8 64 23 0 - 33 12Lack <strong>of</strong> family labour 29 21 33 17 21 16 67 33 30 19Lack <strong>of</strong> land 12 4 33 33 0 - 33 33 13 4Lack <strong>of</strong> irrigation 59 37 17 17 43 64 67 67 48 39No. <strong>of</strong> HHs <strong>in</strong> sample 17 17 6 6 14 14 3 3 40 40W<strong>in</strong>ter season legumes (chickpea and lentil)Almost all non-user HHs <strong>in</strong> Jhapa, Saptari and Siraha knew about w<strong>in</strong>ter season legumes(WSLs) but only around half the sample <strong>in</strong> Kapilvastu knew about them (Table 49). However,only 9% <strong>of</strong> the knowledgeable HHs (2 HHs) <strong>in</strong> Jhapa had actually grown them, <strong>in</strong> contrastwith the high proportion <strong>of</strong> HHs <strong>in</strong> the other three Districts that had tried them.Table 49: Non-user HHs that know about w<strong>in</strong>ter season legumes (WSL) and have grownthemHouseholds Jhapa Kapilvastu Saptari Siraha Overall% <strong>of</strong> HHs who know about WSL 96 54 100 100 86% <strong>of</strong> those HHs who have grownWSL 9 86 93 68 63Number <strong>of</strong> HHs <strong>in</strong> sample 24 26 27 19 96In contrast to the case for <strong>rice</strong> (Table 46), respondents were not asked their op<strong>in</strong>ion <strong>of</strong> thepotential benefits <strong>of</strong> WSLs. For those HHs that had grown WSLs before, the ma<strong>in</strong> reasonsfor not grow<strong>in</strong>g project WSL varieties were “Don’t know about the varieties”, “unavailability <strong>of</strong>seed” and “lack <strong>of</strong> technical knowledge” (Table 50). This is a similar pattern <strong>of</strong> response tothat for <strong>rice</strong>.Table 50: Percentage (A) <strong>of</strong> non-user HHs who have grown w<strong>in</strong>ter season legumes (WSL)who cite any particular reason why they have not grown project WSL varieties and (B) thatpercentage divided by the mean rank for that reason.Reason Jhapa Kapilvastu Saptari Siraha OverallA B A B A B A B A BUnknown about the varieties 0 - 75 36 92 47 100 93 87 50Lack <strong>of</strong> seed 50 50 67 33 96 32 77 31 83 31Pests 0 - 58 21 72 19 8 2 50 14Dsease problem 0 - 42 30 72 21 15 4 48 16Lack <strong>of</strong> knowledge 0 - 50 18 92 34 92 40 79 30Theft 50 50 0 - 8 8 0 - 6 6Low moisture 0 - 0 - 4 4 0 - 2 2Lack <strong>of</strong> land 0 - 17 8 4 4 0 - 6 3No. <strong>of</strong> HHs <strong>in</strong> sample 2 2 12 12 25 25 13 13 52 5248
For those non-user HHs that were aware <strong>of</strong> WSLs but had not grown any, the mostimportant reason cited (Table 51) was “high moisture” followed by “lack <strong>of</strong> family labour”,although the responses are highly skewed towards those from Jhapa (where adoption <strong>of</strong>WSLs, i.e. chickpea was very poor). Interest<strong>in</strong>gly, although the most common constra<strong>in</strong>tcited by users for grow<strong>in</strong>g chickpea was pests and diseases (Table 43), non-users barelymentioned it (Table 51).Table 51: Percentage (A) <strong>of</strong> non-user HHs who know about w<strong>in</strong>ter season legumes (WSL)but have NOT grown them who cite any particular reason why they have not grown any WSLvarieties and (B) that percentage divided by the mean rank for that reason.Reason Jhapa Kapilvastu Saptari Siraha OverallA B A B A B A B A BLong duration <strong>rice</strong> varieties 5 2 0 - 0 - 17 8 6 3Damage from graz<strong>in</strong>g 5 5 0 - 0 - 0 - 3 3Lack <strong>of</strong> seed 10 10 100 67 0 - 17 6 16 10Weeds 5 2 0 - 0 - 0 - 3 1Pests 10 3 100 50 0 - 0 - 13 5Lack <strong>of</strong> family labour 48 28 0 - 100 67 33 17 45 26Inadequate technical know how 14 6 0 - 50 13 17 8 16 6No access to draught power 10 10 0 - 50 50 0 - 10 10Lack <strong>of</strong> money 5 2 0 - 50 17 17 6 10 4High moisture 71 47 0 - 0 - 50 50 58 40Lack <strong>of</strong> land 14 9 0 - 0 - 33 33 16 12Unsuitable land/soil 5 2 50 25 0 - 17 17 10 6No. <strong>of</strong> HHs <strong>in</strong> sample 21 21 2 2 2 2 6 6 31 31Spr<strong>in</strong>g season legumes (mungbean)Knowledge <strong>of</strong> spr<strong>in</strong>g season legumes (SSLs) was high <strong>in</strong> Jhapa and Saptari, lower <strong>in</strong> Sirahaand lower still <strong>in</strong> Kapilvastu. In contrast to the case for WSLs, the percentage <strong>of</strong> thoseknowledgeable HHs who had tried SSLs was relatively low (Table 52).Table 52: Non-user HHs that know about spr<strong>in</strong>g season legumes (SSL) and have grownthemHouseholds Jhapa Kapilvastu Saptari Siraha Overall% <strong>of</strong> HHs who know about SSL 92 27 93 79 72% <strong>of</strong> those HHs who have grownSSL 36 57 16 33 30Number <strong>of</strong> HHs <strong>in</strong> sample 24 26 27 19 96As for WSLs, respondents were not asked their op<strong>in</strong>ion <strong>of</strong> the potential benefits <strong>of</strong> SSLs.The number <strong>in</strong> each District <strong>of</strong> non-user HHs that had tried SSLs was rather small (Table53). Overall, however, their pattern <strong>of</strong> response was very similar to that for SD <strong>rice</strong> andWSLs, i.e. “Don't know about the varieties” followed by “Lack <strong>of</strong> seed” and “Lack <strong>of</strong>knowledge” were the most frequently cited, and perceived to be the most important, reasonsfor not grow<strong>in</strong>g them.49
Table 53: Percentage (A) <strong>of</strong> non-user HHs who have grown spr<strong>in</strong>g season legumes (SSL)who cite any particular reason why they have not grown project SSL varieties and (B) thatpercentage divided by the mean rank for that reasonReason Jhapa Kapilvastu Saptari Siraha OverallA B A B A B A B A BDon't know about the varieties 50 33 50 25 75 45 100 83 67 44Lack <strong>of</strong> seed 50 29 100 80 100 29 100 50 81 38Pests 13 6 75 28 75 20 0 - 33 11Disease 0 - 25 25 75 28 0 - 19 8Lack <strong>of</strong> knowledge 38 16 0 - 100 36 80 29 52 20Low moisture 13 13 0 - 25 13 0 - 10 6Lack <strong>of</strong> irrigation 13 13 0 - 0 - 0 - 5 5Need <strong>of</strong> <strong>in</strong>tensive care 13 6 25 8 0 - 0 - 10 4No. <strong>of</strong> HHs <strong>in</strong> sample 8 8 4 4 4 4 5 5 21 21“Lack <strong>of</strong> irrigation”, “lack <strong>of</strong> labour” and “lack <strong>of</strong> seed” were the ma<strong>in</strong> reasons cited by HHswho knew about SSLs but had never grown them (Table 54).Table 54: Percentage (A) <strong>of</strong> non-user HHs who know about spr<strong>in</strong>g season legumes (SSL)but have NOT grown them who cite any particular reason why they have not grown any SSLvarieties and (B) that percentage divided by the mean rank for that reasonReason Jhapa Kapilvastu Saptari Siraha OverallA B A B A B A B A BPlace for livestock graz<strong>in</strong>g 0 - 33 17 0 - 0 - 2 1Encroachment from wildanimals 0 - 33 7 0 - 30 15 8 3Lack <strong>of</strong> seed 21 13 67 27 76 20 50 23 54 17Lack <strong>of</strong> other <strong>in</strong>puts 7 2 33 11 71 18 0 - 35 9Weeds 7 4 0 - 5 1 0 - 4 1Insects/Pests 36 15 0 - 86 23 0 - 48 14Disease 7 2 0 - 81 19 0 - 38 9Lack <strong>of</strong> labour 43 26 0 - 57 21 50 31 48 22Lack <strong>of</strong> knowledge on how togrow 36 22 0 - 86 24 60 33 60 21No access to draft power 21 16 0 - 43 19 20 13 29 15Lack <strong>of</strong> family labour 7 7 0 - 10 6 10 10 8 7Lack <strong>of</strong> irrigation 93 67 67 67 33 29 20 13 50 39Unsuitable land/soil 14 7 33 17 5 1 10 10 10 4No. <strong>of</strong> HHs <strong>in</strong> sample 14 14 3 3 21 21 10 10 48 48Non-users’ <strong>in</strong>tentionsRiceOnly around 50% <strong>of</strong> non-users <strong>in</strong>tended to grow SD <strong>rice</strong> the follow<strong>in</strong>g year (Table 55). Ofthose <strong>in</strong>tend<strong>in</strong>g to grow SD <strong>rice</strong>, most (61%) <strong>in</strong>tended to get seed from a neighbour (Table56) while 30% said that they would use their own seed which implies that, s<strong>in</strong>ce they arenon-users <strong>of</strong> project varieties, they <strong>in</strong>tend to grow other, non-project SD <strong>rice</strong> varieties.50
Table 55: Percentage <strong>of</strong> non-user HHs <strong>in</strong>tend<strong>in</strong>g to grow short duration <strong>rice</strong> next yearHouseholds Jhapa Kapilvastu Saptari Siraha Overall% <strong>in</strong>tend<strong>in</strong>g to grow SD <strong>rice</strong> nextyear 50 42 59 63 53Number <strong>of</strong> HHs <strong>in</strong> sample 24 26 27 19 96Table 56: Percentage <strong>of</strong> non-user HHs <strong>in</strong>tend<strong>in</strong>g to grow SD <strong>rice</strong> next year – <strong>in</strong>tendedsource <strong>of</strong> seedSource <strong>of</strong> seed Jhapa Kapilvastu Saptari Siraha OverallNeighbour 58 82 38 75 61Agrovet 8 27 0 17 12Own 17 9 75 8 31Nearby agricultural farm (i.e. NARCfarm) 17 0 0 8 6Bazaar 0 0 6 0 2FORWARD 0 9 25 0 10Number <strong>of</strong> HHs <strong>in</strong> sample 12 11 16 12 51The ma<strong>in</strong> reasons why non-users were not go<strong>in</strong>g to grow SD <strong>rice</strong> next year were “lack <strong>of</strong>family labour” and “lack <strong>of</strong> land” (Table 57). Lack <strong>of</strong> seed was not deemed to be an importantconstra<strong>in</strong>t.Table 57: Reasons why HHs (%) do not <strong>in</strong>tend to grow SD <strong>rice</strong> next yearReasons cited Jhapa Kapilvastu Saptari Siraha OverallLack <strong>of</strong> family labour 42 7 27 0 20Lack <strong>of</strong> land 25 33 45 43 36Lack <strong>of</strong> irrigation 50 0 0 0 13Unavailability <strong>of</strong> seed 0 7 0 14 4High moisture 0 7 0 14 4Unknown about varieties 0 0 0 29 4Low production 0 13 27 0 11Unsuitable land 0 13 9 0 7Low consumer preference 0 13 0 0 4Lack <strong>of</strong> market 0 7 0 0 2Number <strong>of</strong> HHs <strong>in</strong> sample 12 15 11 7 45ChickpeaOnly 8% (2) <strong>of</strong> HHs <strong>in</strong>tended to grow chickpea the follow<strong>in</strong>g year <strong>in</strong> Jhapa (where chickpeadoes not grow well) whereas 21% to 44% said that they would grow it the next year <strong>in</strong> theother three Districts (Table 58). Intend<strong>in</strong>g growers reported that they would seek seed from avariety <strong>of</strong> sources (Table 59) <strong>in</strong>clud<strong>in</strong>g FORWARD, neighbours, the bazaar, Agrovets andeven use their own seed (aga<strong>in</strong> imply<strong>in</strong>g that they <strong>in</strong>tend to grow non-project varieties).Table 58: Percentage <strong>of</strong> HHs <strong>in</strong>tend<strong>in</strong>g to grow chickpea next yearHouseholds Jhapa Kapilvastu Saptari Siraha Overall% <strong>in</strong>tend<strong>in</strong>g to grow chickpea nextyear 8 38 44 21 29Number <strong>of</strong> HHs <strong>in</strong> sample 24 26 27 19 9651
Table 59: Percentage <strong>of</strong> HHs <strong>in</strong>tend<strong>in</strong>g to grow chickpea next year – <strong>in</strong>tended source <strong>of</strong>seed.Source <strong>of</strong> seed Jhapa Kapilvastu Saptari Siraha OverallOwn 50 10 33 0 21Neighbour 50 50 25 0 32Bazaar 0 0 25 75 21Agrovet 0 30 0 50 18Farmers' group 0 0 0 25 4FORWARD 0 40 50 0 36Number <strong>of</strong> HHs <strong>in</strong> sample 2 10 12 4 28Non-users who did not <strong>in</strong>tend to grow chickpea the next year cited “lack <strong>of</strong> land” mostfrequently (31%) as a reason, followed by “lack <strong>of</strong> irrigation”, “<strong>in</strong>sects”, “lack <strong>of</strong> seed” and“low yield/production” (Table 60). On average, non-users owned less (13.5 kattha) mediumland (generally the land type most suited to chickpea cultivation) than users (22.7 kattha).It is <strong>in</strong>terest<strong>in</strong>g that non-users <strong>in</strong> Jhapa, where chickpea is known to perform poorly, no-onecited <strong>in</strong>sects and pests were not mentioned, although “low yield/production” was cited by41% (9) HHs. No-one cited “lack <strong>of</strong> technical knowledge” but it seems likely that non-usersare not particularly knowledgeable about chickpea cultivation.Table 60: Reasons (%) why HHs do NOT <strong>in</strong>tend to grow chickpea next yearReasons cited Jhapa Kapilvastu Saptari Siraha OverallUnfruit<strong>in</strong>g 5 0 0 0 1Unsuitable land/soil 5 13 7 13 9High moisture 5 0 0 13 4Low yield/production 32 0 7 0 12Lack <strong>of</strong> irrigation 41 0 7 7 16Lack <strong>of</strong> family labour 14 6 20 7 12Lack <strong>of</strong> land 14 38 53 27 31Theft 0 0 20 20 9Lack <strong>of</strong> seed 0 0 0 13 3Insects 0 38 13 13 15Disease 0 6 13 0 4Low market p<strong>rice</strong> 0 0 7 0 1Low moisture 5 0 7 0 3Prefer lentil rather chickpea 0 0 7 0 1Lack <strong>of</strong> technical knowledge 0 6 0 0 1Number <strong>of</strong> HHs <strong>in</strong> sample 22 16 15 15 6852
MungbeanThe number <strong>of</strong> non-users who <strong>in</strong>tended to grow mungbean was quite small (Table 61).Overall, the percentage <strong>of</strong> non-user HHs <strong>in</strong>tend<strong>in</strong>g to grow mungbean averaged 36%,rang<strong>in</strong>g from 22% <strong>in</strong> Saptari and 58% <strong>in</strong> Siraha. They <strong>in</strong>tended to obta<strong>in</strong> seed predom<strong>in</strong>antlyfrom neighbours and, to a lesser extent Agrovets and FORWARD (Table 62). A significantproportion <strong>of</strong> <strong>in</strong>tend<strong>in</strong>g HHs <strong>in</strong> Jhapa and Saptari planned to use their own seed <strong>of</strong>,presumably, non-project varieties.Table 61: Percentage <strong>of</strong> HHs <strong>in</strong>tend<strong>in</strong>g to grow mungbean next yearHouseholds Jhapa Kapilvastu Saptari Siraha Overall% <strong>in</strong>tend<strong>in</strong>g to grow mungbean nextyear 38 35 22 58 36Number <strong>of</strong> HHs <strong>in</strong> sample 24 26 27 19 96Table 62: Percentage <strong>of</strong> HHs <strong>in</strong>tend<strong>in</strong>g to grow mungbean next year – <strong>in</strong>tended source <strong>of</strong>seedSource <strong>of</strong> seed Jhapa Kapilvastu Saptari Siraha OverallNeighbour 78 67 33 82 69Own 22 0 33 0 11Bazaar 0 0 33 18 11Agrovet 0 56 0 18 20Farmers' group 0 0 0 9 3FORWARD 0 22 33 9 14Nearby agricultural farm (i.e. NARCfarm) 0 0 0 9 3Number <strong>of</strong> HHs <strong>in</strong> sample 9 9 6 11 35HHs not <strong>in</strong>tend<strong>in</strong>g to grow mungbean cited most frequently “lack <strong>of</strong> irrigation”, “lack <strong>of</strong> familylabour”, “low moisture” and “lack <strong>of</strong> land” as their reasons why not (Table 63). “Lack <strong>of</strong>irrigation” and “low moisture” reflect the reality <strong>of</strong> try<strong>in</strong>g to grow mungbean with theunpredictable ra<strong>in</strong>fall <strong>of</strong> the spr<strong>in</strong>g season.Table 63: Reasons (%) why HHs do NOT <strong>in</strong>tend to grow mungbean next yearReasons cited Jhapa Kapilvastu Saptari Siraha OverallLack <strong>of</strong> family labour 40 18 19 13 23Lack <strong>of</strong> high yield<strong>in</strong>g variety 7 0 0 0 2Unsuitable land/soil 7 12 5 0 7High moisture 7 6 0 0 3Lower yield than other crops 13 6 0 0 5Lack <strong>of</strong> land 20 24 5 38 18Lack <strong>of</strong> draft power 7 0 0 0 2Lack <strong>of</strong> irrigation 47 18 19 0 23Insects 7 0 5 13 5Disease 0 0 5 0 2Low moisture 0 6 48 13 20Problem <strong>of</strong> stray animals 0 12 0 13 5Problem <strong>of</strong> harvest<strong>in</strong>g 0 6 0 0 2Number <strong>of</strong> HHs <strong>in</strong> sample 15 17 21 8 6153
Extent <strong>of</strong> adoption and susta<strong>in</strong>abilityThis study did not sample any HHs <strong>in</strong> non-project villages so there are no estimates <strong>of</strong>village-to-village spread. With<strong>in</strong> project villages, however, overall adoption <strong>of</strong> new <strong>rice</strong>varieties was the most high-pr<strong>of</strong>ile impact <strong>of</strong> the project as, when adopted, they were grownon an average <strong>of</strong> 0.1 to 0.23 ha (9% to 24% <strong>of</strong> HH land). Us<strong>in</strong>g data <strong>in</strong> Tables 19 and 20 it ispossible to calculate that 65.5 ha were sown with project <strong>rice</strong> varieties by the users sampled.S<strong>in</strong>ce total land owned by user HHs <strong>in</strong> the 22 sampled villages was 663 ha (1.05 ha x 630user HHs identified dur<strong>in</strong>g group discussions), these varieties were be<strong>in</strong>g grown on morethan 140 ha <strong>in</strong> those villages. Adoption <strong>of</strong> <strong>in</strong>dividual varieties varied by district and by variety,however. Particularly successful were Barkhe 2014 <strong>in</strong> Saptari where 36 households (50% <strong>of</strong>the sample) grew it on an average <strong>of</strong> 0.47 ha (43% <strong>of</strong> their land) and BG 1442 <strong>in</strong> Jhapawhere 82 households (99% <strong>of</strong> the households sampled) grew it as a spr<strong>in</strong>g (Chaite) crop onan average <strong>of</strong> 0.46 ha. Although project chickpea and mungbean varieties were adopted bysignificant numbers <strong>of</strong> HHs (apart from chickpea <strong>in</strong> Jhapa) they were grown on much smalleramounts <strong>of</strong> land per HH and production was much less than for <strong>rice</strong>. The PVS approach wasvery effective <strong>in</strong> match<strong>in</strong>g varieties to farmers’ needs for particular situations.The percentage <strong>of</strong> HHs grow<strong>in</strong>g project <strong>rice</strong> varieties and the amount per HH <strong>of</strong> land used togrow them <strong>in</strong>creased steadily from 2004 to 2008 (Fig 3). That was also the case formungbean (Fig. 5) whereas the proportion <strong>of</strong> HHs grow<strong>in</strong>g chickpea and the amount <strong>of</strong> landthey used to grow them rema<strong>in</strong>ed relatively constant over the same period (Fig. 4). S<strong>in</strong>ceHHs seem to be sav<strong>in</strong>g enough seed to at least ma<strong>in</strong>ta<strong>in</strong> these areas it is possible to <strong>in</strong>ferthat use <strong>of</strong> these varieties, by HHs that perceive them to be useful, can be susta<strong>in</strong>ed with<strong>in</strong>the constra<strong>in</strong>ts <strong>of</strong> land availability.It is not possible to estimate the susta<strong>in</strong>ability <strong>of</strong> the more knowledge-based RRCtechnologies. While adoption <strong>of</strong> seed prim<strong>in</strong>g and <strong>of</strong> improved compost<strong>in</strong>g, for <strong>in</strong>stance,were estimated to be around 50% and 40%, respectively, <strong>of</strong> the number <strong>of</strong> HHs <strong>in</strong>itiallytra<strong>in</strong>ed, there is no <strong>in</strong>formation on whether or not user HHs <strong>in</strong>tend to cont<strong>in</strong>ue to use thesetechnologies. S<strong>in</strong>ce these technologies require few or no resources to implement, future usewill not be constra<strong>in</strong>ed by anyth<strong>in</strong>g other than HHs’ perception <strong>of</strong> whether they cont<strong>in</strong>ue togive benefits.54
ConclusionsThe project, the impact <strong>of</strong> which this survey attempts to evaluate, was highly complex. Itused a community-development type approach <strong>in</strong> which many different technologies, andcomb<strong>in</strong>ations <strong>of</strong> technologies, were made available to farm<strong>in</strong>g households. The technologiesthemselves were both plant-based (new varieties) that could be readily tested by farmerswithout much additional project <strong>in</strong>volvement, and knowledge-based (e.g. seed prim<strong>in</strong>g,improved compost<strong>in</strong>g) <strong>in</strong>terventions that required vary<strong>in</strong>g degrees <strong>of</strong> farmer tra<strong>in</strong><strong>in</strong>g. It isperhaps <strong>in</strong>evitable, then, that the impact <strong>of</strong> <strong>in</strong>dividual technologies would be difficult todeterm<strong>in</strong>e, and that has, <strong>in</strong>deed, been the case.Nevertheless, it is reasonably clear that new <strong>rice</strong> varieties have been adopted throughout thefour districts, although different varieties have found favour <strong>in</strong> different districts. Somefarmers are grow<strong>in</strong>g some <strong>rice</strong> varieties on significant portions <strong>of</strong> their land. Similarly, projectvarieties <strong>of</strong> chickpea and mungbean are also be<strong>in</strong>g grown by appreciable numbers <strong>of</strong>households. A limited amount <strong>of</strong> <strong>in</strong>formation suggests that the number <strong>of</strong> householdsadopt<strong>in</strong>g new varieties, and the area <strong>of</strong> land that each household sows, <strong>of</strong> all three crops areat least be<strong>in</strong>g ma<strong>in</strong>ta<strong>in</strong>ed and may be <strong>in</strong>creas<strong>in</strong>g.Availability <strong>of</strong> land is the key issue for projects that seek to improve livelihoods by <strong>in</strong>creas<strong>in</strong>gagricultural productivity. Average land hold<strong>in</strong>g per household is very small <strong>in</strong> the projectvillages and even very large relative <strong>in</strong>creases <strong>in</strong> crop production are not very large <strong>in</strong>absolute terms. Nevertheless, households are <strong>of</strong> the op<strong>in</strong>ion that adoption <strong>of</strong> these newvarieties has <strong>in</strong>creased food gra<strong>in</strong> self sufficiency quite substantially, although the largestga<strong>in</strong>s reported are where adoption <strong>of</strong> <strong>rice</strong> varieties has been the greatest. This is because<strong>rice</strong> is more productive than legumes and the new <strong>rice</strong> varieties can be grown on larger landareas (chickpea and mungbean require specific land types <strong>of</strong> which HHs have relativelylittle).It is noteworthy that non-users were significantly less well <strong>of</strong>f than users (Poverty Index <strong>of</strong>non-users = 4.18; for users = 5.84) and non-users own significantly less total land (0.7 ha)than users (1.05 ha) and the disparity is even greater for irrigated land (0.15 ha versus 0.35ha). It may be that non-users’ relative scarcity <strong>of</strong> suitable land is a major factor <strong>in</strong> notadopt<strong>in</strong>g the project varieties but, <strong>in</strong>terest<strong>in</strong>gly, although lack <strong>of</strong> land was occasionally citedby non-users as a reason for non-adoption it was never cited as a major reason.The impact <strong>of</strong> knowledge-based technologies is much harder to evaluate than that <strong>of</strong>varieties. Although specific technologies such as seed prim<strong>in</strong>g have been adopted by around50% <strong>of</strong> the number <strong>of</strong> households <strong>in</strong>itially tra<strong>in</strong>ed, we have no <strong>in</strong>formation on the spread withtime <strong>of</strong> the technologies (time-course <strong>in</strong>formation was only gathered for crops); neither dowe know if farmers considered that such technologies had contributed to the changesreported <strong>in</strong> food gra<strong>in</strong> self sufficiently (the question was specifically limited to varieties).Overall, although appreciable numbers <strong>of</strong> farmers cited “<strong>in</strong>creased yield” as a benefit <strong>of</strong> seedprim<strong>in</strong>g, it was not ranked as be<strong>in</strong>g very important compared with benefits concern<strong>in</strong>ggerm<strong>in</strong>ation, stand establishment etc., and “<strong>in</strong>creased yield” was not mentioned at all as abenefit <strong>of</strong> improved compost<strong>in</strong>g, IPM or IPNM. We can assume that, as long as farmerscont<strong>in</strong>ue to perceive benefits from these relatively simple technologies, they will cont<strong>in</strong>ue toemploy them.Surround<strong>in</strong>g non-project villages were not surveyed and accurate <strong>in</strong>formation on the spread<strong>of</strong> the new varieties elsewhere <strong>in</strong> the districts is not available so it is not possible to estimatethe overall impact <strong>of</strong> the project. We can conclude however that, with<strong>in</strong> the project villagessampled, there has been substantial adoption <strong>of</strong> a range <strong>of</strong> technologies and the farmersreport that, s<strong>in</strong>ce those technologies have been available, food gra<strong>in</strong> self sufficiency hasimproved.55
ReferencesSubbarao, G. V., Kumar Rao, J. V. D. K., Kumar, J., Johansen, C., Deb, U. K., Ahmed, I.,Krishna Rao, M. V., Venkataratnam, L., Hebbar, K. R., SeshaSai, M. V. R., and Harris, D. (2001). Spatial distribution and quantification <strong>of</strong> <strong>rice</strong>-<strong>fallows</strong> <strong>in</strong>South Asia – potential for legumes. Patancheru 502324, Andhra Pradesh, India:International Crops <strong>Research</strong> Institute for the Semi-Arid Tropics. 316 pp. ISBN 92-9066-436-3.Khanal, N.N., Harris, D., Joshi, K.D., Sherpa, L.T., Thapa, S. and Giri, R. K. (2004).Potentiality <strong>of</strong> <strong>in</strong>tegrat<strong>in</strong>g mungbean <strong>in</strong> cereal <strong>fallows</strong> <strong>in</strong> the low hills and terai <strong>of</strong> <strong>Nepal</strong>Proceed<strong>in</strong>gs <strong>of</strong> the 24th National Summer Crops Workshop (Gra<strong>in</strong> Legumes). National Gra<strong>in</strong>Legumes <strong>Research</strong> Program, <strong>Nepal</strong> Agriculture <strong>Research</strong> Council. 10p56
ANNEXESANNEX 1RFA HOUSEHOLD SURVEY QUESTIONNAIRE FOR RRC GROWERS IN NEPALInterview Information1. Enumerator Name2. Date <strong>of</strong> survey Day Month Year3. District4. Village5. Gaon or Tole name(hamlet name)Household Pr<strong>of</strong>ile6. Household head Male/Female7. Name <strong>of</strong> respondent8. Family status <strong>of</strong> the respondent a. Male household headb. Female household headc. Wife <strong>of</strong> household headd. Husband <strong>of</strong> household heade. Sonf. Daughterg. Others, please specify9. Type <strong>of</strong> ro<strong>of</strong> a. Thatchedb. Tiles/GI sheetc. Concrete10. What type <strong>of</strong> traction do you use? a. Own animalb. Rented animalc. Own tractord. Rented tractore. Others, please name11. For how many months <strong>in</strong> a normal year doyour home-grown cereals (<strong>rice</strong>, maize,wheat etc) feed the households?……….months57
Household composition12. Caste/ethnicity a. Dalitb. Janjatic. Terai groupd. Brahm<strong>in</strong>/Chhetri, Neware. Others13. No. <strong>of</strong> adults (18 years old and above): Male…… Female…..14. No <strong>of</strong> children aged 10-17 Male…… Female…..15. No <strong>of</strong> children aged under 10 Male…… Female…..16. No. <strong>of</strong> HH members who regularly work onfarmMale…… Female…..17. Farm Pr<strong>of</strong>ileLand hold<strong>in</strong>gTotal land owned by respondentTotal land cultivated by respondentIrrigated land cultivated by respondentLand rented out by respondentLand shared out by respondentKattha†: only unit allowedUpland Medium land Low land† Bigha = 6667; Kattha = 338 m 218. Does your household cultivate any land other than your own? Yes……No…..If yes,Land hold<strong>in</strong>gLand rented <strong>in</strong> by respondentLand shared <strong>in</strong> by respondentKattha†: only unit allowedUpland Medium land Low land19. If you have Irrigation, what is the source <strong>of</strong>water?a. Canalb. Tube wellc. Open welld. Ponde. Riverf. Treadle pumpg. Others58
20. In 2007 ma<strong>in</strong> season what crops did you grow on what area?1. RiceBarkhe 1027Barkhe 2001Barkhe2014Sugandha 1PR101OthersCrop Area (Kattha) Kg harvested2. Maize3. Other (please name)4.5.6.7.Total21. In 2007-2008 w<strong>in</strong>ter what crops did you grow on what area? (name varieties <strong>of</strong> chickpea)1. ChickpeaKPG 59AwarodhiTaraICCV2KAK 2Others2. Lentil3. Wheat4. Mustard5. Maize6. Other (please name)7.TotalCrop Area (Kattha) Kg harvested22. In 2008 spr<strong>in</strong>g what crops did you grow on what area? (name varieties <strong>of</strong> mungbean)Crop Area (Kattha) Kg harvested1. MungbeanKalyanPrateekshaNM92VC39602. Maize3. Other (please name)4.5.6.7.Total59
23. Did you grow any w<strong>in</strong>ter crops on your khet land (after harvest<strong>in</strong>g <strong>rice</strong>) BEFORE fiveyears? YES___NO____If YES, what were they (Please list).What was your total w<strong>in</strong>ter crop area <strong>in</strong> a typical year?24. Did you grow any spr<strong>in</strong>g crops on your khet land (<strong>in</strong> <strong>rice</strong> fallow areas OR after harvest<strong>in</strong>gw<strong>in</strong>ter crops, e.g. vegetables, potato, wheat, lentil, chickpea) BEFORE five years?YES___NO____If YES, what were they (Please list).What was your total spr<strong>in</strong>g crop area <strong>in</strong> a typical year?25. Where did you first get the seeds <strong>of</strong> chickpea, mungbean and <strong>rice</strong> from?VarietyChickpeaKPG 59AwarodhiTaraICCV2KAK 2OthersMungbeanKalyanPrateekshaNM92VC3960RiceBarkhe 1027Barkhe 2001Barkhe2014Sugandha 1PR101OthersYear <strong>of</strong> first<strong>in</strong>troductionHow much seed didyou receive?Who from?26. Please describe your area <strong>of</strong> chickpea, mungbean and <strong>rice</strong> you grew dur<strong>in</strong>g last fouryears?Year2007-082006-072005-062004-05Area COB/PVS varieties<strong>of</strong> <strong>rice</strong> (Kattha)Area chickpea(Kattha)Area mungbean(Kattha)60
27. What are the benefits your household ga<strong>in</strong>s from grow<strong>in</strong>g chickpea/mungbean/<strong>rice</strong>?ReasonSource <strong>of</strong> cashIncrease consumption <strong>of</strong> legumesIncrease consumption <strong>of</strong> <strong>rice</strong>Increase food self sufficiency monthsBetter healthReduce or avoid migrationIncrease soil fertilityIncrease fodder for livestockOther (please name)YES / NORank - only if YES.(1 = most important)28. What happened to the chickpea/mungbean/<strong>rice</strong> your household grew?<strong>Use</strong> <strong>of</strong> chickpea, mungbean,<strong>rice</strong>RiceSold as gra<strong>in</strong>Sold as seedEaten by familySaved for seedGiven as giftOther (e.g. eaten by livestock)ChickpeaSold as gra<strong>in</strong>Sold as seedEaten by familySaved for seedGiven as giftOther (e.g. eaten by livestock)MungbeanSold as gra<strong>in</strong>Sold as seedEaten by familySaved for seedGiven as giftOther (e.g. eaten by livestock)This year (2007/2008) Last year (2006/2007)AmountP<strong>rice</strong> perP<strong>rice</strong> per kg Amount (kg)(kg)kg29. From the 2007/08 harvest did your household supply mungbean/chickpea/<strong>rice</strong> for seed?YES __ NO __Ricea. If YES, to whom seed was supplied?To whom did yousupply seed?What variety didyou supply?How far away?(km)How much didyou supply?(kg)Type <strong>of</strong>transaction †61
ChickpeaMungbean† 1. Exchange; 2. Gift; 3. Sold; 4. Seed Bank; 5. Other.30. Have you received tra<strong>in</strong><strong>in</strong>g or <strong>in</strong>formation on how to grow chickpea/COB/PVS<strong>rice</strong>/mungbean?YES __ NO __If YES, from whom…………………….and when?31. Did anyone <strong>in</strong> your household migrate <strong>in</strong> the last year (2007-2008)? YES __ NO __a. If YES, how many people? ………………………………….b. Who are they? Please circle correct answer.a. Male household headb. Female household headc. Wife <strong>of</strong> household headd. Husband <strong>of</strong> household heade. Sonf. Daughterg. Others, please specify……………Record the details for each HH member who migrated <strong>in</strong> the follow<strong>in</strong>g table. (please recordthe number <strong>of</strong> weeks on migration)H<strong>in</strong>ts for enumerator to get <strong>in</strong>formation for question c(please ask the follow<strong>in</strong>g questions <strong>in</strong> sequence):• Who migrated;• How many times <strong>in</strong> the year;• When was the first trip;• First trip - for how long (weeks)• When was the second trip• Second trip - for how long (weeks)62
Who migrates? Jul A S O N D Jan F M A May June TotalweeksMale HH headFemale HH headWife <strong>of</strong> HH headHusband <strong>of</strong> HH headSonDaughterOthers, please specify32. Before your household started to grow COB/PVS <strong>rice</strong>/mungbean/chickpea, how manypeople used to migrate <strong>in</strong> a typical year?...........................................33. Before your household started to grow COB/PVS <strong>rice</strong>/mungbean/chickpea, who used tomigrate? (Male HH head / Female HH head/wife <strong>of</strong> HH head /husband <strong>of</strong> HH head/son /daughter / other………. please name)If there is any changes <strong>in</strong> migration patterna. Please describe <strong>in</strong> detail how they have changed…………………………………………………………………………………………………………………………..b. Please expla<strong>in</strong> WHY your migration patterns havechanged……………………………….………………………………………………………………………………….c. Are you happy with these changes? YES __ NO __34. Does your household have any problems grow<strong>in</strong>g chickpea/mungbean/<strong>rice</strong>? YES __ NO__35. If YES, what are they? (PLEASE DO NOT READ OUT LIST ONLY TICK IFRESPONDENT MENTIONS)a. Rice COB/PVSReasonDamage from graz<strong>in</strong>gEncroachment from wild animalsLack <strong>of</strong> marketLack <strong>of</strong> seedLack <strong>of</strong> other <strong>in</strong>putsYES / NORank – only if YES.(1 = most important)63
WeedsPestsDiseasesLack <strong>of</strong> labourInadequate technical know howInadequate access to irrigationNo access to draft powerOther (please name)b. ChickpeaReasonTheftDamage from graz<strong>in</strong>gEncroachment from wild animalsLack <strong>of</strong> marketLack <strong>of</strong> seedLack <strong>of</strong> other <strong>in</strong>putsWeedsPestsDiseasesLack <strong>of</strong> labourInadequate technical know howToo late to sow after <strong>rice</strong> harvestNo access to draft powerOther (please name)YES / NORank – only if YES.(1 = most important)c. MungbeanReasonDamage from graz<strong>in</strong>gEncroachment from wild animalsLack <strong>of</strong> marketLack <strong>of</strong> seedLack <strong>of</strong> other <strong>in</strong>putsWeedsPestsDiseasesLack <strong>of</strong> labourLack <strong>of</strong> knowledge on how to growToo late to sow after <strong>rice</strong> harvestNo access to draft powerOther (please name)YES / NORank – only if YES.(1 = most important)36. If you have grown COB and PVS <strong>rice</strong>/Chickpea/Mungbean, has the adoption <strong>of</strong> thesevarieties changed your household food self sufficiency? (YES_____NO_____)a. If YES, what was your average food self sufficiency?Before …………(months)After …………(months)64
37. If you have grown COB and PVS, have you grown chickpea after it <strong>in</strong> the same field?YES __ NO __a. If YES, does it make a difference to when you sow chickpea? YES __ NO __b. If YES, please expla<strong>in</strong> …………………………………………………………...38. If you have grown new Mungbean and Chickpea, is the <strong>rice</strong> yield on the same fieldchanged after Mungbean?YES __ NO __c. If YES, how has it changed? (a) Increased (b) decreasedd. Please also expla<strong>in</strong> possiblereasons…………………………………………………………...39. Have you adopted one <strong>of</strong> the follow<strong>in</strong>g RRC technologies? (Please circle the one or moreappropriate technologies)a. Seed prim<strong>in</strong>gb. Compost<strong>in</strong>gc. IPM/IPNM40. If you have adopted the technologie/s, <strong>in</strong> which crops you have adopted?CropsTechnologie/sCOB/PVS <strong>rice</strong>ChickpeaMungbean41. What are the benefits your household ga<strong>in</strong>s by the follow<strong>in</strong>g RRC technologie/s?Seed Prim<strong>in</strong>gReasonHigher germ<strong>in</strong>ationQuick germ<strong>in</strong>ationDrought resistancePlant vigorIncrease yieldOther please specifyYES / NORank - only if YES.(1 = most important)65
Compost<strong>in</strong>gReasonIncrease soil fertilityLow cost <strong>of</strong> productionHigh product p<strong>rice</strong>Increase crop self lifeOther please specifyYES / NORank - only if YES.(1 = most important)IPM/IPNMReasonIncrease soil fertilityLow cost <strong>of</strong> productionHigh product p<strong>rice</strong>Disease resistance/controlInsect/Pest controlOther please specifyYES / NORank - only if YES.(1 = most important)66
ANNEX 2RFA HOUSEHOLD SURVEY QUESTIONNAIRE FOR RRC NON-GROWERS INNEPALInterview Information1. Enumerator Name2. Date <strong>of</strong> survey Day ……… Month ………Year…………3. District4. Village5. Gaun or Tole name(hamlet name)6. Household Pr<strong>of</strong>ile7. Household head Male/Female8. Name <strong>of</strong> respondent9. Family status <strong>of</strong> the respondent(PLEASE CIRCLE CORRECT ANSWER)10. LIVESTOCK OWNERSHIP(GIVE THE NUMBER OF ADULT ANIMALS)11. Type <strong>of</strong> ro<strong>of</strong>(PLEASE CIRCLE CORRECT ANSWER)h. Male household headi. Female household headj. Wife <strong>of</strong> household headk. Husband <strong>of</strong> household headl. Son <strong>of</strong> household headm. Daughter <strong>of</strong> household headn. Others, please specifyo. Cow …………..p. Buffalo ……….q. Goat …………..r. Pig …………..s. Poultry ………….t. Others (specify)………….u. Thatchedv. Tiles/GI sheetw. Concrete12. What type <strong>of</strong> traction do you use? x. Own animal67
(PLEASE CIRCLE CORRECT ANSWER)13. For how many months <strong>in</strong> a normal year doyour home-grown cereals (<strong>rice</strong>, maize,wheat etc) feed the households?y. Rented animalz. Own tractoraa. Rented tractorbb. Others, please name……….monthsHousehold composition14. Caste/ethnicity(PLEASE CIRCLE CORRECT ANSWER)cc. Dalitdd. Janjatiee. Terai caste groupsff. Brahm<strong>in</strong>/Chhetri, Newargg. Others15. No. <strong>of</strong> adults (18 years old and above): Male…… Female…..16. No <strong>of</strong> children aged 10-17 Male…… Female…..17. No <strong>of</strong> children aged under 10 Male…… Female…..18. No. <strong>of</strong> HH members who are full time jobholder and contribute <strong>in</strong>come to HH19. No. <strong>of</strong> HH members who regularly work onfarmFarm pr<strong>of</strong>ile20. Land hold<strong>in</strong>gNote:Land ownedKattha†: only unit allowedUpland Medium land Low landTotal land owned by respondent’shouseholdLand cultivated by respondent’shouseholdIrrigated land cultivated by respondent’shouseholdLand rented out by respondent’shouseholdLand shared out by respondent’shousehold† 1 Bigha = 6667; 1 Kattha = 338 m 2 1.5 Bigha = 1 ha, 20 Kattha = 1 Bigha68
20. Do you irrigate any <strong>of</strong> your crops? Yes/No21. If yes, what is the source <strong>of</strong> water? hh. canalii. deep tube welljj. shallow tube wellkk. Treadle pumpll. pondmm. Rivernn. others22. Does your household cultivate any land other than your own? Yes……No…..If yes,Land hold<strong>in</strong>gLand rented <strong>in</strong> by respondent’s householdLand shared <strong>in</strong> by respondent’s householdKattha†: only unit allowedUpland Medium land Low land23. In the last year’s ma<strong>in</strong>, w<strong>in</strong>ter (2007-08) and spr<strong>in</strong>g (2008) season what crops did yougrow and how much did you harvest?Crop1. Ma<strong>in</strong> seasonRicePs tick aga<strong>in</strong>steach crop grownKg harvestedSource <strong>of</strong> seedMaizeOther (please name)2. W<strong>in</strong>ter seasonChickpeaWheatLentilMustardL<strong>in</strong>seedMaizeKidney beanOthers (please name)3. Spr<strong>in</strong>g seasonMungbeanRiceMaizeMungbean69
Others (please name)Source <strong>of</strong> seed Own =O; Market =M; Friend =F; Relative =R; DOA=DOA; NGO=NGO, other(If the family do not grow w<strong>in</strong>ter/Spr<strong>in</strong>g crops after ma<strong>in</strong> season then go to questionno 24)24. What are the reasons for not grow<strong>in</strong>g w<strong>in</strong>ter/Spr<strong>in</strong>g crops?ReasonLack <strong>of</strong> Technical know-howCan not obta<strong>in</strong> seedsLack <strong>of</strong> Suitable varietyLand not suitable forw<strong>in</strong>ter/Spr<strong>in</strong>g cropsNot Pr<strong>of</strong>itable relative to the cost<strong>of</strong> productionPlace for livestock graz<strong>in</strong>g/stayanimalsLack <strong>of</strong> ManpowerMarket <strong>in</strong>accessibilityLow soil fertilityLow moisture/No irrigationHigh moistureSocial cause like theftLack <strong>of</strong> cost/MoneyOther (please, specify)Tick if respondentmentions any reasonRank – only if ticked(1 = most important)25. Do you know about Short duration <strong>rice</strong> varieties? YES………NO…….IF THE ANSWER IS NO THEN GO TO QUESTION NO 31IF THE ANSWER IS YES THEN ASK QUESTION 26 (NEXT QUESTION)26. Have you ever grown short duration <strong>rice</strong> varieties? Yes………NoIF YES ASK QUESTION 27 IF NO, ASK QUESTION 3027. What are those short duration <strong>rice</strong> varieties that you grow?a. ………………………b. ………………………c. ……………………….d. ……………………….70
28. What are the advantages <strong>of</strong> those short duration <strong>rice</strong> varieties that you arepractition<strong>in</strong>g???a………………………………………………………...b………………………………………………………….c………………………………………………………….29. Why are not you adopt<strong>in</strong>g other short duration <strong>rice</strong> varieties like: Barkhe 2001,Barkhe 2014, Ashoka, Pant dhan, Barkhe 1027, BG 1442sugandha-1,ReasonDon’t know about these varietiesNot availableMore devotionLack <strong>of</strong> seedLack <strong>of</strong> marketLack <strong>of</strong> other <strong>in</strong>putsWeedsPestsDiseasesLack <strong>of</strong> labourLack <strong>of</strong> knowledgeNo access to draft powerNo moneyOther (please name)Tick if respondentmentions any reasonRank – only if ticked(1 = most important)30. What are the reasons <strong>of</strong> not grow<strong>in</strong>g any short duration <strong>rice</strong> varieties? FILL IN THETABLE BELOWReasonNot the best variety for mylandCan not obta<strong>in</strong> seedsNot cultivat<strong>in</strong>g suitable type <strong>of</strong>land for those varietiesNot higher yield<strong>in</strong>g than theexist<strong>in</strong>g varietyNot suitable for exist<strong>in</strong>g<strong>cropp<strong>in</strong>g</strong> patternMarket has not beenestablished yetNo market p<strong>rice</strong>Other (please, specify)Tick if respondentmentions any reasonRank – only if ticked(1 = most important)71
31. Do you know about w<strong>in</strong>ter season crop varieties? YES………NO…….IF THE ANSWER IS NO THEN GO TO QUESTION NO 37IF THE ANSWER IS YES THEN ASK QUESTION 32 (NEXT QUESTION)32. Have you ever grown w<strong>in</strong>ter season crops? Yes………NoIF YES ASK QUESTION 33IF NO, ASK QUESTION 3633. Name the w<strong>in</strong>ter crop … ………..What are those w<strong>in</strong>ter crop varieties that you grow?a. ………………………b. ………………………c. ……………………….d. ……………………….34. What are the advantages <strong>of</strong> those w<strong>in</strong>ter crops that you are practition<strong>in</strong>g???a………………………………………………………...b………………………………………………………….c………………………………………………………….35. Why are not you adopt<strong>in</strong>g w<strong>in</strong>ter season legumes like chickpea like Tara,Awarodhi, ICC37,ICCV2,GNG469, KPG59 and lentil like Sital, ILL7723?ReasonBecause <strong>of</strong> long duration <strong>rice</strong> varietiesDon’t know about these varietiesLack <strong>of</strong> seedLack <strong>of</strong> market/p<strong>rice</strong>Lack <strong>of</strong> other <strong>in</strong>putsWeedsPests(Name…………….)Diseases(Name…………)More timeLack <strong>of</strong> labourLack <strong>of</strong> knowledgeNo access to draft powerTheftOther (please name)Tick if respondentmentions any reasonRank – only if ticked(1 = most important)72
36. What are the reasons <strong>of</strong> not grow<strong>in</strong>g w<strong>in</strong>ter season crop varieties? FILL IN THETABLE BELOWReasonBecause <strong>of</strong> long duration <strong>rice</strong> varietiesTheftDamage from graz<strong>in</strong>gEncroachment from wild animalsLack <strong>of</strong> marketLack <strong>of</strong> seedLack <strong>of</strong> other <strong>in</strong>putsWeedsPestsDiseasesLack <strong>of</strong> labourInadequate technical know howToo late to sow after <strong>rice</strong> harvestNo access to draft powerOther (please name)Tick if respondentmentions any reasonRank – only if ticked(1 = most important)37. Do you know about spr<strong>in</strong>g season crop varieties? YES………NO…….IF THE ANSWER IS NO THEN GO TO QUESTION NO 43IF THE ANSWER IS YES THEN ASK QUESTION 38 (NEXT QUESTION)38. Have you ever grown spr<strong>in</strong>g season crops? Yes………NoIF YES ASK QUESTION 39IF NO, ASK QUESTION 4239. Name the legume crop …………..What are those spr<strong>in</strong>g crop varieties that you grow?a. ………………………b. ………………………40. What are the advantages <strong>of</strong> those spr<strong>in</strong>g crop that you are practition<strong>in</strong>g???a………………………………………………………...b………………………………………………………….c………………………………………………………….73
41. Why are not you adopt<strong>in</strong>g spr<strong>in</strong>g season legumes Like Mungbean varieties (Kalyan,Prateekshya, NM92, VC3960)ReasonBecause <strong>of</strong> long duration <strong>rice</strong> varietiesDon’t know about these varietiesNot easily availableLack <strong>of</strong> seedLack <strong>of</strong> marketLack <strong>of</strong> other <strong>in</strong>putsWeedsPestsDiseasesMore devotionLack <strong>of</strong> labourLack <strong>of</strong> knowledgeNo access to draft powerOther (please name)Tick if respondentmentions any reasonRank – only if ticked(1 = most important)42. What are the reasons <strong>of</strong> not grow<strong>in</strong>g spr<strong>in</strong>g season crop varieties?ReasonTick if respondentmentions any reasonPlace for livestock graz<strong>in</strong>gEncroachment from wild animalsLack <strong>of</strong> marketLack <strong>of</strong> seedLack <strong>of</strong> other <strong>in</strong>putsWeedsPestsDiseasesLack <strong>of</strong> labourLack <strong>of</strong> knowledge on how to growToo late to sow after <strong>rice</strong> harvestNo access to draft powerOther (please name)Rank – only if ticked(1 = most important)43. Would you like to grow short duration <strong>rice</strong> varieties <strong>in</strong> next kharif? (2008-2009)? YES __NO __a. If yes which crop you like to grow?b. How will your household get seed? Please expla<strong>in</strong>………………………….c. If NO, please expla<strong>in</strong> why not………………………………………………..74
44. Would you like to grow w<strong>in</strong>ter crops <strong>in</strong> next w<strong>in</strong>ter? (2008-2009)?YES __ NO __a. If yes which crop you like to grow?45. Would you like to grow chickpea (Tara, Awarodhi, KPG59, ICC 37, ICCV2, andGNG469)a. if YES, how will your household get seed? Please expla<strong>in</strong> ………………………….b. If NO, please expla<strong>in</strong> why not………………………………………………..46. Would you like to grow spr<strong>in</strong>g crops <strong>in</strong> next spr<strong>in</strong>g? (2008-2009)? YES __ NO __a. If yes which crop you like to grow?……………………………………47. Would you like to grow spr<strong>in</strong>g legumes Mungbean (Kalyan, Prateekshya, NM92,VC3960) <strong>in</strong> next spr<strong>in</strong>g ?a. If YES, how will your household get seed? Please expla<strong>in</strong> ……………………….…………………………………………………………………………………………….b. If NO, please expla<strong>in</strong> why not …………………………………………………....…………………………………………………………………………………………….Migration48. Did anyone <strong>in</strong> your household migrate <strong>in</strong> the last year (2007-2008)? YES _ NO_a. If YES, how many people? ………………………………….b. Who are they? (Male HH head /Female HH head/wife <strong>of</strong> HH head/husband <strong>of</strong>HH head/son <strong>of</strong> HH head/ daughter <strong>of</strong> HH head/ other………. please name).PLEASE CIRCLE CORRECT ANSWER.c. Record the details foreach HH member whomigrated <strong>in</strong> the follow<strong>in</strong>gtable. (PLEASE RECORD THENUMBER OF WEEKS ONMIGRATION)H<strong>in</strong>ts for enumerator to get <strong>in</strong>formation for question c(PLEASE ASK THE FOLLOWING QUESTIONS INSEQUENCE):• Who migrated;• How many times <strong>in</strong> the year;• When was the first trip;• First trip - for how long (weeks)• When was the second tripWho migrates? Jul A S O N D Jan F M A May June TotalweeksMale: (HH head)Female (HH head’s wife)75
PART C REPORT ON THE QUALITATIVE SURVEYPrepared by:Dr M. Buchy and Ambika Sapkota (FORWARD)With the help <strong>of</strong> the follow<strong>in</strong>g staff <strong>of</strong> FORWARD:Lakpa T. Sherpa, Krishna Gupta, Dil R. Yadav , Balram Bhandari, Achyut P. Uprety andYoba, N. Towari76
TABLE OF CONTENTSEXECUTIVE SUMMARY1. INTRODUCTION2. METHODOLOGY3. FINDINGSA. Kapilvastu districta. Changes <strong>in</strong> Livelihoodsb. Changes <strong>in</strong> AgricultureB. Jhapa districta. Changes <strong>in</strong> Livelihoodsb. Changes <strong>in</strong> Agriculture4. INSIGHTS: IMPACT AND ISSUES OF RNRRS TECHNOLOGYREFERENCESANNEXESLIST OF ACRONYMSLIST OF MAP, BOXES AND TABLES77
LIST OF ACRONYMSCOB: Client Oriented Breed<strong>in</strong>gDADO: District Agricultural DevelopmentFGD: Focus Group DiscussionHDI: Human Development <strong>in</strong>dexLGP: Local Governance programNGO: Non Governmental OrganisationPVS: Participatory Varietal SelectionRNRRS: Renewable Natural Resources <strong>Research</strong> StrategyVDC: Village Development CommitteeMap 1: Location <strong>of</strong> surveyed districtsLIST OF MAP, BOXES AND TABLESBox 1: Core topics covered by the surveyBox 2: Details <strong>of</strong> the RRC projectTable 1: Summary <strong>of</strong> number <strong>of</strong> FDGs conducted <strong>in</strong> Kapilvastu & JhapaTable 2: Data from a group <strong>of</strong> Tharu with less than 3 months <strong>of</strong> food security (Jaynagar)Table 3: Data from a group <strong>of</strong> Dalits with 3 months or less food security, GajedaTable 4: Data from 6 months food secure farmers <strong>in</strong> BadaharaTable 5: Crops grown by different food security categories <strong>of</strong> farmers <strong>in</strong> GagedaTable 6: Data from FGD Jambadi chowk Food secure Bahun Chhetris (Jhapa)Table 7: Data from FGD Jambadi chowk Food secure Rai (Jhapa)ANNEXESTable 8: Data provided by a women’s meet<strong>in</strong>g <strong>in</strong> Gajeda tole Kapilvastu on land ownership,food security and migration patternsTable 9: Data from Jayanagar (Badahara 9) Kapilvastu on land ownership, food security andmigration patterns provided by key <strong>in</strong>formantsTable 10: Data from Gauradaha -5 Jambadi Chowk Jhapa (provided by key <strong>in</strong>formants) onland ownership, food security and migration patternsTable 11: Data from Juropani-6 Gwalduba (provided by key <strong>in</strong>formants) on land ownership,food security and migration patternsTable 12: Data on crops grown by a sample <strong>of</strong> 6 months food secure farmers Tharu Pur<strong>in</strong>avillage (Kapilvastu)Table 13: Data <strong>of</strong> variety grown by a sample <strong>of</strong> food sufficient Tharu group <strong>in</strong> Pur<strong>in</strong>a village(Kapilvastu)78
EXECUTIVE SUMMARYField work was conducted <strong>in</strong> 6 villages and 2 districts.Given the overall changes <strong>in</strong> the Terai <strong>in</strong> the last 10 years follow<strong>in</strong>g the Local GovernanceProgram (LPG) as well as various INGOs’ and NGOs’ efforts to develop the area it is difficultto isolate the impacts <strong>of</strong> any specific <strong>in</strong>tervention. Methodologically it is also impossible tomeasure impact as we were work<strong>in</strong>g with recall and farmers’ perceptions <strong>of</strong> change ratherthan with hard evidence collected over time. It is also likely that it is the comb<strong>in</strong>ation <strong>of</strong> anumber <strong>of</strong> factors or <strong>in</strong>terventions <strong>in</strong> different parts <strong>of</strong> the livelihoods systems that generatechanges rather than any s<strong>in</strong>gle <strong>in</strong>tervention.The last decade has seen important changes l<strong>in</strong>ked to electrification (which has also helped<strong>in</strong> the development <strong>of</strong> irrigation), the development <strong>of</strong> rural roads <strong>in</strong>frastructure and the<strong>in</strong>crease <strong>in</strong> health and education facilities across the Terai. The LGP has also promoted selfhelp groups, women’s literacy and empowerment and <strong>in</strong>creased awareness about rights. It isdifficult to measure what role these changes would play <strong>in</strong> facilitat<strong>in</strong>g <strong>in</strong>novation andsupport<strong>in</strong>g farmers <strong>in</strong> tak<strong>in</strong>g risks and try<strong>in</strong>g out new crops or new agriculture practices. Butat the same time these contextual factors cannot be ignored.There is also extreme diversity with<strong>in</strong> this case study. Each district visited has slightlydifferent agro-ecological conditions and farm<strong>in</strong>g systems. There is ethnic and caste diversitywith communities split between Tharus and Bahun Chhetris, some communities with agreater mix <strong>of</strong> Ray, Dalits, and Bahun Chhetris or homogenous communities <strong>of</strong> Rajbanshis.There is a difference <strong>of</strong> economic status between villages - even at times between villagesclose to each other. The economic differences are <strong>of</strong>ten l<strong>in</strong>ked to the quality <strong>of</strong> land, but alsoto the history <strong>of</strong> settlement and the differences between ‘migrants’ from the hills and‘<strong>in</strong>digenous’ communities, though some communities like the Satars are <strong>in</strong> fact orig<strong>in</strong>at<strong>in</strong>gfrom India. This then makes it difficult to disentangle factors <strong>of</strong> <strong>in</strong>fluence <strong>in</strong> such a shortstudy and small sample. But it also re-emphasises the need to target <strong>in</strong>terventions at verylocal specific scales.The land hold<strong>in</strong>g per household is relatively small and hence the impact <strong>of</strong> any <strong>in</strong>crease <strong>in</strong>agriculture production can only be limited. Farmers <strong>in</strong> different places face differentconstra<strong>in</strong>ts with land size and type <strong>of</strong> land (Upland, Medium, Low Land) which, comb<strong>in</strong>edwith availability <strong>of</strong> labour and access to irrigation, are the major limit<strong>in</strong>g factors for expansionor <strong>in</strong>tensification; availability <strong>of</strong> seeds seems to play less <strong>of</strong> a role except perhaps formarg<strong>in</strong>al farmers who mentioned purchas<strong>in</strong>g expensive seeds <strong>of</strong> improved varieties as aproblem.In both districts farmers have reported that gra<strong>in</strong> production has <strong>in</strong>creased the food selfsufficiency <strong>of</strong> the household by 2-3 months maximum. This <strong>of</strong> course is not negligible at thehousehold level but it is not at a scale <strong>of</strong> <strong>in</strong>crease that will pull most small farmers out <strong>of</strong>poverty. For most households an <strong>in</strong>crease <strong>in</strong> <strong>rice</strong> production and the diversification <strong>of</strong> cropssuch as legumes and vegetables resulted <strong>in</strong> <strong>in</strong>creased home consumption and better diets.This <strong>in</strong> turn has resulted <strong>in</strong> decreased expenditure on food gra<strong>in</strong>s rather than <strong>in</strong>creasedrevenue from crop sales.Women <strong>in</strong> all groups, <strong>in</strong>clud<strong>in</strong>g the poorest, have commented on the changes <strong>in</strong> their statuswith<strong>in</strong> the household and the community. They reported that discrim<strong>in</strong>ation has decreasedand that husbands are more likely to share some <strong>of</strong> their wife’s housework. They feel theyare more aware <strong>of</strong> their rights and have been exposed to new ideas. This is ma<strong>in</strong>ly due tothe LGP promoted by the Village Development Committee across <strong>Nepal</strong>, but also tonumbers <strong>of</strong> NGO programmes which all seem to have a women empowerment component.Credit schemes (as well as rural banks) are now very common across the sample villageswhich have reduced dependency on money lenders. Women’s labour <strong>in</strong>volvement on the79
farm has also changed with the <strong>in</strong>creased <strong>in</strong>tensity <strong>of</strong> farm<strong>in</strong>g, as the slack agriculture periodhas disappeared. Despite what women said, however, wage discrim<strong>in</strong>ation is still rife withwomen gett<strong>in</strong>g ½ <strong>of</strong> the daily agriculture wage given to men for similar work. We helddiscussions with groups <strong>of</strong> groups <strong>in</strong> all villages, and women also came along to most FGDs.Learn<strong>in</strong>g about agriculture practices has been for farmers at least as important as the<strong>in</strong>troduction <strong>of</strong> new varieties <strong>of</strong> seeds. All groups <strong>in</strong> all districts have mentioned learn<strong>in</strong>g newtechniques and ideas about practices as one major impact and change (if not the greatest).Even when farmers have stopped grow<strong>in</strong>g the variety <strong>of</strong> seeds <strong>in</strong>troduced by the project theyare aware <strong>of</strong> the possibility <strong>of</strong> cultivat<strong>in</strong>g 2 <strong>rice</strong> seasons, rather than the traditional one, andto cultivate other crops. Farmers have <strong>in</strong> the past been seek<strong>in</strong>g shorter rotation <strong>rice</strong> varietiesand the project <strong>in</strong>tervention, by provid<strong>in</strong>g shorter but also higher yield<strong>in</strong>g varieties has<strong>in</strong>creased opportunities and farmers <strong>in</strong>terests. Farmers have <strong>in</strong>tegrated shorter <strong>rice</strong> varieties<strong>in</strong> their farm<strong>in</strong>g system.The choice <strong>of</strong> which variety to grow is dictated by a comb<strong>in</strong>ation <strong>of</strong> factors: the availability <strong>of</strong>appropriate land (and access to irrigation), availability <strong>of</strong> good quality seeds, labour <strong>in</strong>put,productivity, quality <strong>of</strong> straw (for fodder), taste, availability <strong>of</strong> markets, market p<strong>rice</strong>,resistance to pest and sto<strong>rabi</strong>lity. The last three criteria have been particularly important <strong>in</strong>the case <strong>of</strong> Mung beans and Chick peas. Both crops have been susceptible to pests andstorage problems, and farmers have found it difficult to f<strong>in</strong>d satisfactory markets.80
INTRODUCTIONThis report presents the results <strong>of</strong> the qualitative survey conducted <strong>in</strong> 2 districts <strong>in</strong> the Teraibetween January and February 2008. Orig<strong>in</strong>ally the qualitative survey, labelled as ‘Method 4’<strong>in</strong> the overall case study methodology <strong>of</strong> the Monitor<strong>in</strong>g and Learn<strong>in</strong>g component <strong>of</strong> the<strong>Research</strong> <strong>Into</strong> <strong>Use</strong> programme, was conceived as a tool to complement the analysis <strong>of</strong> theother 3 more structured methods applied by the case study team. The overall aim <strong>of</strong> thestudy is to document and expla<strong>in</strong> impacts <strong>of</strong> the <strong>in</strong>troduction <strong>of</strong> PVS and COB varietiestogether with Rabi crops such as Chickpea and Mung bean <strong>in</strong> the districts on livelihoods andagriculture practices; and to the extent possible get a measure <strong>of</strong> the impacts for the poorestsections <strong>of</strong> the community. It does not seek to measure the extent <strong>of</strong> impact – i.e. thenumbers <strong>of</strong> households <strong>in</strong> the study districts us<strong>in</strong>g or affected by the technologies.Map 1: Location <strong>of</strong> the surveyed districtsIn order to understand the <strong>Nepal</strong>i context with<strong>in</strong> which this field study was conducted a fewgeneric po<strong>in</strong>ts are worth mak<strong>in</strong>g. <strong>Nepal</strong> has only emerged recently from the violent decade<strong>of</strong> ‘the Insurgency’ which partly took its roots <strong>in</strong> the extreme social and hierarchical divisions,themselves l<strong>in</strong>ked to landlessness and poverty.The society <strong>in</strong> <strong>Nepal</strong> is made up <strong>of</strong> 59 ethnic groups, 4 castes and 39 sub-caste groups(Khadka 2009).The high caste group <strong>of</strong> Indo Aryan orig<strong>in</strong>, such as the Brahm<strong>in</strong>, the Chhetrisand the Newars dom<strong>in</strong>ate politically and economically the country. The Janajati such as theRai and Tharus, the Yadav and the Rajbanshi <strong>in</strong> our Terai districts, belong to the Tibeto-Burman language group. The Janajatis, together with the low castes, or dalits (also called‘occupational castes’), consistently score lower on all the Human development <strong>in</strong>dex criteria.For example, <strong>in</strong> 1998 the Brahm<strong>in</strong>s had a Human Development <strong>in</strong>dex (HDI) <strong>of</strong> 0.441 (thenational average (NA) is 0.325), a life expectancy <strong>of</strong> 60.8 years (NA 55) and a literacy rate<strong>of</strong> 58% (36%); whereas the ethnic groups from the Terai had a HDI <strong>of</strong> 0.239, a lifeexpectancy <strong>of</strong> 50.3 years and a literacy rate <strong>of</strong> 23.8% The dalits, have HDI <strong>of</strong> 0.295, a lifeexpectancy <strong>of</strong> 54.4 years and a 27.6% literacy rate (UNDP 1998). More recent data from2004 show improvement but the gaps between groups rema<strong>in</strong>: whilst for example the81
national literacy rate is 53%, 75% <strong>of</strong> Brahm<strong>in</strong>, 60 % <strong>of</strong> Chhetris and 72% <strong>of</strong> Newars areliterate, only 21.06 % or the Terai dalits are (UNDP 2004).Historically agriculture land has been unequally shared - with 40% <strong>of</strong> agricultural householdsaccess<strong>in</strong>g only 9 percent <strong>of</strong> the total agricultural land and own<strong>in</strong>g less than ½ ha perhousehold; while 6 percent controls more than 33 percent <strong>of</strong> the total agriculture landavailable (Rai Paudyal 2008). In the Terai typically a small farmer owns a bit more than 1/3<strong>of</strong> a hectare <strong>of</strong> land, which is not sufficient to ensure gra<strong>in</strong> self sufficiency, and he willcomplement his <strong>in</strong>come through wage work. A medium farmer who owns about 2/3 <strong>of</strong> ahectare may produce just enough food depend<strong>in</strong>g on the land quality. A family with about 2hectares would be considered as a landlord family and represent a m<strong>in</strong>ority <strong>in</strong> the village.Women do not own land and have to access land through a male relative when <strong>in</strong>widowhood.Interest<strong>in</strong>gly, though land access and ownership are a major issue <strong>in</strong> a country where 80%<strong>of</strong> the population is rural, there are very few recent studies on the topic. Landlessness is animportant factor <strong>of</strong> poverty <strong>in</strong> <strong>Nepal</strong> (Acharya 2004) as a small per capita area <strong>of</strong> land makesit impossible for most households to reach food gra<strong>in</strong> self sufficiency all year around. Therewas an attempt <strong>in</strong> 1964 to reform land tenure by transform<strong>in</strong>g share <strong>cropp<strong>in</strong>g</strong> <strong>in</strong>to fixed rentcontracts <strong>in</strong> order to <strong>in</strong>crease access for the landless (Acharya 1999). This was stronglyresisted by the landed groups and many <strong>of</strong> those who had managed to obta<strong>in</strong> such contractwere subsequently evicted. Acharya (1999:2) has divided the share croppers <strong>in</strong>to twodist<strong>in</strong>ct economic groups: the mixed-share tenants who own land and use share <strong>cropp<strong>in</strong>g</strong> asa way to extend their access to land - and the landless pure-share tenants who either rentthe land or take it under share <strong>cropp<strong>in</strong>g</strong> arrangements.Land tenure arrangements <strong>in</strong> the Terai are chang<strong>in</strong>g <strong>in</strong> different ways <strong>in</strong> different districts.Where food gra<strong>in</strong> sufficient households send labour overseas, like <strong>in</strong> Jhapa, more land isbecom<strong>in</strong>g available for share <strong>cropp<strong>in</strong>g</strong>; but the poorer landless agriculture labourers do notnecessarily have enough <strong>in</strong>itial capital/assets to even start share <strong>cropp<strong>in</strong>g</strong>. A share cropperneeds animals for plough<strong>in</strong>g, seeds and labour and by def<strong>in</strong>ition extremely poor landlesspeople lack these <strong>in</strong>itial assets. This is quite typical <strong>of</strong> the situation <strong>of</strong> the very poor who arenot even able to take up development opportunities. Agreements between landowners andshare croppers also vary between places and landowners are not always agreeable toprovide draught animals as part <strong>of</strong> their share <strong>of</strong> <strong>in</strong>puts. Landowners tend (but not always) todictate which crop/varieties the tenant has to grow and landowners prefer quality overquantity and are not always choos<strong>in</strong>g the highest yield<strong>in</strong>g varieties. For medium farmers the<strong>in</strong>tensification <strong>of</strong> farm<strong>in</strong>g has meant that there is no slack season anymore and some haveleft share <strong>cropp<strong>in</strong>g</strong> to focus on their own land which now produces more and they are limitedby labour availability <strong>in</strong> the household. In Jhapa, it seems landowners are look<strong>in</strong>g keenly forshare croppers but <strong>in</strong> Kapilsvastu farmers will<strong>in</strong>g to f<strong>in</strong>d more land are struggl<strong>in</strong>g to f<strong>in</strong>d extraland. Share <strong>cropp<strong>in</strong>g</strong> however rema<strong>in</strong>s a vulnerable option as contracts are usually verbaland landowners, to avoid litigation <strong>of</strong> potential future claims, tend to rotate their tenantsevery 2 to 3 (sometimes 4) years. Where share croppers are <strong>in</strong> demand they are <strong>in</strong> astronger position to choose the type <strong>of</strong> land.However it is important to note that despite an <strong>in</strong>crease <strong>in</strong> <strong>in</strong>come poverty, human povertyhas decreased <strong>in</strong> the country, although there is regional divergence. Acharya’s study (2004)<strong>of</strong> the last 2 decades <strong>of</strong> the 20 th century confirms that poverty is foremost a rural issue and ispredom<strong>in</strong>ant <strong>in</strong> the mounta<strong>in</strong> region followed closely by the Western Terai and then theEastern Terai which is not as poor as the western parts <strong>of</strong> <strong>Nepal</strong>. There have, however,been dramatic improvements <strong>in</strong> education levels and health care across the country, partlythanks to the proliferation <strong>of</strong> NGOs s<strong>in</strong>ce the beg<strong>in</strong>n<strong>in</strong>g <strong>of</strong> the 1990s. These trends areconfirmed by our data.82
METHODOLOGYIt was orig<strong>in</strong>ally envisaged that this study would be conducted by an <strong>in</strong>dependent academicresearcher, as part <strong>of</strong> a wider contract, but this person withdrew their services shortly beforethe study was due to commence. FORWARD had been orig<strong>in</strong>ally <strong>in</strong>volved <strong>in</strong> the RNRSSproject and therefore could be seen as biased partners. However, it was decided that theirstaff were pr<strong>of</strong>essional enough to approach the work objectively, under Dr Marlene Buchy’ssupervision. In addition, their organisational knowledge <strong>of</strong> the context would be very valuable<strong>in</strong> site selection and also <strong>in</strong> establish<strong>in</strong>g contacts <strong>in</strong> the villages. It was also felt that, as thisstudy was not a project evaluation but more an <strong>in</strong>vestigation <strong>of</strong> more general changes, theteams would not have a vested <strong>in</strong>terest <strong>in</strong> manipulat<strong>in</strong>g the data. The role <strong>of</strong> the externalconsultant was also to control any potential bias. It was also felt that from a learn<strong>in</strong>gperspective the field team would benefit from this exercise as they would be learn<strong>in</strong>g aboutlivelihoods <strong>in</strong> more details and would also acquire some skills <strong>in</strong> qualitative field surveymethods. In September 2008 Marlene Buchy met with the FORWARD partners <strong>in</strong>Kathmandu to discuss and ref<strong>in</strong>e the methodology and to select the study sites. In January2009 the first field survey was conducted under the supervision <strong>of</strong> M. Buchy <strong>in</strong> Kapilvastu:the details <strong>of</strong> the timetable and process followed are <strong>in</strong>cluded <strong>in</strong> Annexe A. Whilst the work<strong>in</strong> Kapilvastu was completed under the supervision <strong>of</strong> Ambika Sapkota from FORWARD,Marlene Buchy moved to Jhapa to start work there with another FORWARD team.Based on the field knowledge <strong>of</strong> the FORWARD staff and a concern to cover a range <strong>of</strong>agro-ecological as well as economic conditions, 2 districts were chosen by FORWARD.Kapilvastu with a poverty <strong>in</strong>dex (PI) between 37-38, and Jhapa (PI:63-74) 2 . Jhapa is also <strong>in</strong>the far east <strong>of</strong> the country, Kapilvastu considered a central Terai district.The work on the Rabi study followed the <strong>in</strong>itial RIU MIL Rice survey <strong>in</strong> Nawalparasi district,with LI-Bird so based on that experience we considered that 3 villages per district would besufficient. The number <strong>of</strong> people to <strong>in</strong>terview was left open; and the factors determ<strong>in</strong><strong>in</strong>gchoice <strong>of</strong> villages and the numbers <strong>of</strong> people per village to <strong>in</strong>terview are listed below.- The level <strong>of</strong> <strong>in</strong>terest <strong>in</strong> the <strong>in</strong>troduced varieties. The field staff categorised villages <strong>in</strong> to‘high adoption villages’ and ‘ low adoption’ villagers which represent the level <strong>of</strong><strong>in</strong>terest <strong>in</strong> the varieties at the time <strong>of</strong> the project <strong>in</strong>terventions;- The level <strong>of</strong> social differentiation <strong>in</strong> the village; the caste and/or ethnic heterogeneity <strong>of</strong>the village was an important factor to consider and so <strong>in</strong> heterogeneous villages wemade sure all sections <strong>of</strong> the village would be <strong>in</strong>volved, especially women, but we alsomade sure we had <strong>in</strong> our sample relatively homogeneous and heterogeneous villages;this is why <strong>in</strong> some <strong>of</strong> the villages we organised a larger number <strong>of</strong> group <strong>in</strong>terviews -<strong>in</strong> order to account for caste and ethnic diversity;- Once <strong>in</strong> the field dur<strong>in</strong>g the early <strong>in</strong>terviews, key <strong>in</strong>formants divided the communityaccord<strong>in</strong>g to the number <strong>of</strong> months when the households are self-sufficient <strong>in</strong> gra<strong>in</strong>s.This categorisation was then followed <strong>in</strong> all the other villages as a rough <strong>in</strong>dicator <strong>of</strong>wealth status2 2 Note: the higher the PI the lower the poverty level. PI: PI was calculated by Central Bureau <strong>of</strong> Statistics(CBS) <strong>Nepal</strong> and ICIMOD us<strong>in</strong>g the data from CBS.CBS/ICIMOD (2003). Districts <strong>of</strong> <strong>Nepal</strong> Indicators <strong>of</strong> Development update 2003. Kathmandu <strong>Nepal</strong>: CentralBureau <strong>of</strong> Statistics, International Centre for Integrated Mounta<strong>in</strong> Development. These categories <strong>of</strong> poverty arethe same used by the quantitative work. It would have been better to use PI at the VDC or household level butthese are not available. These <strong>in</strong>dexes were calculated on the overall poverty features <strong>of</strong> that particular districtand though there is disparity between villages, with some villages richer than others, with<strong>in</strong> the district a lowerPI <strong>in</strong>dicates a higher overall poverty level.83
Key <strong>in</strong>formant discussions were used as the <strong>in</strong>itial contact activity <strong>in</strong> the village to gathergeneric <strong>in</strong>formation on the village and to f<strong>in</strong>d help to identify and contact the possibledifferent groups to <strong>in</strong>terview subsequently. The Focus group discussion (FGD), a tool usedto explore 1 specific theme at a time by a group <strong>of</strong> selected participants (between 6-7maximum) was chosen as the preferred tool. Depend<strong>in</strong>g on the theme explored, peoplewere selected on the basis <strong>of</strong> their gender, class or caste or <strong>in</strong> relation to their pr<strong>of</strong>essionalstatus (traders or shop keepers, for example). A mixed group (men and women) was alsoacceptable. In the field, the availability <strong>of</strong> people also dictated to some extent who took partto the discussions.Though the discussions were open ended and touched on different aspects, overall betweenthe groups we attempted to cover a number <strong>of</strong> core topics, which are presented <strong>in</strong> Box 1.These topics had been identified dur<strong>in</strong>g the meet<strong>in</strong>g <strong>in</strong> September by the field tem as be<strong>in</strong>grelevant to the context.Box 1: core topics covered by the surveyChanges <strong>in</strong> livelihoodsa. quantitative changes like <strong>in</strong>creased food self sufficiency or yield, <strong>in</strong>creased trad<strong>in</strong>g etc.what is the mean<strong>in</strong>g <strong>of</strong> these quantified changes. For example: What does an <strong>in</strong>crease <strong>in</strong>gra<strong>in</strong> self sufficiency mean for the households? Does it lead to consumption changes, tomore sale and <strong>in</strong>creased cash flow, does it result <strong>in</strong> shortened migration?b. qualitative changes which would cover aspects like diversification, changes <strong>in</strong> thefarm<strong>in</strong>g system. Here changes refer more to transformations (which can be small ones):has the livelihood strategy changed? Are people grow<strong>in</strong>g new crops or <strong>in</strong>vest<strong>in</strong>g <strong>in</strong>irrigation?Community empowermentc. access to resources (seed, <strong>in</strong>formation services): Have the dynamism <strong>of</strong> the villagesand the new livelihoods <strong>in</strong>creased villagers’ awareness <strong>of</strong> their rights, encouraged them toseek services from exist<strong>in</strong>g agencies? Are government agencies be<strong>in</strong>g accessed more?d. Learn<strong>in</strong>g and knowledge: this relates to the <strong>in</strong>fluence <strong>of</strong> the PVS processes <strong>in</strong> thevillages. Have some farmers simply adopted the new seeds <strong>of</strong> <strong>rice</strong> or chick peas/mungbeans or have they also learnt someth<strong>in</strong>g about the <strong>in</strong>novation technology. Have theybecome keen <strong>in</strong>novators? Have they <strong>in</strong>novated <strong>in</strong> other sectors <strong>of</strong> their farms? Has theirwill<strong>in</strong>gness to <strong>in</strong>novate <strong>in</strong>creased?e. network<strong>in</strong>g, new organisation developments: There have been signs <strong>in</strong> some places <strong>of</strong>villagers-lead new credit organisations. Is this a common pattern? How does it work? Whois left out? Who leads these organisations? Are villagers extend<strong>in</strong>g new networks outsidethe village with new partners (traders?, government <strong>of</strong>fices?)f. changes <strong>in</strong> Land tenure and share <strong>cropp<strong>in</strong>g</strong> arrangements: this is potentially a veryimportant are <strong>of</strong> change which will affect mostly men as they are de land owners and thedecision makers. Changes <strong>in</strong> tenure may benefit new groups traditionally excluded or itmay <strong>in</strong>crease their marg<strong>in</strong>alisation.Susta<strong>in</strong>abilityg. livelihoods: Outstand<strong>in</strong>g problems/issues (related to agricultural/farm<strong>in</strong>g) <strong>in</strong> the villagethat may be threaten<strong>in</strong>g susta<strong>in</strong>ability; Who can do what to mitigate the givenproblems/issues <strong>in</strong> order to ensure susta<strong>in</strong>ability?h. Environment: has environmental susta<strong>in</strong>ability been compromised? At what cost cansusta<strong>in</strong>ability be ma<strong>in</strong>ta<strong>in</strong>ed?84
In each <strong>of</strong> the districts we chose 3 villages. Based on the field teams’ local knowledge, wewanted to look at villages with high level <strong>of</strong> use <strong>of</strong> the varieties <strong>in</strong>troduced by the project,whilst also mak<strong>in</strong>g sure that the selected villages were representative <strong>of</strong> other characteristicssuch as ethnic diversity. After the first group discussion which we held <strong>in</strong> Gajada wedecided to adjust the field strategy as it turned out that <strong>in</strong> Gajeda the tole was relatively well<strong>of</strong>f and perhaps not representative <strong>of</strong> the majority <strong>of</strong> villages. So we decided to seek outpoorer groups or poorer villages rather than only look at 2 examples <strong>of</strong> high level <strong>of</strong> usevillages. The level <strong>of</strong> poverty was decided based on the knowledge <strong>of</strong> the local field teamsand the ma<strong>in</strong> criteria used were size <strong>of</strong> land, type <strong>of</strong> land and length <strong>of</strong> food security <strong>in</strong> thevillages. As all the selected villages had seen FORWARD <strong>in</strong>terventions, <strong>in</strong> Kapilvastu wealso decided to see a village which had had no FORWARD <strong>in</strong>tervention but was 2 km awayfrom one that had seen some <strong>in</strong>tervention. This we thought might give us some <strong>in</strong>dication <strong>of</strong>spread but also see whether this village too was report<strong>in</strong>g similar overall changes. In eachvillage we considered the ethnic/caste composition to determ<strong>in</strong>e the numbers <strong>of</strong> focusgroups we needed to hold.In Kapilvastu we met key <strong>in</strong>formants <strong>in</strong> Jaynagar 3- Pur<strong>in</strong>a and Gajeda Tole (bothconsidered by FORWARD team as villages with high level <strong>of</strong> use). It transpired later that‘High level <strong>of</strong> use’ refers to high participation <strong>of</strong> the village at the time <strong>of</strong> the <strong>in</strong>tervention. Thesame level <strong>of</strong> use might not have been subsequently ma<strong>in</strong>ta<strong>in</strong>ed <strong>in</strong> the village. The Gajedameet<strong>in</strong>g turned <strong>in</strong>to a Bahun-Chhetri food self sufficiency women meet<strong>in</strong>g, so we decidedafterwards to seek another tole <strong>in</strong> the same village.In Jaynagar 3- Pur<strong>in</strong>a we held meet<strong>in</strong>gs with:• a Tharu group with less than 3 months food self sufficiency ,• one Tharu group with 6 months food security self sufficiency,• one Bahun-Chhetri group with 6 months food security self sufficiency,• one food self sufficient Bahun-Chhetri group and• one women Bahun-Chhetri group with less than 3 months Food self sufficiencyJaynagar is dom<strong>in</strong>ated by Tharus (67%) and Bahun Chhetris (only 2 Janajati households out<strong>of</strong> 103) which expla<strong>in</strong>s the ethnic/caste composition <strong>of</strong> the focus groups. In Gajeda, whilstwait<strong>in</strong>g for the group to gather we opportunistically <strong>in</strong>terviewed a group <strong>of</strong> male youths.Badahara VDC (considered by the Forward team as a village with low level <strong>of</strong> use) is also amixed caste village with a large number <strong>of</strong> Dalits and Janajaty people with Bahun Chhetrisbe<strong>in</strong>g a m<strong>in</strong>ority group. We met:• a group <strong>of</strong> Dalit and Janajaty, landless with maximum food security <strong>of</strong> 3 months• one women group,• one Bahun-Chhetri food secure group,• one Bahun-Chhetri group with 6 months food security (it was not possible togather a group <strong>of</strong> food secure Tharu people)Table 1: summary <strong>of</strong> number <strong>of</strong> FGDs conducted <strong>in</strong> Kapilvastu & JhapaNumber <strong>of</strong>GroupsJaynagar3- Pur<strong>in</strong>aBadahara VDCGajeda Jurapani– 4Thakthake 6GwaldubaKey1 1 1 1 1 1<strong>in</strong>formantsFGD mixed 4 4 4 2 1 3Women FGD 1 1 1 185
In Jhapa district we followed the same process.In Jambadi chowk village, we met with Key <strong>in</strong>formants to establish the list <strong>of</strong> farmers anddecide which FGDs to convene. As about every household is food secure we decided toorganise• 2 food secure groups <strong>of</strong> Bahun-Chhetri and Janajatis (mostly Rais)• 1 group <strong>of</strong> Dalits (ideally with only 6 months or less <strong>of</strong> food security, but it turnedout to be a mixed food security status group)• a group <strong>of</strong> women.In Juropani – 4, Thakthake and 6 Gwalduba we also met with key <strong>in</strong>formants. Both tole atthe time <strong>of</strong> FORWARD project were considered as tole with high level <strong>of</strong> use. Thakthake is aBahun-Chhetri dom<strong>in</strong>ated community and only the Dalits and Satar (adivasi group <strong>of</strong> tribes)are either landless or with very low food security. We <strong>in</strong>terviewed a group <strong>of</strong> Satar people.In Gwalduba the community is dom<strong>in</strong>ated by Satar people. We arranged FGDs with:• 1 group <strong>of</strong> food secure Satars• 1 group <strong>of</strong> above 6 months <strong>of</strong> food security Satar.• 1 group <strong>of</strong> less than 6 month food security Satar• 1 group <strong>of</strong> women.In Thakthake we met a group <strong>of</strong> Bahun-Chhetri mung bean growers.In Juropani-1, a village which has not had any FORWARD <strong>in</strong>tervention, we convened:• 1 FGDs with food secure Rajbanshi people• 1 FGD with 6 months food self sufficient Rajbanshi people• 1 FGD with Rajbanshi women.This village is dom<strong>in</strong>ated by Rajbanshi people.FINDINGSBox 2 expla<strong>in</strong>s briefly the nature <strong>of</strong> the <strong>Ra<strong>in</strong>fed</strong> <strong>rabi</strong> <strong>cropp<strong>in</strong>g</strong> <strong>in</strong>tervention which was basedon the participatory processes with the aim to address the issue <strong>of</strong> better utilisation <strong>of</strong> largeareas <strong>of</strong> fallow lands.Box 2: The <strong>Ra<strong>in</strong>fed</strong> Rabi Cropp<strong>in</strong>g ProjectThe ra<strong>in</strong>fed <strong>rabi</strong> <strong>cropp<strong>in</strong>g</strong> (RRC) project was <strong>in</strong>itiated <strong>in</strong> 2001, with the aim to <strong>in</strong>tensify the<strong>rice</strong>-fallow system <strong>in</strong> the Terai through capitaliz<strong>in</strong>g on low external <strong>in</strong>put agriculturaltechnologies. The project has followed a system-based participatory action research anddevelopment process, <strong>in</strong> which the <strong>in</strong>terventions are reshaped through an experientiallearn<strong>in</strong>g cycle over time to address the problem situation. A series <strong>of</strong> on-farm trials<strong>in</strong>clud<strong>in</strong>g participatory varietal selection, crop establishment methods, nutrientmanagement and pest management was conducted and scal<strong>in</strong>g up took place throughcommunity-based seed management and <strong>in</strong>formal research and developmentapproaches. Short to medium maturity <strong>rice</strong> varieties Sugandha 1, Barkhe 2017, BG 1442,Barkhe 2014 were selected by the farmers for their higher yields, better qualities, earliermaturity and good adaptation <strong>in</strong> farmers' management <strong>in</strong> upland and medium wet-landconditions. These varieties also allow timely plant<strong>in</strong>g <strong>of</strong> w<strong>in</strong>ter crops by utiliz<strong>in</strong>g theresidual soil moisture <strong>in</strong> post-ra<strong>in</strong>y season. Adaptation <strong>of</strong> chickpea, field pea, lentil,buckwheat and niger <strong>in</strong> post-ra<strong>in</strong>y season; and mung-bean for spr<strong>in</strong>g, summer and86
autumn season was tested. Varieties preferred by farmers were: Chickpea varieties KPG59, GNG 469, Tara, Kak 2; field pea variety Sano Kerau (a small-seeded local land race);lentil variety ILL 7723; and mungbean varieties VC 3960-88, VC 6372 (45-8-1), NM-92and NM-94 . Seed prim<strong>in</strong>g, molybdenum load<strong>in</strong>g through seed, foliar spray <strong>of</strong> cattle ur<strong>in</strong>eand application <strong>of</strong> boron were found beneficial for <strong>in</strong>creas<strong>in</strong>g yields <strong>of</strong> test crops <strong>in</strong> <strong>rice</strong><strong>fallows</strong>.Extract from Khanal et al. (2004: ii)Dur<strong>in</strong>g the field work it was not always easy to discrim<strong>in</strong>ate between varieties <strong>in</strong>troduced,<strong>in</strong>novation technology and outcomes - because farmers, when they reflect on changes, donot discrim<strong>in</strong>ate between the causes <strong>of</strong> change. Another <strong>in</strong>terest<strong>in</strong>g po<strong>in</strong>t is that, as the<strong>in</strong>terventions were through a research project, there was no subsequent follow up by theNGO <strong>in</strong> a conventional sense- because the aim was not to distribute the seeds to as manypeople as possible, but to test the crops and their potentials on farm with volunteer farmers.This is important to remember when we look at the nature <strong>of</strong> potential impact on people’slivelihoods as the <strong>in</strong>tervention aim was to test varieties <strong>of</strong> crops - not to improve livelihoods,though <strong>of</strong> course this might be the ultimate purpose.Kapilvastu districta. Changes <strong>in</strong> LivelihoodsDur<strong>in</strong>g the <strong>in</strong>terviews people have def<strong>in</strong>ed food security as the ability to produce enoughfood on the farm <strong>in</strong> the form <strong>of</strong> <strong>rice</strong>, wheat pulses and greens) to feed the family. The level <strong>of</strong>food security depends on the availability <strong>of</strong> land per household, the type <strong>of</strong> land andavailability or not <strong>of</strong> irrigation; and also on the size <strong>of</strong> the family. Another factor which is moredifficult to measure <strong>in</strong> a short field study is the impact on fragmentation <strong>of</strong> land with<strong>in</strong>households and families. Bahun Chhetris are more likely to have better quality land thandalits, and the former are also more likely to have larger plots <strong>in</strong> one block than other groups(see below for Jhapa). In Kapilvastu farmers estimate that 1 bigha <strong>of</strong> medium land will feed afamily <strong>of</strong> 4-6 people year round.In the villages we visited the farmers were very clear that the new varieties <strong>of</strong> <strong>rice</strong>, with their<strong>in</strong>creased yields and shorter cycle (allow<strong>in</strong>g the <strong>in</strong>tensified use <strong>of</strong> land which <strong>in</strong> the past layfallow) were important causes <strong>of</strong> change. The ma<strong>in</strong> livelihood changes identified were:- Food security has improved for everyone between 2 to 4 months per year and <strong>in</strong> allgroups people have reported that this <strong>in</strong>crease has resulted <strong>in</strong> a decrease <strong>in</strong> foodrelated expenditure. More specifically, the <strong>in</strong>creased availability <strong>of</strong> home grownlentils has resulted <strong>in</strong> an <strong>in</strong>creased consumption <strong>of</strong> lentils and farmers havecommented on their children be<strong>in</strong>g ‘stronger’ as the diet has <strong>in</strong>creased <strong>in</strong> quantityand quality..- Increase <strong>in</strong> production has also resulted <strong>in</strong> better education for children. For thosehouseholds who did not send their children to school, or for shorter periods, thechildren (girls and boys) are now go<strong>in</strong>g to school and stay there longer. For those (forexample <strong>in</strong> Gajeda tole) who already sent the children to the government school itmeans send<strong>in</strong>g them to private board<strong>in</strong>g schools.87
- Other <strong>in</strong>terventions, such as electrification and roads construction, were alsomentioned by farmers as factors <strong>of</strong> change. One group <strong>of</strong> Brahm<strong>in</strong> Chhetri expla<strong>in</strong>edhow they lobbied for the road and how they are now lobby<strong>in</strong>g the VillageDevelopment Committee (VDC) for the school. They are also plann<strong>in</strong>g to constructan irrigation canal with help from the VDC.- Long term migration differs between groups. It is <strong>in</strong>creas<strong>in</strong>g <strong>in</strong> some groups, possiblyas a livelihood diversification strategy (rather than as a survival necessity). In theGajeda tole group we met, most households are food sufficient and there is a malemigrant <strong>in</strong> just about every household (see Table Annexe 2). For the dalits and thelandless below 3 months <strong>of</strong> food security, migrat<strong>in</strong>g is a necessity but rema<strong>in</strong>sseasonal <strong>in</strong> <strong>Nepal</strong> or at the furthest India. In the group with 6 months food security(table 4) no one is migrat<strong>in</strong>g, so one could put forward the hypothesis that perhapsabove a certa<strong>in</strong> threshold <strong>of</strong> food security, local labour can be sufficient to fill <strong>in</strong> thegaps. The scale <strong>of</strong> <strong>in</strong>creased production, given the small size <strong>of</strong> land hold<strong>in</strong>g, is still<strong>in</strong>sufficient to change the level <strong>of</strong> reliance on migration-related <strong>in</strong>come for the dalithouseholds below 3 months <strong>of</strong> food security. Tables 2, 3 and 4 show two th<strong>in</strong>gs: <strong>in</strong>our small sample, dalits have upland land, which is <strong>of</strong> poorer quality, whilst Tharusare more likely to have access to medium land. Tharus and dalits also have differentopportunities to complement the household <strong>in</strong>come: Tharus are more likely to dosemi-skilled work locally; whilst dalits are more likely to migrate for several months,probably to do unskilled manual labour. From this we can draw a number <strong>of</strong>conclusions:• caste and ethnicity and skill endowments determ<strong>in</strong>e to a large extent theopportunities available for <strong>in</strong>dividuals. This is not a new f<strong>in</strong>d<strong>in</strong>g <strong>of</strong> course, but itneeds to be re-emphasised as pro-poor <strong>in</strong>terventions tend to focus oneconomic status, which cannot be separated from social status;• migration should be seen as a range <strong>of</strong> options, not all <strong>of</strong> which areavailable to every group: <strong>in</strong> wealthier groups (those who are food secure)families are more likely to <strong>in</strong>vest <strong>in</strong> migration abroad as the return <strong>of</strong> onefamily member work<strong>in</strong>g abroad is higher than if this person stayed to work onthe farm. But migrat<strong>in</strong>g overseas is expensive and the <strong>in</strong>vestment is recoveredonly after the first year <strong>of</strong> migration which means that the migrant usually hasto stay 2 -3 years to make it worthwhile. For groups at the other end <strong>of</strong> thespectrum migration overseas is too expensive: and, although seasonal labourmigration may be a last resort, <strong>in</strong>come from migration may be essential for thesurvival <strong>of</strong> the household; and as we discuss below (see Table 4) theopportunities to <strong>in</strong>crease land hold<strong>in</strong>gs are still limited.Table 2: Data from a group <strong>of</strong> Tharu with less than 3 months <strong>of</strong> food security (Jaynagar)Family Area <strong>of</strong> land Type <strong>of</strong> land Off farm <strong>in</strong>comesize5 landless Husband driverWife agriculture labourer8 (10Katthas) Medium land driver4 4-5 (+ 10 Katthas) Medium land Truck work2 months out <strong>of</strong> village migration12 4 + (1 bigha) Medium land 1 uncle <strong>of</strong>f farm labourer; mothergrad<strong>in</strong>g <strong>rice</strong> at paddy mill6 5+(5 Katthas) Medium land Truck work1 kattha = 3.333 sq metres1 bigha = 20 KatthasNumbers <strong>in</strong> ( ) <strong>in</strong>dicate area <strong>in</strong> share <strong>cropp<strong>in</strong>g</strong>88
Table 3: data from a group <strong>of</strong> Dalits with 3 months or less food security, GajedaFamily size Land size Land Type Seasonal Migration10 5 katthas upland 7 month6 1 katthas upland 6 month6 2 katthas upland 6 month7 1.5 katthas medium Local labour7 1 katthas medium Local labourTable 4: Data from 6 months food secure farmers <strong>in</strong> BadaharaS.N. Farmers' nameFamilysize Land sizeLandTypeSeasonalMigrationDalit Kamal Biswakarma 6 3 kattha + (22 kattha) upland No migrationDalit Sete Sunar 3 2 kattha + (12 kattha) upland No migrationDalit Bal Bahadur Sunar 4 4 kattha + (5 kattha) upland No migrationDalit Gopal Sunar 5 4 kattha + (13 kattha) upland No migrationChhetriHom BahadurBhandari 6 2 kattha + (18 kattha) upland No migrationChhetri Ramesh Khadka 6 6 kattha + (6 kattha) upland No migrationNumbers <strong>in</strong> ( ) show the area <strong>of</strong> share <strong>cropp<strong>in</strong>g</strong>.b. Changes <strong>in</strong> agriculture- One <strong>of</strong> the ma<strong>in</strong> changes seems to be <strong>in</strong>creased learn<strong>in</strong>g about agriculturepractices:All the groups we met commented on their <strong>in</strong>creased knowledge <strong>in</strong> soil fertilitymanagement, <strong>in</strong>clud<strong>in</strong>g organic approaches and organic pesticides (this is also forbetter health) which they attributed to FORWARD’s <strong>in</strong>tervention. Dissem<strong>in</strong>at<strong>in</strong>g betteragricultural practices was part <strong>of</strong> the RNRRS <strong>in</strong>tervention (see box 2). Even thoughfarmers may not be grow<strong>in</strong>g some <strong>of</strong> the <strong>in</strong>itially distributed <strong>rice</strong> or chick pea varietiesanymore (see Table 5), they are now more likely to choose fast grow<strong>in</strong>g varieties <strong>of</strong><strong>rice</strong>. Farmers also reported greater awareness <strong>of</strong> the necessity to ma<strong>in</strong>ta<strong>in</strong> seedquality and <strong>of</strong> the need to renew the stock <strong>of</strong> seeds every 3-4 years. Very fewfarmers it seems however try to <strong>in</strong>novate and venture <strong>in</strong>to different crops. InJaynagar we met a farmer who, <strong>in</strong>spired by the project, experimented with sugarcane cultivation, banana and <strong>of</strong>f season vegetables. He also tried some tomatoesdemonstration. However, the costs attached to be<strong>in</strong>g the only farmer do<strong>in</strong>gsometh<strong>in</strong>g new were too high. This <strong>in</strong>creased the risk <strong>of</strong> theft and forced this farmerto manage stray<strong>in</strong>g livestock on his own. Stray<strong>in</strong>g livestock is also one <strong>of</strong> the reasonsit seems people don’t grow mung beans. This shows that <strong>in</strong>novat<strong>in</strong>g relies not onlyon appropriate technology, assets such as land or <strong>in</strong>novative attitudes but also oncommunity support.89
Table 5: Crops grown by different food security categories <strong>of</strong> farmers <strong>in</strong> GagedaGroups <strong>of</strong>farmersTharus less than3 months <strong>of</strong> foodsecurityBrahm<strong>in</strong>, lessthan 3 months <strong>of</strong>food securityBrahm<strong>in</strong> groupOver 6 monthsfood securityBrahm<strong>in</strong> groupfood secure over12 monthsCrops and varieties grownRadha 4, Hard<strong>in</strong>ath 1, Gautam,Barkhe 2001Local mustard peas, wheat,potatoes and LathyrusMungbeans, onions, greenvegetablesRadha 4, Gautam, Pant 10, warMustard, lentilsChick pea KPG 59Sawa, Radha-4 Sugandha 1Chickpeas: Avrodhi and TaraKPG 59<strong>Use</strong>d to grow mung-beansSungandha, Sabarti, Judi-62,Radha 12 Barkhe 2017 & 3004,SawaChickpea : KPG 59CommentsTara and Arvodhi were attacked by<strong>in</strong>sects and diseaseDon’t grow mungbeans because <strong>of</strong><strong>in</strong>sects and lack <strong>of</strong> waterPreference for these <strong>rice</strong> varietiesas they give more yield, goodtaste, less pest diseases, lesslabour requiredShort durationAvrhodi is considered the best as ityield more and is less prone todisease but requires more waterStopped because <strong>of</strong> watershortage, <strong>in</strong>sect attacks andgraz<strong>in</strong>gSawa and Radha are mostly grownand are the prefered varietybecause <strong>of</strong> taste and yield andearly harvest for Radha 4; theydon’t like the taste <strong>of</strong> Sungandha,and Barkhe 1027 and Judi havescattered gra<strong>in</strong>s.Don’t grow mungbeans anymore;lack <strong>of</strong> market and difficulty toprotect the crop- The <strong>in</strong>troduction <strong>of</strong> w<strong>in</strong>ter crops (dur<strong>in</strong>g the months <strong>of</strong> December to February) hasallowed <strong>in</strong>tensification <strong>of</strong> farm<strong>in</strong>g, which people claim has also created more jobopportunities for the landless and small holders. We do not however have numbersor specific <strong>in</strong>formation support<strong>in</strong>g this claim.- The diversity <strong>of</strong> crops has <strong>in</strong>creased availability <strong>of</strong> forage, but overall, farmers havereported a decrease <strong>in</strong> animal numbers. The status <strong>of</strong> livestock rear<strong>in</strong>g as alivelihood option is not clear. Key <strong>in</strong>formants and FORWARD field technicians haveall reported that livestock numbers are decreas<strong>in</strong>g, yet dur<strong>in</strong>g one group discussionwith a group <strong>of</strong> Bahun Chhetris farmers identified buffalo milk production as a goodearner estimat<strong>in</strong>g their net pr<strong>of</strong>it at about 5000 NRs per year. If one considers that,as someone reported, rent<strong>in</strong>g 1 Bigha <strong>of</strong> land costs 1380NRs per year, this makesmilk production economically attractive (as 1 bigha would on average ensure foodsecurity for the year for an average family). Farmers were also <strong>in</strong>terested <strong>in</strong> theproduction <strong>of</strong> farm yard manure. A group <strong>of</strong> Brahm<strong>in</strong> women also reported hav<strong>in</strong>g<strong>in</strong>vested one loan from the rural bank and bought a buffalo. The loan was repaid to<strong>in</strong>vest <strong>in</strong> goats as the money from goats is ‘good bus<strong>in</strong>ess’.90
- The absence <strong>of</strong> irrigation is a major constra<strong>in</strong>t to cultivat<strong>in</strong>g upland dur<strong>in</strong>g the dryseason between March and May and is identified by many farmers as the reasonwhy they don’t grow chick pea and mungbeans.- Interviewed farmers reported a decrease <strong>in</strong> area under share <strong>cropp<strong>in</strong>g</strong> because now,with <strong>in</strong>tensification <strong>of</strong> farm<strong>in</strong>g, smaller medium land owners have less need <strong>of</strong> extraland as they are busy on their own land which now produces more. At the same timebigger landlords are keen to get tenants so potential tenants are <strong>in</strong> stronger positionto barga<strong>in</strong> the conditions – e.g. to choose land or accept only a m<strong>in</strong>imum size <strong>of</strong>tenure. Tables 3 and 5 highlight the importance for small land owners <strong>of</strong> access toshare <strong>cropp<strong>in</strong>g</strong>. In the case <strong>of</strong> Badehara, extra land ensures longer food selfsufficiency but also no one is migrat<strong>in</strong>g whilst <strong>in</strong> the case <strong>of</strong> Gajeda where there is noshare <strong>cropp<strong>in</strong>g</strong> <strong>in</strong> our sample group the reliance on migration is important for thehousehold. Table 4 also shows that the land <strong>of</strong>fered <strong>in</strong> share <strong>cropp<strong>in</strong>g</strong> can <strong>of</strong>ten be <strong>of</strong>poorest quality.Access to share <strong>cropp<strong>in</strong>g</strong> is not only dependent on availability <strong>of</strong> land but also isl<strong>in</strong>ked to the availability <strong>of</strong> labour with<strong>in</strong> the household and the level <strong>of</strong> assets. Dur<strong>in</strong>gthe discussion <strong>in</strong> Badahara with the group <strong>of</strong> dalits and janajati who are food securefor less than 3 months, they commented that most families (with<strong>in</strong> their socioeconomiccategory) are not <strong>in</strong>volved <strong>in</strong> share <strong>cropp<strong>in</strong>g</strong> because they do not havesufficient capital to hire labour to fill their labour deficit; but also, as the landowners <strong>in</strong>Badahara refuse to share any <strong>of</strong> the <strong>in</strong>puts, most <strong>of</strong> the landless and smalllandown<strong>in</strong>g families do not have enough money to cover the cost <strong>of</strong> seeds, fertilisersand plough<strong>in</strong>g. Dur<strong>in</strong>g the group discussion with women <strong>in</strong> Badahara this wasconfirmed: labour and cash availability limits access to share <strong>cropp<strong>in</strong>g</strong>. Some <strong>of</strong> thewomen also commented that out <strong>of</strong> those families <strong>in</strong>volved <strong>in</strong> share <strong>cropp<strong>in</strong>g</strong> abouthalf had to grow what the landowner dictates and none <strong>of</strong> the landowners share theproduction costs. This underl<strong>in</strong>es the fact that <strong>in</strong> order to address food deficiency forthe poor, improved technology is only one aspect and <strong>in</strong>terventions should alsoconsider other dimensions <strong>of</strong> livelihoods such as f<strong>in</strong>ancial, human and natural capital.This is noth<strong>in</strong>g new but still <strong>of</strong>ten ignored.Jhapa districtSome <strong>of</strong> the villages we visited <strong>in</strong> Jhapa are clearly better <strong>of</strong>f, with most farmers report<strong>in</strong>ggreater food self sufficiency and much larger land hold<strong>in</strong>gs (<strong>of</strong> Medium land) than <strong>in</strong>Kapilvastu. This is consistent with Jhapa be<strong>in</strong>g <strong>in</strong> the category <strong>of</strong> wealthy districts <strong>in</strong> <strong>Nepal</strong>.Yet there is also great variation <strong>in</strong> land fertility with<strong>in</strong> the district, l<strong>in</strong>ked to subtletopographical changes; <strong>in</strong> the same VDC <strong>of</strong> Juropani, 20 Kathas <strong>of</strong> medium land seem toensure 12 months <strong>of</strong> food security <strong>in</strong> Thakthake whilst <strong>in</strong> Gwalduba 30 Kathas are notsufficient to feed a family <strong>of</strong> similar size for the whole year.a. Changes <strong>in</strong> Livelihoods- Similar changes have been reported to those <strong>in</strong> Kapilvastu. Overall health andnutrition status has improved and people send their children to school or to betterschools. Social expenses have decreased and one group <strong>of</strong> Satar people reportedthat sell<strong>in</strong>g land to pay for marriages has now more or less stopped as ceremonyexpenses have decreased.- Nutrition has improved because <strong>of</strong> a diversification <strong>in</strong> diet; and also due to betterquality <strong>of</strong> product, ma<strong>in</strong>ly <strong>in</strong> <strong>rice</strong>. Even poorer women reported eat<strong>in</strong>g better quality<strong>rice</strong> which they found more nutritive (but they did not <strong>in</strong>dicate the variety).91
- Though dependency on private money lenders has decreased, cheap credit is notalways available: an <strong>in</strong>terest rate charged by one NGO <strong>of</strong> 25% per year has beenreported. In dalits villages the dependency on more traditional sources <strong>of</strong> cash is stillprevail<strong>in</strong>g. Women reported that when they borrow <strong>in</strong> cash or k<strong>in</strong>d aga<strong>in</strong>st futurelabour the landowner will also charge a heavy <strong>in</strong>terest rate. So for example if thedaily rate is 100 NRs, a woman who is <strong>in</strong>debted to the landowner may get paid only60 NRs/day.Overall the number <strong>of</strong> self help groups focus<strong>in</strong>g on provid<strong>in</strong>g credit facilities has<strong>in</strong>creased as a result <strong>of</strong> the LGP work, and people also commented that one <strong>of</strong> thechanges <strong>in</strong> the last decade was a greater sense <strong>of</strong> group cohesion and solidarity.- One group <strong>of</strong> Rajbanshi people with half a year <strong>of</strong> food security reported a decrease<strong>in</strong> seasonal migration due to <strong>in</strong>creased labour demand <strong>in</strong> the village and moregenerally people have commented on the <strong>in</strong>creased demand for local labour as aresult <strong>of</strong> two grow<strong>in</strong>g seasons.- Women have reported changes as well, but none are directly related to the RNRSS<strong>in</strong>terventions. Women <strong>in</strong> Juropani for example reported that <strong>in</strong> the last decade,because <strong>of</strong> more external <strong>in</strong>tervention such as the Local Governance Program, theyhave been exposed more to outsiders and outside ideas and feel more aware <strong>of</strong> theimportance <strong>of</strong> education, especially for girl, and health. They also go to the localmarket to sell their vegetables and can go and work on other people’s farms. InGwaldubba, where women have traditionally been <strong>in</strong>volved <strong>in</strong> the production <strong>of</strong>bhuja, or <strong>rice</strong> flakes, technology has made processed <strong>rice</strong> available <strong>in</strong> the market.This has decreased their labour and more people have been <strong>in</strong>volved <strong>in</strong> thebus<strong>in</strong>ess. They also commented on decreased gender discrim<strong>in</strong>ation - though, asdiscussed above, women’s labour is still exploited by landowners and women’swages for equal work are still below the men’s wages.b. Changes <strong>in</strong> agriculture- Irrigation facilities with private tube wells have been a major change and farmers withno private facilities will pay per hour <strong>of</strong> use (NRs 50 per hour). Irrigation has becomepossible with the spread <strong>of</strong> electrification. But <strong>in</strong>vest<strong>in</strong>g <strong>in</strong> irrigation requires am<strong>in</strong>imum area <strong>of</strong> land <strong>in</strong> one block as is it too costly to <strong>in</strong>vest <strong>in</strong> irrigation forscattered plots. Informants reported that when Bahun Chhetris families divide theland between the heirs they try to ma<strong>in</strong>ta<strong>in</strong> as far as possible hold<strong>in</strong>gs on s<strong>in</strong>gleblocks; whilst other groups tend to divide each plot <strong>of</strong> land equally between each heirresult<strong>in</strong>g <strong>in</strong> smaller and smaller plots and also scattered hold<strong>in</strong>gs. This could expla<strong>in</strong>why Bahun Chhetris families we met <strong>in</strong> Jhapa were more likely than others to haveaccess to their own irrigation facilities.- All groups mentioned hav<strong>in</strong>g <strong>in</strong>creased their agriculture knowledge as a result <strong>of</strong>FORWARD’s <strong>in</strong>tervention. They have learnt about shorter duration <strong>rice</strong> varieties andthe possibility to grow w<strong>in</strong>ter crops; and they use more fertilisers and pesticides.- There does not seem to be a def<strong>in</strong>ed strategy for seed management. In all thegroups different people do different th<strong>in</strong>gs - from shar<strong>in</strong>g and exchang<strong>in</strong>g betweenrelatives, shar<strong>in</strong>g and exchang<strong>in</strong>g between neighbour, stor<strong>in</strong>g seeds from their ownharvest, to purchas<strong>in</strong>g seeds from the markets, the Agrovets, or even India.92
- The <strong>in</strong>troduction <strong>of</strong> the shorter duration <strong>rice</strong> has allowed <strong>in</strong>tensification <strong>of</strong> agriculturewith considerable decrease <strong>of</strong> fallow land. This has <strong>in</strong>creased labour requirements,as well as production, extended food self sufficiency by 2-3 months for the small andmedium farmers. The reduction <strong>of</strong> <strong>fallows</strong> also has an impact on green fodderavailability and hence every one reported decrease <strong>in</strong> livestock. In all the groupsfarmers have reported a decrease <strong>in</strong> livestock because <strong>of</strong> the reduction <strong>of</strong> graz<strong>in</strong>gground due to the <strong>in</strong>crease <strong>of</strong> the grow<strong>in</strong>g period. It seems this <strong>in</strong>tensification hasalso had an impact on share <strong>cropp<strong>in</strong>g</strong> with many farmers giv<strong>in</strong>g up the practice whilstlandowners are seek<strong>in</strong>g more and more share croppers. Because <strong>of</strong> their capacity to<strong>in</strong>vest <strong>in</strong> migration some landowners are send<strong>in</strong>g able male family members onoverseas migration. This has decreased the availability <strong>of</strong> labour, <strong>in</strong>creased the needto f<strong>in</strong>d share croppers - and hence <strong>in</strong>creased availability <strong>of</strong> land for traditionallyexcluded people such as the Satars. At the same time, as share croppers get moreyields from their fields and are also more busy on their own land they do not haveenough surplus labour with<strong>in</strong> the household to cont<strong>in</strong>ue share <strong>cropp<strong>in</strong>g</strong>. Amongst theSatars (e.g. <strong>in</strong> Juropani), who have been traditionally landless, only a few haveenough assets to start cultivat<strong>in</strong>g <strong>in</strong> share <strong>cropp<strong>in</strong>g</strong> arrangements. For those whohave been able to <strong>in</strong>vest 50% <strong>of</strong> the production costs they have been able to growtheir own food for 3 to 6 months and hence buy less gra<strong>in</strong> and also work less onother people’s land. So there is def<strong>in</strong>itively a shift <strong>in</strong> tenure patterns with traditionallyexcluded people start<strong>in</strong>g to cultivate land partially for their own benefit. This can bepartly attributed to the <strong>in</strong>troduction <strong>of</strong> the shorter duration <strong>rice</strong> varieties, but not solelyRNRSS varieties.- Hard<strong>in</strong>ath (formerly known as BG 1442) is the variety adopted by most farmers (seeTables 6 and 7) even <strong>in</strong> non FORWARD villagers. It was released by the DADO <strong>in</strong>2006 or so and seeds are now easily available through the market. All the farmers <strong>in</strong>Tables 5 and 6 have only medium land. A few grow Mung beans and <strong>in</strong> small areas.Farmers reported that FORWARD distributed OR 367 but despite good yield andgood quality straw the market p<strong>rice</strong> was not satisfactory and so people stoppedgrow<strong>in</strong>g the variety.Table 6: Data from FGD Jambadi chowk Food secure B-C (Jhapa)Farmer Land Family Cropssize sizeB-C 10 (25) 7 Hard<strong>in</strong>ath (dur<strong>in</strong>g ra<strong>in</strong>y season will lodge and prone topest)Tori (local variety) 4-5 K sorghumB-C 40 4 Mansuli 20K, Ranjit 20, Bhale 10Rape seed, mustard, Hybrid Maize, Wheat (2-3K) (Fodder4-5K)Chaite season Hard<strong>in</strong>ateDoes not grow Muong beans because <strong>of</strong> droughtB-C 30 (15purchasedrecently)4 Mansuli, Ranjit, BhaleTori (4-5 K)MaizeB-C 25 6 Mansuli ½, Bhale ½Tori (4-5 K)Maize, (4-5K), wheat (4-5K)SargumFallowB-C 30 6 Mansuli 13K, Bhale 5K, Ranjit 12KTori (10-12K)Wheat (5-7K)93
Table 7: Data from FGD Jambadi chowk Food secure Rai (Jhapa)Farmer Land size Family CropssizeRai 28 4 Mansuli (20K)Bhale (8K)Tori (3K), Maize (4 K) , Niger (2K)Chaite Rice: fallow, tried Mung beans but water loggedand Hard<strong>in</strong>ath (15 K)Rai 21 4 Mansuli (15K), Bhale (10K)Tori (4-5 K)Hard<strong>in</strong>ath (15K)Mung beans (1.5 K )Rai 25 5 Mansuli ½, Bhale ½Tori (4-5 K)Maize, (4-5K), wheat (4-5K)SargumFallowRai 30 6 Mansuli 13K, Bhale 5K, Ranjit 12KTori (10-12K)Wheat (5-7K)Rai 40 6 R.P Mansuli 30K, Mansoli 10 KTori (10-12K), Maize (3K) potatoes (1-2K)Hard<strong>in</strong>ath (20 K) as summer <strong>rice</strong>Mung beans (1K)- Mung bean which was <strong>in</strong>troduced by FORWARD has met with varied success. Mostvillagers who grow the crop, grow their local varieties as they reported that improvedvarieties are too risky to grow, even though local varieties are far less productive.Improved varieties are <strong>in</strong>put dependent and more labour <strong>in</strong>tensive: because they aregrown on irrigated land for better yield it requires frequent weed<strong>in</strong>g and hence it iscostly to grow. In Thakthake we met with a group <strong>of</strong> growers who have adopted theimproved varieties. However they reported decreas<strong>in</strong>g <strong>in</strong>terest as they cannot f<strong>in</strong>dsatisfactory markets. Whilst mung bean is a pr<strong>of</strong>itable crop (a reported net benefit <strong>of</strong>NRS 1200 per Kattha as opposed to NRS600 per Kattha <strong>of</strong> Hard<strong>in</strong>ath) only wealthierfarmers can grow it. Farmers reported that <strong>in</strong>itially FORWARD bought the beans at ahigher p<strong>rice</strong> directly from the farmers. Improved varieties are <strong>in</strong>put <strong>in</strong>tensiveespecially require more labour than local varieties (due to irrigation more weed<strong>in</strong>g isnecessary). The storage <strong>of</strong> seeds has also been reported as a problem by manyfarmers. So <strong>in</strong> short the determ<strong>in</strong><strong>in</strong>g factors affect<strong>in</strong>g adoption are a comb<strong>in</strong>ation <strong>of</strong>:labour availability, capacity to absorb risk, ability and knowledge to store seeds,access to seeds, capacity to purchase fertilisers and market p<strong>rice</strong>.- Kabuli chick pea is not grown <strong>in</strong>tensively as it is prone to pest damage and sensitiveto moisture. It also requires more frequent weed<strong>in</strong>g then local varieties.- Dependency on chemical <strong>in</strong>puts has been reported <strong>in</strong> many places. Less than adecade ago people used only organic fertilisers. Now though chemical fertilisers have<strong>in</strong>creased productivity; and farmers notice that when they don’t apply fertilisers theyget even worse results that when they used to apply manure. They claimed thatfertiliser is also <strong>of</strong> bad quality and is not always available on a timely basis.94
INSIGHTS: IMPACT AND ISSUES OF RRC TECHNOLOGIESMethodologically a straight forward assessment <strong>of</strong> impact is impossible, as no base l<strong>in</strong>eswere conducted by FORWARD at the time <strong>of</strong> the seeds release and no record was keptabout who got seeds from whom and when. As already mentioned, it is also impossible toclearly attribute specific impacts solely to the <strong>in</strong>troduction <strong>of</strong> the new <strong>rice</strong> varieties and mungbeans or Chick pea, as many other <strong>in</strong>terventions and changes occurred dur<strong>in</strong>g the sameperiod. Nevertheless, though it is impossible to quantify, it can be safely claimed that the<strong>in</strong>troduction <strong>of</strong> higher yield<strong>in</strong>g <strong>rice</strong> varieties (some <strong>of</strong> them RNRSS related), and spr<strong>in</strong>g <strong>rice</strong>varieties have allowed an <strong>in</strong>crease <strong>in</strong> overall food production per household as well as <strong>of</strong>productivity per unit <strong>of</strong> land. The impact <strong>of</strong> mung beans and chick pea has been mixed aseven for wealthier farmers, able to take risk are now reconsider<strong>in</strong>g whether or not to reducetheir area <strong>of</strong> land under these crops. However, given the small acreage <strong>of</strong> land available tomost households, these <strong>in</strong>crements will always have a limited impact. An <strong>in</strong>crease <strong>of</strong> gra<strong>in</strong> tosatisfy food needs <strong>in</strong> a the household by 2 months can be crucial at the household level butfor most small farmers it will never result <strong>in</strong> a drastic change <strong>of</strong> the farm<strong>in</strong>g system orlivelihoods opportunities. Land availability and suitability are major constra<strong>in</strong><strong>in</strong>g factors <strong>in</strong><strong>Nepal</strong>, and though science and technical improvements are necessary and will help, they willnever be enough unless structure constra<strong>in</strong>ts such as land scarcity will be addressed.- Tangible outcomes: <strong>in</strong>creased food security by 2-4 months for everyone thanks to theshorter duration <strong>rice</strong> variety such as Hard<strong>in</strong>ath: a diversified diet with the <strong>in</strong>creasedavailability <strong>of</strong> pulses (mostly lentils); and <strong>in</strong>creased knowledge <strong>of</strong> agriculturepractices. These po<strong>in</strong>ts have been consistently mentioned throughout the survey andhave been attributed by the respondents to the <strong>in</strong>terventions.- Possible attributable outcomes: improved diet, which is a logical consequence <strong>of</strong> thetechnologies <strong>in</strong>troduced: there is more food to eat but also people commented on<strong>in</strong>creased nutritional quality <strong>of</strong> <strong>rice</strong>. But these improvements could also be l<strong>in</strong>ked to asynergy between a number <strong>of</strong> other factors. Shifts <strong>in</strong> land tenure can be partlyattributed to the <strong>in</strong>tensification <strong>of</strong> agriculture. As wealthier landowners are<strong>in</strong>creas<strong>in</strong>gly short <strong>of</strong> labour this may open opportunities for traditionally landlessgroups. However here too some form <strong>of</strong> support is necessary to <strong>in</strong>crease the assets<strong>of</strong> the poorest and the <strong>in</strong>novative technology is not enough.People we spoke to have been very positive about these new varieties <strong>in</strong>troduced and theyhave seen tangible benefits <strong>in</strong> higher production: yet there have been no reports <strong>of</strong>spectacular livelihoods improvements with <strong>in</strong>creased <strong>in</strong>vestments on the farms orentrepreneurial take <strong>of</strong>f. The absence <strong>of</strong> good markets for example has been mentioned asa deterrent to <strong>in</strong>vest <strong>in</strong> large scale mung beans cultivation which is also a rem<strong>in</strong>der <strong>of</strong> therole played by the broader context <strong>in</strong> the adoption <strong>of</strong> new technology and <strong>in</strong>novations. Thecurrent lack <strong>of</strong> clarity on land tenure policy is also a factor h<strong>in</strong>der<strong>in</strong>g risk tak<strong>in</strong>g for farmers.With the new government and the Maoist pledge for land reform, landowners are wait<strong>in</strong>g tosee what will happen. This <strong>in</strong>fluences their decisions: to <strong>in</strong>vest or not <strong>in</strong> their farms; todiversify their livelihoods by <strong>in</strong>tegrat<strong>in</strong>g overseas migration as one option; to <strong>in</strong>vest <strong>in</strong> bettereducation for their children, who will leave agriculture; and to enter <strong>in</strong>to share <strong>cropp<strong>in</strong>g</strong> orrent<strong>in</strong>g agreement for longer periods.Crops requir<strong>in</strong>g <strong>in</strong>tensive management such as higher <strong>in</strong>puts <strong>in</strong> fertilisers or weed<strong>in</strong>g likemung beans or chick pea are less likely to be suitable for the poor. The group <strong>of</strong> mungbeans growers <strong>in</strong> Thakthake were all food secure Bahun Chhetris farmers and they werereconsider<strong>in</strong>g their strategy because <strong>of</strong> unsatisfactory market access. This shows that ifeven relatively better <strong>of</strong>f farmers struggle to adopt the technology, the technology on its own,without careful support packages, will rema<strong>in</strong> out <strong>of</strong> reach for the poor. One potential worry,which has been commented on <strong>in</strong> many FGDs, especially <strong>in</strong> Jhapa, is the <strong>in</strong>creased95
dependency on chemical <strong>in</strong>puts because it compromises environmental susta<strong>in</strong>ability butalso makes it even harder for the poorest.This would suggest that for future work more careful consideration should be given to theprocess <strong>of</strong> <strong>in</strong>troduc<strong>in</strong>g and dissem<strong>in</strong>at<strong>in</strong>g the technology. There seems to be the unspokenassumption that because some farmers have been <strong>in</strong>volved at some po<strong>in</strong>t dur<strong>in</strong>g theprocess <strong>of</strong> varietal selection or identification <strong>of</strong> suitable characteristics, the result<strong>in</strong>gtechnology will be adopted, attractive and produce positive impacts. The data would suggestthat the seeds proved very attractive but have produced more impact for relatively better <strong>of</strong>ffarmers because the focus <strong>of</strong> the <strong>in</strong>tervention has been on technological research ratherthan supportive extension approaches.References:Acharya R.N. 1999: The impact <strong>of</strong> share tenancy on resource allocation; evidence from<strong>Nepal</strong>, paper presented at the AAEA annual meet<strong>in</strong>g 1999, Nashville, 16pp.Acharya S. (2004) Measur<strong>in</strong>g and analys<strong>in</strong>g poverty (with a particular reference to the case<strong>of</strong> <strong>Nepal</strong>), In the European Journal <strong>of</strong> comparative economics, Vol 1, (2) 195-215.Khadka M. (forthcom<strong>in</strong>g): Why does exclusion cont<strong>in</strong>ue? Aid knowledge and power <strong>in</strong><strong>Nepal</strong>’s community Forestry policy process, PhD thesis to be defended <strong>in</strong> December 2009,Institute <strong>of</strong> Social Studies, The Hague.Khanal, N., Joshi, K.D. andHarris, D. (2004) Work<strong>in</strong>g with systems perspective: An<strong>in</strong>novative approach to improve overall systems productivity <strong>in</strong> <strong>Nepal</strong>, FORWARD TechnicalPaper No 26Rai Paudyal B. (2008) Agrarian structures and distributive outcomes. A study <strong>of</strong> CommunityForestry <strong>in</strong> <strong>Nepal</strong>, PhD thesis, Institute <strong>of</strong> Social Studies, The Hague 314pp96
ANNEXESAnnex A: Schedule and processArrival 9 th January 2009: meet<strong>in</strong>g with Dr K. Joshi to discuss schedule, logistics andselection <strong>of</strong> districts and villages. Due to current social unrest it was agreed to change theorig<strong>in</strong>al choice <strong>of</strong> district for the field work <strong>in</strong> Kapilvastu makes sense from a logisticperspective and will save on transport time. Jhapa was also added because it is a districtshow<strong>in</strong>g a different sett<strong>in</strong>g and a high adoption <strong>of</strong> one <strong>rice</strong> variety.10 th /1: travel to Bharatpur, meet<strong>in</strong>g at FORWARD <strong>of</strong>fice with Li-BIRD and FORWARD teamsto plan the field work. It is agreed to <strong>in</strong>itial plan work <strong>in</strong> 2 villages with relative high adoptionor <strong>in</strong>tense activity as well as one village with low activity despite project <strong>in</strong>tervention. Weleave open the possibility to work <strong>in</strong> more villages depend<strong>in</strong>g on outcomes <strong>of</strong> first villages.The plan at present is as follows:• Initial meet<strong>in</strong>gs with Key <strong>in</strong>formants <strong>in</strong> each village followed by a selection <strong>of</strong> FGD toexplore the theme <strong>of</strong> livelihoods changes. The number <strong>of</strong> FGDs per village willdepend on the context. For example <strong>in</strong> some ethnically homogeneous villagesethnicity will not be a factor to consider <strong>in</strong> select<strong>in</strong>g representative groups. On thetheme <strong>of</strong> livelihood changes there needs to be FGDs compositions represent<strong>in</strong>ggender differences, ethnicity, economic and land ownership status, level <strong>of</strong> adoptionor not with a possibly focus on some varieties <strong>of</strong> crops. For the question <strong>of</strong>susta<strong>in</strong>ability and empowerment selective representativity is deemed less necessary.• Depend<strong>in</strong>g on outcome <strong>of</strong> FGDs there may be a need for semi-structured <strong>in</strong>terview <strong>of</strong>specific households or <strong>in</strong>dividuals.• M. Buchy will lead the <strong>in</strong>terviews on day 1 and subsequently the field teams will bedivided <strong>in</strong>to pairs. At the end <strong>of</strong> each day the results will be shared and discussedand <strong>in</strong>fluence the work for the follow<strong>in</strong>g day.Rice and Rabi Crop Study16 th : Travel to Kapilvastu, meet with Forward teamKey <strong>in</strong>formant meet<strong>in</strong>gs <strong>in</strong> Jaynagar 3- Pur<strong>in</strong>a and Gajeda Tole (both considered byFORWARD team as high adoption villages).It transpired later that ‘High adoption’ refers tohigh adoption <strong>of</strong> the new technology at the time <strong>of</strong> the <strong>in</strong>tervention. The same level <strong>of</strong>adoption might not have been ma<strong>in</strong>ta<strong>in</strong>ed after the end <strong>of</strong> the BGO’s presence <strong>in</strong> the village.The Gajeda meet<strong>in</strong>g turned <strong>in</strong>to a B-C women, food secure meet<strong>in</strong>g so we decidedafterwards to seek another Tole <strong>in</strong> the same village17 th : FGD meet<strong>in</strong>gs <strong>in</strong> Jaynagar 3- Pur<strong>in</strong>aFGD with Tharu with less than 3 months food securityFGD with Tharu with 6 months food securityFGD with BC with 6 months food securityFGD with food secure B-CFGD with women B-C with less than 3 months Food security18 th : FGD meet<strong>in</strong>gs <strong>in</strong> Badahara VDC (considered by the Forward team as a low adoptionvillage). This is also a mixed caste village with a large number <strong>of</strong> Dalits and Janajaty peoplewith BC be<strong>in</strong>g a m<strong>in</strong>ority group <strong>in</strong> this village.FGD with Dalit and Janajaty, landless and maximum food security <strong>of</strong> 3 monthsFGD with women97
FGD with BC Food secureFDG with food security <strong>of</strong> 6 months(it was not possible to gather a group <strong>of</strong> food secure Tharu people)19 th : travel to Khatmandu . meet<strong>in</strong>g at CAZS <strong>of</strong>fice, choice <strong>of</strong> villages <strong>in</strong> Jhapa and travel onto Jhapa district. We chose 3 villages, 2 considered as high adoption villages, one ethnicallyand socially mixed and one low adoption village.Note: Once <strong>in</strong> the field the strategy changed a bit and we decided to seek out poorer groupsor poorer villages rather than only look at 2 examples <strong>of</strong> high adoption villages. We alsodecided to see a village which had had no FORWARD <strong>in</strong>tervention but was 2 km away fromone that had seen some <strong>in</strong>tervention. This we thought might give us some <strong>in</strong>dication <strong>of</strong>spread but also see whether this village too was report<strong>in</strong>g similar overall changes.20 th : Visit to Jambadi chowk village, Meet<strong>in</strong>g with Key <strong>in</strong>formants to establish list <strong>of</strong> farmersand decide on FGDs. As about every HH is food secure we decided to organise 2 foodsecure groups <strong>of</strong> B-C and Janajatis (mostly Rais) and a group <strong>of</strong> Dalits (ideally with only 6months or less <strong>of</strong> food security, but it turned out to be a mixed food security status group)and a group <strong>of</strong> women.21 st : visit to Jurapani – 4 Thakthake and 6 Gwalduba and meet<strong>in</strong>gs with key <strong>in</strong>formants.Both tole at the time <strong>of</strong> FORWARD project were considered as a high adoption tole.Thakthake is a B-C dom<strong>in</strong>ated community and only the Dalits and Satar (adivasi group <strong>of</strong>tribes) are either landless or with very low food security. We <strong>in</strong>terviewed a group <strong>of</strong> Satarpeople.In Gwalduba the community is dom<strong>in</strong>ated by satar people. We held a FGD with a group <strong>of</strong>food secure and an FGD with a group <strong>of</strong> above 6 months <strong>of</strong> food security.22 nd : Cont<strong>in</strong>ued FGDs <strong>in</strong> Gwalduba with a group <strong>of</strong> less than 6 month food security and agroup <strong>of</strong> women.FGD <strong>in</strong> Thakthake with a group <strong>of</strong> B-C mung beans adoptersVisit to Juropani 1 a village which has not had any FORWARD <strong>in</strong>tervention: 2 FGD with foodsecure and around 6 months food secure farmers and 1 FGD with women’s. This village isdom<strong>in</strong>ated by Rajbanshy people.98
Annex B: Complementary dataTable 8: Data provided by a women’s meet<strong>in</strong>g <strong>in</strong> Gajeda tole Kapilvastu on land ownership,food security and migration patternsCaste/ethnicity<strong>of</strong> familyFamilysizeLand (ShareCropp<strong>in</strong>g)Type <strong>of</strong> landFoodsecurity(months)Migration(months)B-C 15 ML 12B-C 19 4ML/15LL 12B-C 5 1/2 ML 1 yearlyB-C 7 (40) ML 12 yearlyB-C 5 20 ML 12 Indian ArmyB-C 6 7 ML 6 India (2-4)B-C 5 16 16LL 12B-C 7 3.5UP/3.5LL 12 (6)B-C 4 3 3UP 2 yearlyB-C 8 12 ML 12B-C 6 9 LL 12 MalaysiaB-C 3 5 2.5UP/2.5LL 12 Service holderB-C 4 5 2.5UP/2.5LL 12 yearlyB-C 6 11 5.5UP/5.5LL 12 QuatarB-C 4 8 8UP 12 yearlyJanjaty 6 10 5UP/5LL 12 yearlyJanjaty 4 3(15) ML 12Janjaty 4 3(10) ML 6 YearlyB-C 6 7 3.5UP/3.5ML 12 Quatar & IndiaB-C 6 3(9) 6UP/6ML 12B-C 7 15 ML 12 QuatarB-C 4 4 ML 6-7 YearlyB-C 4 25 ML 12 QuatarB-C 6 5 ML 12B-C 6 5 ML 4 YearlyB-C 4 10 ML 12 DubaiB-C 4 3 ML 3 India (8)Yearly migration means migration to IndiaB-C: Bahun-Chhetris99
Table 9: Data from Jayanagar (Badahara 9) Kapilvastu on land ownership, food security andmigration patterns provided by key <strong>in</strong>formantsCaste/ethnicity<strong>of</strong> familyFamilysizeLand size (sc) Type if land Foodsecurity(months)migrationTharu 9 4 UP 4 yearlyTharu 11 10 (60) 15UP/10ML/45LL 12 yearlyTharu 4 10 (40) 10UP/30ML/10LL 12 9 monthsTharu 11 50 10UP/40ML 12 6 monthsTharu 6 5 5ML 2 yearlyTharu 4 5 (200 5UP/20ML 9 6 monthsTharu 5 10 3UP/7ML 6 8 monthsTharu 9 30 (30) 15UP/45ML 12Tharu 9 35 10UP/25ML 12Tharu 8 10 (30) 15UP/25ML 12 9 monthsTharu 4 10 (20) 15UP/15ML 12 9 monthsTharu 4 1/2 1/2ML no yearlyTharu 5 4 (all given sc) 4ML 1 yearlyTharu 7 4 (all given sc) 4ML yearlyTharu 8 8 (all given sc) 2UP/6ML 2 yearlyTharu 5 19 5UP/14ML 9 8 monthsTharu 7 8 2UP/6ML 3 yearlyTharu 9 19 4UP/14ML 6 yearlyTharu 5 1/2 yearlyTharu 5 10 3UP/7ML 4 yearlyTharu 4 4 (5) 9UP 6Tharu 2 4 (15) 5UP/14/ML 12 Local/yearlyTharu 5 10 10UP 8 yearlyTharu 4 15 (15) 15UP/15/ML 12 yearlyTharu 5 10 (30) 10UP /30ML 12 yearlyTharu 10 10 (5) 15UP 5 KatarTharu 5 1 1UP 0 KatarTharu 5 3 3UP 1 Katar (w)Tharu 6 1 1UP 0 yearlyTharu 2 2 2ML 2 retiredTharu 4 1/2 1/2ML 0 yearlyTharu 5 1/2 1/2ML no yearlyB-C 5 1 1UP no Saudi A (w)B-C 14 18 9UP/9ML 8 localB-C 9 10 30ML 12B-C 5 11 11ML 12 Oman(w)B-C 3 1 1ML no KatarB-C 13 2 2ML no KatarB-C 5 15 15ML 12 LocalBusisness(w) <strong>in</strong>dicates that the woman is migrat<strong>in</strong>gLL= low land, ML= Medium land; UL= Up land100
Table 10: Data from Gauradaha -5 Jambadi Chowk Jhapa (provided by key <strong>in</strong>formants) onland ownership, food security and migration patternsCaste/ethnicity<strong>of</strong> familyFamilysizeLand(ShareCropp<strong>in</strong>g)Type <strong>of</strong>LandFoodsecuritymonthsMigrationRai 4 28 ML 12Rai 6 21 12Rai 4 2.5 UL 2 KhatmanduRai 6 22 ML 10Rai 5 30 ML 12Rai 6 (40) ML 12Rai 2 15 ML 12 GulfRai 5 15 ML 10Rai 7 16 (30) ML 12Rai 7 5 UL 2 Local LabourDalits 8 20 ML 10 GulfDalits 6 15 ML 11 BlacksmithDalits 11 30 ML 12 GoldsmithDalits 6 10 6 Bicycle repairDalits 5 10 6 Labour/IndiaDalits 2 3 2 Local labourDalits 7 30 12Dalits 5 10 8 bus<strong>in</strong>essDalits 9 20 8 GoldsmithDalits 9 20 8 ½ year IndiaDalits 7 20 8 GoldsmithBC 6 25 12 Saudi ABC 6 18 12 Local labourBC 7 10 (25) 12 Local labourBC 5 20 12BC 6 35 UL 12BC 6 13 UL 8 GulfBC 7 50 12BC 4 40 12BC 4 18 12 GulfBC 8 3 (rented) UL 12 carpenter(30)BC 5 20 (R) (20) 12 GulfBC 4 30 12 MalaysiaBC 4 30 12 GulfBC 9 30 12 CarpenterKTMBC 5 30 12 GulfBC 8 20(R) (30) 12 Gulf+ policeBC 7 20 (20) 12BC 5 30 12BC 8 (40) UL 10 GulfBC 6 30 12BC 6 10 UL 6 GulfLL= low land, ML= Medium land; UL= Up land101
Table 11: Data from Juropani-6 Gwalduba ( provided by key <strong>in</strong>formants) on land ownership,food security and migration patternsCaste/ethnicity<strong>of</strong> familyFamilySizeSize <strong>of</strong> landMonths <strong>of</strong>FoodsecurityMigrationRajbanshi 4 5 K (UL) 13 K (ML) 6Rajbanshi 4 5 (UL) 12 (LL) 6 3 months, sweaterweav<strong>in</strong>gRajbanshi 4 2 (UL) 30 (ML) 9Rajbanshi 3 15 (UL) 65 (ML) 12Rajbanshi 4 40 (ML) 9Rajbanshi 4 ½ (UL) 0 New Delhi 4monthsRajbanshi 4 2 (UL) 1 carpenterRajbanshi 5 20 (UL) 15 (ML) 8Rajbanshi 3 2 (UL) 0 teacherRajbanshi 7 3(UL) 16 (ML) 2 2 men <strong>in</strong> New Delhi6 monthsRajbanshi 5 14(UL)126 (ML) 12 2 teachersRajbanshi 6 4(UL) 2 weeks Sweater weaverRajbanshi 5 ½ (UL) 0 ?Rajbanshi 9 7(UL) 133 (ML) 12Rajbanshi 6 60(ML) 12 Local bus<strong>in</strong>essRajbanshi 5 5(UL) 45(ML) 12 Local Bus<strong>in</strong>essRajbanshi 7 3(UL) 2 weeks Shop keeperRajbanshi 4 landless Agriculture LabourRajbanshi 3 1/2(UL) 0 Agriculture labourRajbanshi 3 1(UL) 0 Agriculture LabourRajbanshi 4 1(UL) 0 Tea shopRajbanshi 3 landless carpenterRajbanshi 5 10(UL) 10 (ML) 9Rajbanshi 5 20(UL) 30 (ML) 9Rajbanshi 6 1(UL) 19 (ML) 8 Sweater weaverRajbanshi 5 1.5(UL) Tea shopRajbanshi 2 6.5(UL) 3 Agriculture LabourRajbanshi 5 1.5(UL) 2 <strong>in</strong> New Delhi,cycle repairsRajbanshi 5 3.5(UL) 2 weeks Agriculture labourRajbanshi 5 4(UL) 6 (ML) 2 Agriculture labourRajbanshi 5 1.5(UL) 6.5 (ML) 2 Agriculture labourRajbanshi 7 1(UL) Tea shop, + labourRajbanshi 2 6(UL) 1 Agriculture labourRajbanshi 4 5(UL) 20 (ML) 6 Agriculture LabourRajbanshi 6 5(UL) 25 (ML) 4 postmanRajbanshi 5 15(UL) 95 (ML) 12Rajbanshi 6 5(UL) 45(ML) 10 postmanLL= low land, ML= Medium land; UL= Up land102
Table 12: Data on crops grown by a sample <strong>of</strong> 6 months food secure farmers Tharu Pur<strong>in</strong>avillage (Kapilvastu)Farmers Size <strong>of</strong> land(ShareCropp<strong>in</strong>g)FamilysizeType <strong>of</strong>landVarieties grown1 12K 4 upland O.Ro (<strong>in</strong>itially), SarjhuRadha, Mayur(<strong>in</strong>creas<strong>in</strong>gly)Lentils 8k & mustard 4K(after <strong>rice</strong>)Stopped Mung beansbecause lack <strong>of</strong> irrigationSpr<strong>in</strong>g season fallow2 9K (but hasgiven forshare<strong>cropp<strong>in</strong>g</strong>)2 medium3 4 (10) 3 Upland Sarju (<strong>in</strong>creas<strong>in</strong>gly),GautamMustard and L<strong>in</strong>seed 4 Keach6k FallowSpr<strong>in</strong>g season Fallow4 10 9 Upland All O.R.Lentils (1K), mustard(2K) rest fallowSpr<strong>in</strong>g season Fallow5 20 12 Upland 4KMedium14KSarju 52 (20K)L<strong>in</strong>seeds (1K), wheat(2K), chick pea (1K),potatoes (1/2K), peas(2K), lentils (3K), fallowSpr<strong>in</strong>g season, fallowMigrationHusband <strong>in</strong>Indian ArmyLocalLabourLocal labourLocal labour1-2months/year103
Table 13: data <strong>of</strong> variety grown by a sample <strong>of</strong> food sufficient Tharu group <strong>in</strong> Pur<strong>in</strong>a village(Kapilvastu)Farmers Size <strong>of</strong>landFamilysizeType <strong>of</strong>landVarieties grown (source)1 36 K (40) 13 medium Malla (30K), Radha (15K),O.R. restMustard + lentils (10K),wheat (8K), l<strong>in</strong>seed (6K),kheshari (8K), Potato +vegetables (2K)Spr<strong>in</strong>g season <strong>in</strong>itially mungbeans (a) but no more2 57K 13 medium Gorakhnath (23K) Barkhe2001 (Forward), Sawa(Agrovet), BajigarChickpea (1K), mustardLentils (20K), Lathyrus(10K)Spr<strong>in</strong>g season sun flower(1K)3 36 K 6 medium Barkhe 2001 (Forward), restsawaChickpea (4K), mustardLentils (15K), Lathyrus (1K).Vegetables (2K), wheat.After wheat total fallow4 37 K 8 medium Gorakhnath (5K), Mayur(5K), Sawa (5K), ChotaMota (22K)Mustard, Lentils (5K), purelentils (2K), Lathyrus (2K).Vegetables (2K), wheat (4K)Spr<strong>in</strong>g season fallow.Migration1 son <strong>in</strong>India yearly2 jobholderslocally1 son IndiaNo5 36 K(4) 8 medium Gorakhnath (5K) Sawa (12).Barkhe 2001(4K), Radha(10K), Mala (1K),Mustard, Lentils (2 1/2K),pure lentils (2K), Lathyrus (21/2K), L<strong>in</strong>seed 11KVegetables (2K), wheat(7K), coriander, (1/2K),chick pea (1K), large pea(1K) spr<strong>in</strong>g season fallow1 son India6 57 9 medium Loknat, O.R., Radha,Mustard(4K), Lentils (4K),Lathyrus (2 K), L<strong>in</strong>seed 11KVegetables (2K), wheat(7K),104
Ra<strong>in</strong>y season:Autumn:w<strong>in</strong>ter:spr<strong>in</strong>g:June- AugustSept-NovDec-FebMar-Mayand which <strong>of</strong> these seasons is considered the dry season? Mar-MayGender/caste/ethnicityKamal Biswakarma:Sete Sunar:Bal Bahadur Sunar:Gopal Sunar:Hom Bahadur Bhandari:Ramesh Khadka:M/dalitMale/dalitMale/dalitMale/dalitM/Chhetri (2nd rank <strong>in</strong> high caste)M/chhetri (2nd rank <strong>in</strong> high caste)105