ANNUAL REPORT INTRUM JUSTITIA A N N U A L R EP O R T 2 0 ...
ANNUAL REPORT INTRUM JUSTITIA A N N U A L R EP O R T 2 0 ...
ANNUAL REPORT INTRUM JUSTITIA A N N U A L R EP O R T 2 0 ...

You also want an ePaper? Increase the reach of your titles
YUMPU automatically turns print PDFs into web optimized ePapers that Google loves.
32 The share<br />
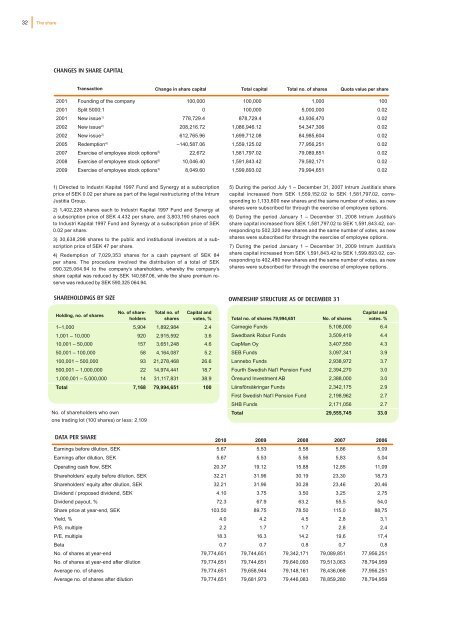
CHANGES IN SHARE CAPITAL<br />
Transaction<br />
2001 Founding of the company 100,000 100,000 1,000 100<br />
2001 Split 5000:1 0 100,000 5,000,000 0.02<br />
2001 New issue 1) 778,729.4 878,729.4 43,936,470 0.02<br />
2002 New issue 2) 208,216.72 1,086,946.12 54,347,306 0.02<br />
2002 New issue 3) 612,765.96 1,699,712.08 84,985,604 0.02<br />
2005 Redemption 4) –140,587.06 1,559,125.02 77,956,251 0.02<br />
2007 Exercise of employee stock options 5) 22,672 1,581,797.02 79,089,851 0.02<br />
2008 Exercise of employee stock options 6) 10,046.40 1,591,843.42 79,592,171 0.02<br />
2009 Exercise of employee stock options 7) 8,049.60 1,599,893.02 79,994,651 0.02<br />
1) Directed to Industri Kapital 1997 Fund and Synergy at a subscription<br />
price of SEK 0.02 per share as part of the legal restructuring of the Intrum<br />
Justitia Group.<br />
2) 1,402,228 shares each to Industri Kapital 1997 Fund and Synergy at<br />
a subscription price of SEK 4.432 per share, and 3,803,190 shares each<br />
to Industri Kapital 1997 Fund and Synergy at a subscription price of SEK<br />
0.02 per share.<br />
3) 30,638,298 shares to the public and institutional investors at a subscription<br />
price of SEK 47 per share.<br />
4) Redemption of 7,029,353 shares for a cash payment of SEK 84<br />
per share. The procedure involved the distribution of a total of SEK<br />
590,325,064.94 to the company’s shareholders, whereby the company’s<br />
share capital was reduced by SEK 140,587.06, while the share premium reserve<br />
was reduced by SEK 590,325 064.94.<br />
SHAREHOLDINGS BY SIZE<br />
Holding, no. of shares<br />
No. of shareholders<br />
Total no. of<br />
shares<br />
Capital and<br />
votes, %<br />
1–1,000 5,904 1,892,984 2.4<br />
1,001 – 10,000 920 2,915,592 3.6<br />
10,001 – 50,000 157 3,651,248 4.6<br />
50,001 – 100,000 58 4,164,087 5.2<br />
100,001 – 500,000 93 21,278,468 26.6<br />
500,001 – 1,000,000 22 14,974,441 18.7<br />
1,000,001 – 5,000,000 14 31,117,831 38.9<br />
Total 7,168 79,994,651 100<br />
No. of shareholders who own<br />
one trading lot (100 shares) or less: 2,109<br />
Change in share capital Total capital Total no. of shares Quota value per share<br />
5) During the period July 1 – December 31, 2007 Intrum Justitia’s share<br />
capital increased from SEK 1,559,152.02 to SEK 1,581,797.02, corresponding<br />
to 1,133,600 new shares and the same number of votes, as new<br />
shares were subscribed for through the exercise of employee options.<br />
6) During the period January 1 – December 31, 2008 Intrum Justitia’s<br />
share capital increased from SEK 1,581,797.02 to SEK 1,591,843.42, corresponding<br />
to 502,320 new shares and the same number of votes, as new<br />
shares were subscribed for through the exercise of employee options.<br />
7) During the period January 1 – December 31, 2009 Intrum Justitia’s<br />
share capital increased from SEK 1,591,843.42 to SEK 1,599.893.02, corresponding<br />
to 402,480 new shares and the same number of votes, as new<br />
shares were subscribed for through the exercise of employee options.<br />
OWNERSHIP STRUCTURE AS Of DECEMBER 31<br />
Total no. of shares 79,994,651 No. of shares<br />
Capital and<br />
votes. %<br />
Carnegie Funds 5,108,000 6.4<br />
Swedbank Robur Funds 3,509,419 4.4<br />
CapMan Oy 3,407,550 4.3<br />
SEB Funds 3,097,341 3.9<br />
Lannebo Funds 2,938,972 3.7<br />
Fourth Swedish Nat’l Pension Fund 2,394,270 3.0<br />
Öresund Investment AB 2,388,000 3.0<br />
Länsförsäkringar Funds 2,342,175 2.9<br />
First Swedish Nat’l Pension Fund 2,198,962 2.7<br />
SHB Funds 2,171,056 2.7<br />
Total 29,555,745 33.0<br />
DATA PER SHARE<br />
2010 2009 2008 2007 2006<br />
Earnings before dilution, SEK 5.67 5.53 5.58 5,86 5,09<br />
Earnings after dilution, SEK 5.67 5.53 5.56 5,83 5,04<br />
Operating cash flow, SEK 20.37 19.12 15.88 12,85 11,09<br />
Shareholders’ equity before dilution, SEK 32.21 31.96 30.19 23,30 18,73<br />
Shareholders’ equity after dilution, SEK 32.21 31.96 30.28 23,46 20,46<br />
Dividend / proposed dividend, SEK 4.10 3.75 3.50 3,25 2,75<br />
Dividend payout, % 72.3 67.9 63.2 55,5 54,0<br />
Share price at year-end, SEK 103.50 89.75 78.50 115,0 88,75<br />
Yield, % 4.0 4.2 4.5 2,8 3,1<br />
P/S, multiple 2.2 1.7 1.7 2,8 2,4<br />
P/E, multiple 18.3 16.3 14.2 19,6 17,4<br />
Beta 0.7 0.7 0.8 0,7 0,8<br />
No. of shares at year-end 79,774,651 79,744,651 79,342,171 79,089,851 77,956,251<br />
No. of shares at year-end after dilution 79,774,651 79,744,651 79,640,093 79,513,063 78,794,959<br />
Average no. of shares 79,774,651 79,658,944 79,148,161 78,436,068 77,956,251<br />
Average no. of shares after dilution 79,774,651 79,681,973 79,446,083 78,859,280 78,794,959