ANNUAL REPORT INTRUM JUSTITIA A N N U A L R EP O R T 2 0 ...
ANNUAL REPORT INTRUM JUSTITIA A N N U A L R EP O R T 2 0 ...
ANNUAL REPORT INTRUM JUSTITIA A N N U A L R EP O R T 2 0 ...

You also want an ePaper? Increase the reach of your titles
YUMPU automatically turns print PDFs into web optimized ePapers that Google loves.
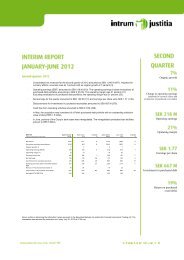
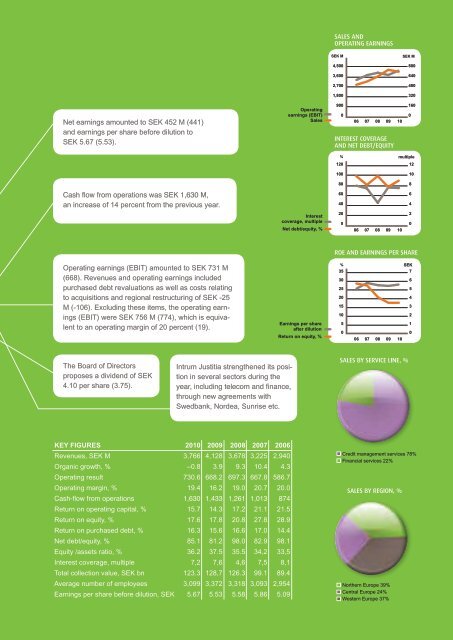
Net earnings amounted to SEK 452 M (441)<br />
and earnings per share before dilution to<br />
SEK 5.67 (5.53).<br />
Cash flow from operations was SEK 1,630 M,<br />
an increase of 14 percent from the previous year.<br />
Operating earnings (EBIT) amounted to SEK 731 M<br />
(668). Revenues and operating earnings included<br />
purchased debt revaluations as well as costs relating<br />
to acquisitions and regional restructuring of SEK -25<br />
M (-106). Excluding these items, the operating earnings<br />
(EBIT) were SEK 756 M (774), which is equivalent<br />
to an operating margin of 20 percent (19).<br />
The Board of Directors<br />
proposes a dividend of SEK<br />
4.10 per share (3.75).<br />
Intrum Justitia strengthened its position<br />
in several sectors during the<br />
year, including telecom and finance,<br />
through new agreements with<br />
Swedbank, Nordea, Sunrise etc.<br />
KEY FIGURES 2010 2009 2008 2007 2006<br />
Revenues, SEK M 3,766 4,128 3,678 3,225 2,940<br />
Organic growth, % –0.8 3.9 9.3 10.4 4.3<br />
Operating result 730.6 668.2 697.3 667.8 586.7<br />
Operating margin, % 19.4 16.2 19.0 20.7 20.0<br />
Cash-flow from operations 1,630 1,433 1,261 1,013 874<br />
Return on operating capital, % 15.7 14.3 17.2 21.1 21.5<br />
Return on equity, % 17.6 17.8 20.8 27.8 28.9<br />
Return on purchased debt, % 16.3 15.6 16.6 17.0 14.4<br />
Net debt/equity, % 85.1 81.2 98.0 82.9 98.1<br />
Equity /assets ratio, % 36.2 37.5 35.5 34,2 33,5<br />
Interest coverage, multiple 7,2 7,6 4,6 7,5 8,1<br />
Total collection value, SEK bn 123.3 128,7 126.3 99.1 89.4<br />
Average number of employees 3,099 3,372 3,318 3,093 2,954<br />
Earnings per share before dilution, SEK 5.67 5.53 5.58 5.86 5.09<br />
Operating<br />
earnings (EBIT)<br />
Sales<br />
Interest<br />
coverage, multiple<br />
Net debt/equity, %<br />
Earnings per share<br />
after dilution<br />
Return on equity, %<br />
SALES AND<br />
OPERATING EARNINGS<br />
SEK M<br />
4,500<br />
3,600<br />
2,700<br />
1,800<br />
900<br />
0<br />
namn på kapitel här<br />
06 07 08 09 10<br />
INTEREST COVERAGE<br />
AND NET DEBT/EQUITY<br />
%<br />
120<br />
100<br />
80<br />
60<br />
40<br />
20<br />
0<br />
ROE AND EARNINGS PER SHARE<br />
%<br />
35<br />
30<br />
25<br />
20<br />
15<br />
10<br />
5<br />
0<br />
06 07 08 09 10<br />
SALES BY SERVICE LINE, %<br />
Credit management services 78%<br />
Financial services 22%<br />
SALES BY REGION, %<br />
Northern Europe 39%<br />
Central Europe 24%<br />
Western Europe 37%<br />
SEK M<br />
800<br />
640<br />
480<br />
320<br />
160<br />
SEK<br />
7<br />
6<br />
5<br />
4<br />
3<br />
2<br />
1<br />
0<br />
06 07 08 09 10<br />
0<br />
multiple<br />
12<br />
10<br />
8<br />
6<br />
4<br />
2<br />
0<br />
3