demersal fish resources in malaysian waters-6 - Seafdec
demersal fish resources in malaysian waters-6 - Seafdec
demersal fish resources in malaysian waters-6 - Seafdec

You also want an ePaper? Increase the reach of your titles
YUMPU automatically turns print PDFs into web optimized ePapers that Google loves.
DEMERSAL FISH RESOURCES INMALAYSIAN WATERS-6First Trawl Survey off the Coasts of Sarawak, Brunei andthe West Coast of Sabah,(29th March, 197,2-lst May, 1972) .Mohammed Shaari b<strong>in</strong> Sam Abdul Latif!, W. Weber,Lee Aik Kean and Lam Wah Chang(Fisheries Division)MINISTRY OF AGRICULTURE AND RURAL DEVELOPMENTMALAYSIA
DEMERSAL FISH RESOURCES INMALAYSIAN WATERS-6First Trawl Survey off the Coasts of Sarawak, Brunei andthe West Coast of SabahMohammed Shaari b<strong>in</strong> Sam Abdul Latiff, W. Weber,Lee Aik Kean and Lam Wah Chang(Fisheries Division)1976MINISTRY OF AGRICULTURE AND RURAL DEVELOPMENTMALAYSIA
3.3 Test<strong>in</strong>g the catCh power of the research vessels "Penyelidik I" and"Penyelidik II" ... 33.10 Estimation of the annual land<strong>in</strong>g by a 30 ton trawler and thenumber that may operate <strong>in</strong> each sub-area ... 10
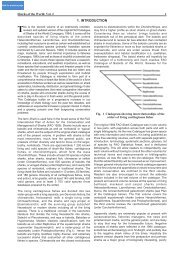
Figure 1The division of the survey region <strong>in</strong> Sarawak, Brunei and the westcoast of Sabah <strong>in</strong>to sub-areas I-VI... 50Figure 2 Fish<strong>in</strong>g stations and trawl<strong>in</strong>g directions for Research Vessels"Penyelidik I" and "Penyelidik II" '" 51-55Figure 3Average catch rates of the comb<strong>in</strong>ed groups of commercial andtrash <strong>fish</strong>, accord<strong>in</strong>g to sub-areas 56Figure 5Figure 6Average catch rates of the comb<strong>in</strong>ed groups of commercial andtrash, accord<strong>in</strong>g to depth zones 58Average catch rates of commercial and trash <strong>fish</strong>, accord<strong>in</strong>g todepth zones 59Table 3 Average catch rates, accord<strong>in</strong>g to sub-areas, irrespective of"Penyelidik I" or "Penyelidik II" (kg/hr) ... 45Table 4.Percentage catch by weight, accord<strong>in</strong>g to sub-areas, irrespective of"Penyelidik I" or "Penyelidik II" 46Table 5 Average catch rates, accord<strong>in</strong>g to depth zones, irrespective of"Penyelidik I" or "Penyelidik II" (kg/hr) ... 47Table 6Table 7Percentage catch by weight, accord<strong>in</strong>g to depth zones, irrespectiveof "Penyelidik I" or "Penyelidik II" ... 48Calculated catchable <strong>fish</strong> resource <strong>in</strong> trawlable grounds for eachsub-area. C + T = Average catch rate of commercial and trash<strong>fish</strong> comb<strong>in</strong>ed. C = Average catch rate of commercial <strong>fish</strong> only... 49.1
The data obta<strong>in</strong>ed from the 292 successful one hour hauls are analysed and usedstraight away without any necessity to convert the catch figures from one vessel to theother as the difference <strong>in</strong> the <strong>fish</strong><strong>in</strong>g power between them has been found to be <strong>in</strong>significant.The grounds <strong>in</strong> Sarawak / Sabah <strong>waters</strong> appear to be very rich <strong>in</strong> <strong>demersal</strong> <strong>fish</strong>resource, the overall average catch rate be<strong>in</strong>g 318 kg/hr. Of this, 183 kg werecommercial <strong>fish</strong>. If Sarawak plus Brunei and Sabah were to be treated separately, itis found that the former produced an average catch rate of 150-250 kg/hr while thelatter <strong>in</strong>dicated a catch of 450-550 kg/hr. The relatively lower catch rate <strong>in</strong> Sarawakis compensated by the fact that the catch comprised quality <strong>fish</strong>es such as the redsnappers and the silver grunters which appeared <strong>in</strong> large number and quantities <strong>in</strong>several areas. Sabah, though also rich <strong>in</strong> quality <strong>fish</strong>es, was relatively poor <strong>in</strong> redsnappers. Despite this, the whole of the Marudu Bay <strong>in</strong> Sabah was found to beexceptionally rich <strong>in</strong> <strong>demersal</strong> <strong>fish</strong> resource, where a record of over 1,000 kg of silvergrunters were caught after one hour trawl<strong>in</strong>g.With<strong>in</strong> the depth limits and areas covered <strong>in</strong> the present survey, it is estimated thatthe <strong>waters</strong> off Sarawak, Brunei and the west coast of Sabah would conta<strong>in</strong> about 159,000m. tons of catchable <strong>demersal</strong> <strong>fish</strong>. Addition of the prawn component and the <strong>demersal</strong><strong>fish</strong> resource <strong>in</strong> shallower water less than 5 nautical miles from the shore would raisethe figure to a probable 190,000 m. tons.The grounds throughout the survey region were generally of mud and sandy mudwith only isolated patches of clay. As such, they are suitable for trawl<strong>in</strong>g, exceptionsbe<strong>in</strong>g the extensive coral beds <strong>in</strong> the deeper <strong>waters</strong> off B<strong>in</strong>tulu/Miri and scattered coralbeds elsewhere. The distributions of productive grounds are such that even <strong>in</strong> Sarawak,the trawlers do not have to go further offshore to harvest the <strong>demersal</strong> <strong>fish</strong> resource.Thirty ton trawlers are, therefore, suggested for <strong>fish</strong><strong>in</strong>g dur<strong>in</strong>g the <strong>in</strong>itial stage of the<strong>in</strong>dustry <strong>in</strong> Sarawak and Sabah.
In the current series of <strong>in</strong>vestigations, five <strong>demersal</strong> <strong>fish</strong>ery resource surveys had alreadybeen carried out <strong>in</strong> Pen<strong>in</strong>sular Malaysia. The present <strong>in</strong>vestigation, therefore, is thesixth <strong>in</strong> the series and the first for Sarawak and Sabah. In order to provide cont<strong>in</strong>uityof the survey region, Brunei was also <strong>in</strong>cluded <strong>in</strong> the programme. The operations there,however, were restricted to grounds outside her territorial <strong>waters</strong>. In Sarawak and Sabah,attention is paid more to mar<strong>in</strong>e prawns and trawl<strong>in</strong>g for <strong>fish</strong> by trawlers <strong>in</strong> thesetwo states is almost non-existent. The <strong>demersal</strong> <strong>fish</strong>ery resource is, therefore, not be<strong>in</strong>gfully utilized. As such, it is believed that the results of this survey might <strong>in</strong>dicategrounds which prove to be far richer <strong>in</strong> <strong>demersal</strong> <strong>fish</strong> than those exist<strong>in</strong>g <strong>in</strong> Pen<strong>in</strong>sularMalaysia. Opportunities would then be opened for the local <strong>fish</strong>ermen to extend theirpresent activities to <strong>in</strong>clude full utilization of this resource.In the present survey, two research stern trawlers were simultaneously deployed. Theywere "Penyelidik I" and "Penyelidik II" s<strong>in</strong>ce renamed "K.K. Jenahak" and "K.K.Merah" respectively. Each of these wooden vessels with an overall length of 23 metresand a displacement of 85 gross tons was equipped with radar, radiotelephone, echosounderand other equipments associated with the work. "Penyelidik I" was poweredby a 325 BHP "M.W.M." diesel eng<strong>in</strong>e while "Penyelidik II" was driven by a 365 BHP"Caterpillar" diesel eng<strong>in</strong>e. The <strong>fish</strong><strong>in</strong>g gear used was the standard type German ottertrawl designed after Engel with a cod-end mesh size of 40 mm, adapted to catchonly <strong>fish</strong>.It was planned that the survey would last for five weeks at 60 one-hour hauls perweek. In order to cover all the 300 <strong>fish</strong><strong>in</strong>g stations located <strong>in</strong> water rang<strong>in</strong>g from 10metres to over 60 metres deep with<strong>in</strong> this limited period, the two vessels had to besimultaneously used. A vessel would carry out 5 day <strong>fish</strong><strong>in</strong>g per week, cover<strong>in</strong>g 6stations per day before return<strong>in</strong>g to port for replenishment and sale of <strong>fish</strong>. The portsselected were Kuch<strong>in</strong>g, Mukah, Miri and Kota K<strong>in</strong>abalu.At the beg<strong>in</strong>n<strong>in</strong>g of each station, sea bed samples were collected by means of VanVeen grab equipped on board "Penyelidik I". In the absence of this <strong>in</strong>strument <strong>in</strong>"Penyelidik II", the samples were taken from the shoe of the otterboard at the end ofeach haul.In each haul, the trash <strong>fish</strong> were separated from the commercial <strong>fish</strong> and weighed <strong>in</strong>kilogramIIle. As far as possible, the commercial <strong>fish</strong> were sorted accord<strong>in</strong>g to speciesor genera. In hauls where the catch was exceptionally large, the big specimens weresorted out. The rest, compris<strong>in</strong>g large quantities of the smaller species of commercial<strong>fish</strong> and trash <strong>fish</strong> were thrown overboard basket by basket after first weigh<strong>in</strong>g arandom sample <strong>in</strong> a basket. From the random samples put aside, the constituentcatches of the various groups thrown overboard were calculated and added to the catchfor that particular haul.
The survey began on the 29th of March off Kuch<strong>in</strong>g <strong>in</strong> Sarawak and ended on the1st of May, 1972 at the entrance to Marudu Bay <strong>in</strong> Sabah. Throughout the five-weekperiod, <strong>fish</strong><strong>in</strong>g was carried out only dur<strong>in</strong>g the day, generally dur<strong>in</strong>g the period 6.00 a.m.-6.00 p.m. In order to reduce the burden of subsequent data process<strong>in</strong>g and to facilitatequick comparison on board between catches of various hauls, trawl<strong>in</strong>g duration perstation was restricted to one hour. While trawl<strong>in</strong>g, the speed of both the vessels wasma<strong>in</strong>ta<strong>in</strong>ed at 2.8 knots. The <strong>fish</strong><strong>in</strong>g stations were <strong>in</strong>tended to cover <strong>waters</strong> 5 to about60 nautical miles offshore.3.1 Number of hauls madeThe total number of <strong>fish</strong><strong>in</strong>g days was 27 for "Penyelidik I" and 26 for "Penyelidik n".Dur<strong>in</strong>g the survey period, both the vessels carried out a total of 300 hauls as planned.The distributions of the hauls were 71, 58, 52, 25. 33 and 61 <strong>in</strong> sub-area I. n, In, IV,V and VI respectively. The division of the whole survey region <strong>in</strong>to sub-areas is<strong>in</strong>dicated by Fig. 1. Of all the hauls made, only 8 were regarded as unsuccessful andthese were ma<strong>in</strong>ly due to the bottom characteristic of the sea bed.3.2 Locations of unsuccessful haulsThe first unsuccessful haul occurred <strong>in</strong> sub-area I at station 10 designated for"Penyelidik II" (Fig. 2). In this case, the portside w<strong>in</strong>g of the trawl net was ripped offand the associated ropes snapped. This was probably because of the presence of ridgesand troughs <strong>in</strong> the area generally bounded by the 30-40 metre depth zone. The troughswere very deep and a sudden drop of over 50 metres often occurred, as evidenced bythe echogram. Both the vessels had to spend a lot of time travell<strong>in</strong>g to avoid suchgrounds. Some of the troughs, however, were not only extensive spatially but also flatbottomed. As such, trawl<strong>in</strong>g was possible there.The second unsuccessful haul occurred <strong>in</strong> sub-area II at station 42, also designatedfor "Penyelidik n". The damage here was more severe and half the net was ripped off.Although the otterboard <strong>in</strong>dicated sea bed with sandy mud, the likely cause was someobstruction such as a sunken boat which also resulted <strong>in</strong> the wire rope be<strong>in</strong>g snapped.The third unsuccessful haul happened <strong>in</strong> sub-area III at station 73 designated for"Penyelidik I". In this case, the belly of the trawl net was badly tom off and no <strong>fish</strong>were caught. The otterboards were also lacerated. The chart shows that the ground was<strong>in</strong> the vic<strong>in</strong>ity of marked coral beds. Corals were encountered only once becauseattempts were made to avoid such areas.The fourth and the fifth unsuccessful hauls were experienced very close <strong>in</strong>shore atstation 84 and 85 <strong>in</strong> sub-area III trawled by "Penyelidik II". In each case, the trawlnet had to be hauled up after less than half an hour. The damage to the gear was dueto the presence of old derricks off Miri. The otterboards. however, <strong>in</strong>dicated sea bedwith mud.
The sixth unsuccessful haul was at station 102 <strong>in</strong> sub-area IV off west of Labuan.This was due to the slipp<strong>in</strong>g of the rudder cha<strong>in</strong> of "Penyelidik I" and not the typeof sea bed encountered <strong>in</strong> other aborted hauls.The seventh and the eighth unsuccessful hauls were experienced by "Penyelidik II"at stations 104 and 144 <strong>in</strong> sub-areas V and VI respectively. At station 104, off northeastof Labuan, the net had to be hauled up after ten m<strong>in</strong>utes when the w<strong>in</strong>ch <strong>in</strong>dicatedsome obstruction on the sea bed. The net, however, was not damaged. The clay depositedon the shoe of the otterboard revealed bed of clay as the probable cause. At station 144<strong>in</strong> Marudu Bay, the net had to be hauled up immediately. On haul<strong>in</strong>g up, it was foundto be badly torn, the likely cause of the damage could either be due to rocks, corals orsome obstruction such as a sunken boat.3.3 Test<strong>in</strong>g the catch power of the research vessels "Penyelidik I" and "Penyelidik II"For the catch data from the survey to be used straightaway without any conversionof the figures from one vessel to the other, the difference <strong>in</strong> the catch power betweenthem has to be proved <strong>in</strong>significant. This was tested by comparison of the' two seriesof hauls ("t" test) and confidence limit of average. For this purpose, appropriate <strong>fish</strong>stations <strong>in</strong> sub-areas IV, V and VI <strong>in</strong>dicated by Fig. 2 were selected. The stations areas follow:Stations 97-101, 103, 106-107, 109-110, 112-118, 121-129, 131, 133-135, 138-141and 150.The choice of the above 35 stations was made on the basis that the two vessels were<strong>fish</strong><strong>in</strong>g simultaneously <strong>in</strong> the same general directions at a distance of a few miles apartat each station. Tables 1 and 2 show the catch by each vessel at each selected <strong>fish</strong>station dur<strong>in</strong>g the period 24th April 1972 to 1st May, 1972. The depths trawled rangedfrom 30 metres to 50 metres. Figures from these two tables gave 547.11 kg/hr as theaverage catch rate for "Penyelidik I" and 500.92 kg/hr as the catch rate for "Penyelidik:II". The total catch for each vessel was 19,149.0 kg and 17,532.1 kg respectively.3.3.1 Comparison of the 2 series of hauls ("t" test)For "Penyelidik: I"Su=ation of square of deviation L(x-X)2=D2_(Lx)2Degrees of freedom n -1 = 34= 187.52+ 788.42 -(19,149.0)235= 8,694,725.5Variance = Su=ation of square of deviation = 8,694,725.5degrees of freedom 34Variance of mean = variance-n--= 255,727.035= 7,306.4= 255,727.0Standard error S.B. = VVariance of mean = ± 85.48
For "Penyelidik II"Summation of square of deviation I;(x-x)2 = D2-(I;x)2Degrees of freedom n -1 = 34n281.02 505.92 - (17,532.1)235= 12,562,832.6VarianCe = summation of square of deviation = 12,562,832.6degrees of freedom 34Variance of mean = variance = 369,495.0--n- 35= 10,557.0Standard Error S.E. = Vvariance of mean = ± 102.8Difference between the means from the two vessels = 547.1-500.9= 46.2S.E. of difference between the means"t"= Difference between the meansS.E. of difference between the meansFrom "t" table,"t" for 60 degrees of freedom (p = 0.01) = 2.660"t" for 80 degrees of freedom (p = 0.01) = 2.639= The square root of sum of the variance of the meansV7,306:4 + 10,557.0± 133.6= 46.2133.60.35 with 68 degrees of freedomBut calculated "t" with 68 degrees of freedom = 0.35. If calculated "t" > tabulated"t", the difference is significant. In the present case, however, calculated "t" < tabulated"t". Therefore, the difference <strong>in</strong> the catch power between the two vessels is notsignificant.3.3.2 Confidence limit of average test(a) For "Penyelidik I"vil505.7 = ± 85.48V3595 %= confidence limit of average = M ± 2 SE= 547.11 ± 170.96But the average catch rate for "Penyelidik II" is 500.92 kgfhrthis range.which falls with<strong>in</strong>
S.D for all the hauls = ± 607.9S.E of the average ± 102.7695 % confidence limit of average = M ± 2SE= 500.92 ± 205.52But the average catch rate for "Penyelidik I" is 547.11 kg/hrthis range.which also falls with<strong>in</strong>Hence, the difference <strong>in</strong> the catch power between the two vessels is <strong>in</strong>significantdespite some difference <strong>in</strong> the horse power of. the ma<strong>in</strong> eng<strong>in</strong>es. This is to be· expectedas the trawl nets used were identical and the trawl<strong>in</strong>g speed ·ma<strong>in</strong>ta<strong>in</strong>ed throughoutat 2.8 knots.3.4 Overall average catch rateAs the difference <strong>in</strong> the <strong>fish</strong><strong>in</strong>g power between "Penyelidik I" and "Penyelidik II"has been proved to be <strong>in</strong>significant, the catch data from all the hauls by the two vesselscan be used straightaway without any necessity to convert the figures from one vessel tothe other. Irrespective of sub-areas and depths, the overall average catch rate from atotal of 292 successful hauls was 318 kg/hr (Table 3). Of this, catch of commercial<strong>fish</strong> was 183 kg. constitut<strong>in</strong>g almost 58% of the total catch by weight. The overallcatch <strong>in</strong> the present survey was superceeded only by that of the first survey on theeast coast of Pen<strong>in</strong>sular Malaysia (Pathansali et ai, 1974) where 515 kg was recorded.But commercial <strong>fish</strong> there constituted only 36% of the total catch or 185 kg.3.5 Average catch rates by sub-areas and depthsTable 3 shows that of all the six sub-areas, sub-areas V and VI <strong>in</strong> Sabah gave thehighest figures for all the <strong>fish</strong> groups comb<strong>in</strong>ed together at 476.54 kg/hr and 546.73 kg/hrrespectively. These are much higher than the 318.19 kg obta<strong>in</strong>ed for the whole surveyregion. Those from sub-areas II-IV off Sarawak were about 260-270 kg while thatrecorded for sub-area I was only around 150 kg. The average catch rates are alsodemonstrated graphically by Fig. 3.Consider<strong>in</strong>g only the commercial <strong>fish</strong>. sub~areas V and VI still <strong>in</strong>dicate the bestfigures for the catch rates. Despite the lowest average for the comb<strong>in</strong>ed <strong>fish</strong> groups<strong>in</strong> sub-area I, however, commercial <strong>fish</strong> catch contribution was not very much lowerthan those from sub-areas II-VI. This was due to the fact that the proportion of trash<strong>fish</strong> landed was relatively small constitut<strong>in</strong>g only 22% by weight of the total catchunlike <strong>in</strong> other sub-areas where trash <strong>fish</strong> representation was 40-50% (Fig. 4 andTable 4).Irrespective of sub-areas, the highest average catch rate for all the <strong>fish</strong> groupscomb<strong>in</strong>ed was obta<strong>in</strong>ed from water 10-20 metres deep where the figure was 467.68 kg/hr.As shown by Table 5 and graphically by Fig. 5 and Fig. 6, there was a progressive
decrease <strong>in</strong> <strong>fish</strong> quantities as deeper depth zones were trawled. This was true not onlyfor commercial <strong>fish</strong> but also for trash <strong>fish</strong>. In water over 60 metres deep, the averagecatch rate per hour was reduced to only about 100 kg. Although the depth zone 10-20metres gave the highest average catch rate, the bIggest haul ever recorded dur<strong>in</strong>g thesurvey period was from water 31-40 metres deep <strong>in</strong> sub-area VI (Tables 3 and 5) wherean hour trawl<strong>in</strong>g resulted <strong>in</strong> a catch of 3,016 kg C'f<strong>fish</strong> of all types. One of the smallesthauls recorded was <strong>in</strong> water 21-30 metres deep <strong>in</strong> sub-area I where the catch totalledonly 11 kg.3.6 Catch composition of commercial <strong>fish</strong>As <strong>in</strong> other papers (pathansali et al, 1974, Mohammed Shaari b<strong>in</strong> Sam Abdul Latiffet al, 1974) trash <strong>fish</strong> <strong>in</strong>clude those commercial species which had not atta<strong>in</strong>edmarketable size, one species of Pomadasys, that is, P. argyreus, Priac.anth~ spp., allspecies of Leiognathidae except Leiogoothus equulus and all <strong>in</strong>edible <strong>fish</strong> such aslagocephalids. The same system of group<strong>in</strong>g the trash <strong>fish</strong> was also ma<strong>in</strong>ta<strong>in</strong>edthroughout the present survey where, out of the 292 successful hauls, they contributed42 % of the total catch by weight. The rema<strong>in</strong><strong>in</strong>g 58% comprised commercial <strong>fish</strong> ofvarious types.Of the 58%, about 1/5 was represented by the family Mullidae and this was almost11% of the total catch for the whole region. As shown by Table 3, the mullids wereabundant <strong>in</strong> all sub-areas, especially <strong>in</strong> sub-areas II and V where the average catchrates per hour were 49 kg and 64 kg respectively. Percentage contributions for theserespective sub-areas were 18% and 13% (Table 4). Depthwise, 31-40 metre gave thehighest average catch rate with a figure almost reach<strong>in</strong>g 60 kg/hr, the mullids from thisdepth zone constitut<strong>in</strong>g 17% by weight of the total <strong>fish</strong> catch there. A catch of 1,701 kgof Mullidae from Haul 47 <strong>in</strong> sub-area II (Table 1) and 725 kg of the same group fromHaul 110 <strong>in</strong> sub-area V (Table 2) did much to raise the average catch rate figure notonly for the depth zone 31-40 metres but also for either of the two sub-areas.Next <strong>in</strong> abundance were <strong>fish</strong> belong<strong>in</strong>g to the families Nemipteridae and Carangidae,each group contribut<strong>in</strong>g about 5% of the total catch by weight. The average catch rateof nemipterids was about 30 kg/hr <strong>in</strong> sub-area VI, 20 kg <strong>in</strong> sub-areas III, IV and Vbut only 5 kg <strong>in</strong> sub-areas I and II (Table 3). Although this group was present <strong>in</strong> alldepth zones. it appeared to be most abundant <strong>in</strong> water 30-60 metres deep where theaverage catch rates fell with<strong>in</strong> the range 16-18 kg/hr. Outside this depth range. thecatch rate was still high at 10 kg/hr. As <strong>in</strong> the case of the nemipterids. the carangidswere also most abundant <strong>in</strong> sub-area VI with an average catch rate of 21 kg/hr. Thiswas followed by sub-areas II, III and V with a catch figure of 16-18 kg. Sub-area IV<strong>in</strong>dicated lowest figure at 7 kg/hr. Tables 3 and 4 show that although sub-area VIproduced the biggest quantities of carangids <strong>in</strong> terms of catch per hour, it was alsopercentage wise one of the sub-areas with a very low carangid catch constituent. Thecarangids here represented less than 4% by weight of all the groups of <strong>fish</strong>. This ishowever, expla<strong>in</strong>ed by the fact that compared to other sub-areas, this was also thesub-area where other groups of commercial <strong>fish</strong> such as Anodontostoma chacunda,
Leiognathidae, Pomadasys spp. and Tachysuridae <strong>in</strong>dicated relatively higher constituentcatches. The carangids <strong>in</strong>dicated a progressive decrease <strong>in</strong> catch with depth, with agood average catch rate of 27-28 kg/hr at 10-30 metres to only about 2 kg <strong>in</strong> waterover 60 metres deep.The tachysurids and the rays were the next two groups of commercial <strong>fish</strong> whichcontributed just under 4 % of the total catch by weight for each group (Table 4). Theaverage catch rate for the tachysurids was 24 kg/hr <strong>in</strong> sub-area V as well as sub-areaVI. In the rest of the sub-areas, the figure was 4-7 kg. Depthwise, they were abundanteverywhere except <strong>in</strong> water deeper than 50 metres where the catch rate was as low as1-2 kg/hr (Table 5). The rays <strong>in</strong>dicated highest average catch figure only <strong>in</strong> sub-area IV.The land<strong>in</strong>g of a few large <strong>in</strong>dividuals raised the figure to 44 kg/hr. In other sub-areas,the catch was modest at 11-13 kg/hr, exception be<strong>in</strong>g sub-area V where the calculatedaverage catch was about 1 kg/hr. The abundance of rays, however, did not <strong>in</strong>dicateany relationship with depth zones.Each of the next seven groups contributed 2-3% by weight of the total catch. Theywere Anodontostoma chacunda, Clupeidae, Leiognathidae, Lutianidae, Pomadarys spp.,Synodontidae and sharks.The only sub-area which gave the highest average catch of Arwdontostoma chacundawas sub-area VI at 36 kg/hr. All other sub-arels produced much less than 1 kg/hr.The very high average catch <strong>in</strong> sub-area VI could be attributed to Hauls 140, 141, 142,143, 145 and 146 where catch/hr of the species by "Penyelidik I" were 158.8, 179.2,427.5, 70.5, 232.2 and 284.5 kg respectively (Fig. 2, Table 1). The high average catchfigure was also due to the catch of the same species by "Penyelidik II" from Hauls 140,141, 142, 143, 145 and 146 where the correspond<strong>in</strong>g figures were 384.1, 114.7, 94.3,66.4, 124.4 and 54.6 kg respectively (Fig. 2, Table 2). All the catches were from water1,S-30 metres deep. Similar depths <strong>in</strong> other sub-areas did not produce this much quantityof the species.As <strong>in</strong> the case of Arwdontostoma chacunda, the clupeids were well represented <strong>in</strong>sub-area VI where the average catch per hour was about 20 kg. Next <strong>in</strong> abundance forthe clupeids was sub-area I with an average figure of 10 kg. The high average figurefor sub-area VI was ma<strong>in</strong>ly due to the catch from Haul 139 by "Penyelidik II" <strong>in</strong> waterabout 40 metres deep where clupied catch alone was 1,003.8 kg out of a total of 3,016.4kg/hr (Fig. 2, Table 2). Factors contribut<strong>in</strong>g towards rais<strong>in</strong>g the average catch figurefor the clupeids <strong>in</strong> sub-area I, however, was due to reasonably good catches <strong>in</strong> severalhauls, the highest be<strong>in</strong>g from Hauls 4 and 28 by "Penyelidik II" <strong>in</strong> water 40-50 metreswhere the catch per hour was 150 kg.The leiognathids were very poor <strong>in</strong> sub-areas I-IV but abundant <strong>in</strong> sub-area VI withan average catch rate of 41 kg/hr, followed by sub-area V with the correspond<strong>in</strong>g figureof 9 kg. The high average catch rate of leiognathids <strong>in</strong> sub-area VI was ma<strong>in</strong>ly due toHauls 139 and 140 by "Penyelidik I" and Hauls 139 and 149 by "Penyelidik II" wherethe figures per hour were 1,102.5, 709.5, 215.1 and 191.7 kg respectively. For sub-areaV, this could be attributed to Hauls 108 and 117 by "Penyelidik I" and Haul 117 by
"Penyelidik II" with catch figures of 139.3, 65.4 and 57.5 kg respectively (Fig.· 2.Tables 1 and 2). The depths where the leiognathids were abundant ranged from 20 to 40metres.The lutianids or the red snappers appeared to be most abundant <strong>in</strong> sub-areas I and IIonly with an average catch of 14 kg/hr. The correspond<strong>in</strong>g figures for sub-areas III andVI were 4 kg. Low average catch of about 1 kg was <strong>in</strong>dicated by sub-areas IV and V.This group represented 10% and 5% of the total catch from sub-areas I and IIrespectively and usually less than 1% <strong>in</strong> the other sub-areas (Table 4). Table 5 showsthat the lutianids were abundant <strong>in</strong> water deeper than 50 metres and to a smaller extent<strong>in</strong> water 30"50 metres deep. Where they were present <strong>in</strong> sub-areas I and II, the catch perhour of lutianids was always 20-40 kg. In several cases, catches of over 50 kg andexceed<strong>in</strong>g 100 kg/hr had also been recorded. Thus <strong>in</strong> Hauls 41 and 42, catch of redsnappers/hr by "Penyelidik I" were 108.5 kg and 121.8 kg respectively. These positionswere 30-40 miles off north of Tanjung Sirik. Closer <strong>in</strong>shore towards Tanjung Sirik about15 miles off it, catches of these snappers by "Penyelidik II" from Hauls 37 and 38 were133.2 and 75.2 kg/hr respectively. Further east about 25 miles off west of B<strong>in</strong>tulu,"Penyelidik II" recorded a catch of 129.9 kg/hr of red snappers from Haul 64. Thesehigh catches from <strong>in</strong>dividual hauls were all from sub-area II (Fig. 2, Tables 1 and 2).Further west <strong>in</strong> sub-area I, 45 miles off north of Kuch<strong>in</strong>g, "Penyelidik II" landed 80.4and 74.7 kg/hr of red snappers from Hauls 20 and 22 respectively.Next group of <strong>fish</strong> which contributed 2-3% by weight of the total catch from thewhole surveyed region were Pomadasys spp. Th~ highest average catch rate/hr was25 kg from sub-area VI, closely followed by 10 kg from sub-area III. The correspond<strong>in</strong>gfigures for sub-areas I and V were 5 kg. Sub-areas II and IV gave the lowest averagecatch rate at only 3 kg/hr. In Hauls where Pomadasys were present, catches of 10-20kg/hr were common. The high average catch rate of 25 kg from sub-area VI, however,was almost entirely due to a s<strong>in</strong>gle haul of 1,144.8 kg of this group recorded by"Penyelidik I". This occurred <strong>in</strong> Haul 139 where the total <strong>fish</strong> quantities caught were2,721.7 kg/hr. The position of the haul was at the entrance to Marudu Bay (Fig. 1 and 2,Table 1). High average catch figure of Pomadas.vs <strong>in</strong> sub-area III were due to Hauls78, 79 apd 80 with catch/hr of 111.4, 106.4 and 142.4 kg respectively of the genus by"}>enyelidik 1". The three hauls were carried out 18-30 miles off west of Miri (Fig. 2,Table 1). The two species encountered were Pomodasys hasta and P. maculatys, theformer be<strong>in</strong>g more common.As <strong>in</strong> the case of Anodontostoma chacunda, Chirocentrus dorab, the c1upeids, leiognathids,Nemipterus and Pomadasys, the family Synodontidae was found to be mostabundant <strong>in</strong> sub-area VI with an average catch rate of about 20 kg/hr. Depthwise.average catch of 10-13 kg/hr was found only <strong>in</strong> water 31-50 metres. Table 5 shows thatbeyond this depth range, the figure Was much less than 10 kg. Three species wereobserved. They were Saurida. tumbil, S. ul1dosquamis and Trachirwcephalus myops, 'thefirs~be~g the commonesca;nd mOstabJlndantspecies. Synodontids were present <strong>in</strong>almost.all the. hauls and a~.catch :ofZO-5.0kg/ht was coiIlbion ill':sub-area VI. thusrais41g:tlJ.e. ~ye:r~ge1;igm:e:.a~ove.:tho:sefQtthe. other sub~area&: :,... !:... -.
The 7th group which contributed 2-3% of the total catch by weight' feft the wholesurveyed region were the sharks. They were generally of small species. Sub-area Vgave the highest average catch rate of 13 kg/hr, followed by sub-area II with a figureof 10 kg. Elsewhere, the average catch rate was around 5 kg/hr.All other species/ groups of <strong>fish</strong> which represented less than 2% of the total catchby weight are <strong>in</strong>dicated by Table 4.3.7 Locations of productive groundsFig. 7 <strong>in</strong>dicates catches from <strong>in</strong>dividual successful hauls given by Tables 1 and 2.For the purpose of identify<strong>in</strong>g the productive grounds, those hauls with a catch of over200 kg/hr are delimited. It is seen that <strong>in</strong> sub-areas I, II and IV, such grounds areseperated by relatively vast stretches of less productive zones. In sub-areas III, V and VI,poor grounds constitute only m<strong>in</strong>or sections of the region surveyed.Consider<strong>in</strong>g the productive grounds, about half the number of hauls from sub-area V<strong>in</strong> Sabah netted a catch of over 500 kg/hr and most of those from the Marudu Bayoff Kudat, also <strong>in</strong> Sabah, conta<strong>in</strong>ed catches well above this figure and some evenexceeded the 1,000 kg level. In sub-area VI, commercial <strong>fish</strong> represented 60% of thetotal catch by weight (Table 4). Off northwest of Labuan Island <strong>in</strong> sub-area IV, theground was also just as rich with a normal catch of over 500 kg. However, as thenumber of hauls was limited because of the need to avoid the territorial <strong>waters</strong> ofBrunei, the extent to which this particular ground stretched landwards has yet to bedeteqn<strong>in</strong>ed.The only other ground equivalent to sub-areas V and VI <strong>in</strong> quantities of catch perhaul was that off Mukah, Sarawak <strong>in</strong> sub-area II. The rest of the productive grounds<strong>in</strong> sub-areas I-III had a normal catch of less than 400 kg/hr with a few exceptionsoff west of B<strong>in</strong>tulu, north and northwest of Tanjung Sirik. Although the catch rates fromsub-areas II and III were comparatively smaller than those from sub-areas V and VI,representation by the good quality commercial <strong>fish</strong> such as the red snappers <strong>in</strong> subareaII and the silver grunters <strong>in</strong> sub-area III was overwhelm<strong>in</strong>gly high. This had beenreferred to earlier <strong>in</strong> the paper for the red snappers off Tanjung Sirik, B<strong>in</strong>tulu andKuch<strong>in</strong>g and for the silver grunters off Miri. This was also true for hauls carried outoutside the productive grounds, specially <strong>in</strong> sub-areas I and II. Operation of trawlersshould, therefoce, also <strong>in</strong>clude those parts with a catch of less than 200 kg/hr forquality <strong>fish</strong>.The 40 metre depth was closest to the coastl<strong>in</strong>e <strong>in</strong> sub-areas V and VI and less so<strong>in</strong> other sub-areas, particularly sub-area I. As most of the productive grounds lay with<strong>in</strong>this depth limit, they were located closer <strong>in</strong>shore <strong>in</strong> Sabah but extended a little furtheroffshore <strong>in</strong> Sarawak. This was especially true for sub-area I.Hard coral ,beds were found scattered off the Sarawak coast with more concentrations<strong>in</strong> ~sub-area III ..Most. however.' 'were located, outside the productive _grounds and thosethat: lay~wltb<strong>in</strong>'were.m<strong>in</strong>or· ones that. did not cause serious' damage tel the trawl nets.::
3.8 The extent of trawlable ground <strong>in</strong> each sub-areaFor the purpose of calculation, the trawl<strong>in</strong>g grounds considered were delimited bythe 20-50 metre depth levels <strong>in</strong> sub-areas I and II, 20-50 metre depth levels on thewestern side and 20-70 metre depth levels on the cast half of sub-area III, 30-60 metredepth levels off Brunei and 20-30 metre depth levels off Brunei Bay <strong>in</strong> sub-area IV,20-40 _metre depth levels <strong>in</strong> sub-area V and 20-60 metre depth levels <strong>in</strong> sub-area VI.The calculated trawlable grounds for sub-areas I-VI were 5,400, 4,750, 2,500, 1,400,1,490 and 1,700 square nautical miles respectively. These were the net figures obta<strong>in</strong>edafter the elim<strong>in</strong>ation of untrawlable sections such as coral beds found scattered <strong>in</strong> Fig. 7.3.9 Determ<strong>in</strong>ation of catchable <strong>fish</strong> resource for each sub-areaThe method used is based on the area swept by the standard trawl net per hour andthe average catch rate per hour for each sub-area. From these, the density of thecatchable <strong>fish</strong> resource per square nautical mile could be worked out. The extent oftrawlable ground for each sub-area would <strong>in</strong>dicate the size of catchable resource with<strong>in</strong>a specific sub-area.In the present case; the area swept by the trawl net per hour was 20 metres X -2.8knots (~ 0.0302 sq. nautical mile), where "20 metres" was the width of the mouth of thenet and "2.8 knots" the trawl<strong>in</strong>g speed of the vessel. With the available average catchrate figure for each sub-area and the size of trawlable grounds, the density of the <strong>fish</strong>population per sq. nautical mile and the size of catchable <strong>fish</strong> resource could bedeterm<strong>in</strong>ed, as displayed by Table 7.In the present work, estimated catchable <strong>fish</strong> resource is taken as the potential yieldand the fomula (Alverson and Pereyra, 1969) potential yield = 0.4 x M x totalweight of population where M is the natural mortality coefficient is not be<strong>in</strong>g used asit <strong>in</strong>volves a lot of unknown factors. If <strong>fish</strong><strong>in</strong>g mortality can be taken as negligiblysmall and thus ignored, M can be taken as 1.25 by extrapolat<strong>in</strong>g Tanaka's graph (1960).But this would be based on the assumption that all tropical species have a 2-year lifespan. As this is not true and the multi-species Trawl <strong>fish</strong>ery has species with a widerange of life spans, errors would be <strong>in</strong>troduced <strong>in</strong> the calculations. Hence, the use ofthe method seen <strong>in</strong> Table 7.3.10 Estimation of the annual land<strong>in</strong>g by a 30 ton trawler and the number that mayoperate <strong>in</strong> each sub-areaEstimation of the annual land<strong>in</strong>g by a 30 ton trawler is based on a <strong>fish</strong><strong>in</strong>g effort of1,500 trawl<strong>in</strong>g hours per year (200 <strong>fish</strong><strong>in</strong>g days x 7.5 trawl<strong>in</strong>g hours per day). In orderto get a reliable figure for the estimation, <strong>fish</strong><strong>in</strong>g efficiency of this small trawler relativeto that of the research vessels used <strong>in</strong> the present survey has to be determ<strong>in</strong>ed. Thiscould only be done by comparative <strong>fish</strong><strong>in</strong>g. In the absence of the required data, however,another method is used, based on a graph of catches aga<strong>in</strong>st -boat tonnage from Penangcommercial trawlers and extrapolat<strong>in</strong>g the-graph to a boat 80 tons. From the graph.it is:found that:a 30 ton .trawler would have a theoretical catch efficiency 31.5% that.of
"Penyelidik I" or "Penyelidik II". If a 30 tanner were to operate off the coast ofSarawak and off the west coast of Sabah with an effort of 1,500 <strong>fish</strong><strong>in</strong>g hours per year.the estimated annual catch per trawler would be given by the follow<strong>in</strong>g formula:Estimated annual catch per 30 tanner = 0.375 X average catch rate of"Penyelidik I" or "Penyelidik II"from each of the six sub-areas x aneffort of 1.500 <strong>fish</strong><strong>in</strong>g hours.Relative catch efficiency of a 30 tanner could range from 0.375 to 0.600 or even 0.800,depend<strong>in</strong>g among other th<strong>in</strong>gs, on the size of the vessel's eng<strong>in</strong>e, its conditions and theefficiency of its <strong>fish</strong><strong>in</strong>g hands. Pend<strong>in</strong>g the availability of the results of comparative<strong>fish</strong><strong>in</strong>g between a 30 tanner and one of the research vessels, 0.375 could be taken asthe relative catch efficiency. Us<strong>in</strong>g the above formula, the estimated annual catch per30 tonner based on the results of the present surwy would be 84 m. tons, 153 m. tons,147 m. tons, 145 m. tons, 268 m. tons and 308 m. tom respectively for sub-areas I. II,III, IV, V and VI. By divid<strong>in</strong>g the estimated catchable <strong>fish</strong> resource (Table 7) by theestimated annual catch per 30 tanner just worked out, the number of such boats thatcould operate rationally <strong>in</strong> sub-areas I, II, III, IV, V and VI would come to 320, 282,148, 84, 88 and 100 respectively. The number of such trawlers for each sub-area isdependent, among other th<strong>in</strong>gs, on the size of the resource and henc.e of the size of<strong>fish</strong><strong>in</strong>g grounds <strong>in</strong> each sub-area. In Sarawak, the total number is, therefore, 834 trawlersand off the west coast of Sabah <strong>in</strong>clud<strong>in</strong>g the Marudu Bay 188 trawlers. As prawntrawlers which also catch <strong>fish</strong> are already operal<strong>in</strong>g <strong>in</strong> shallow water, the proposednumber of trawlers should beg<strong>in</strong> with half the number, that is, 160, 141, 74, 42, 44 and50 for sub-areas I, II, III, IV, V and VI respectively. Based on subsequent catch trends,the number could gradually be <strong>in</strong>creased to its maximum.The results of the present <strong>demersal</strong> <strong>fish</strong> resource survey showed that the <strong>waters</strong> off thecoasts of Sarawak, Brunei and off the west coast of Sabah were rich <strong>in</strong> resource.Although the overall average catch rate/hr of the comb<strong>in</strong>ed groups of commercial andtrash <strong>fish</strong> was only 318 kg aga<strong>in</strong>st 515 kg from the results of the first survey off theeast coast of Pen<strong>in</strong>sular Malaysia (Pathansali et al, 1974), the correspond<strong>in</strong>g figures forcommercial <strong>fish</strong> were similar <strong>in</strong> the two surveys; 183 kg from the present survey and184 kg from the survey off the east coast of Pen<strong>in</strong>sular Malaysia.If the whole surveyed region is split <strong>in</strong>to sub-areas, it is seen that those off the westcoast of Sabah <strong>in</strong>dicate catchable <strong>fish</strong> density of 16-18 m. tons per sq nautical mile. Thisfigure is much higher than 12.3 m. tons given by Tiews (1966) for the region. Sarawak,on the other hand, produces 5-9 m. tons per sq. n. mile blJt this is compensated by thefact that good quality <strong>fish</strong>es like the red snappers or the silver grunters are found <strong>in</strong>quantities there, especially off Kuch<strong>in</strong>g, Tanjung Sirik, and B<strong>in</strong>tulu for the former grC)upof <strong>fish</strong> and off Miri for the latter group. For Sarawak <strong>waters</strong>, most of the hauls werecarried out further offshore. As such, quantities of trash <strong>fish</strong> were relatively lower than
those <strong>in</strong> Sabah. This partially accounts for the lower average catch rates <strong>in</strong> Sarawak.Table 5 shows that there is a progressive decrease not only <strong>in</strong> the catch of trash <strong>fish</strong>but also of commercial <strong>fish</strong> with an <strong>in</strong>crease <strong>in</strong> depths. In Sabah, the cont<strong>in</strong>ental slopeis much steeper and most of the hauls were accomplished closer <strong>in</strong>shore where,quantities of trash <strong>fish</strong> were expected to be high.The Marudu Bay <strong>in</strong> Sabah, of which Kudat is a base, appears to be the richest area<strong>in</strong> the whole surveyed region, catch of 1,000 kg/hr be<strong>in</strong>g common there. There wereoccasions when large quantities of silver grunters were caught <strong>in</strong> the Bay. In one haul,over 1,000 kg of these grunters were landed after one hour trawl<strong>in</strong>g, this be<strong>in</strong>g thehighest recorded for this group of <strong>fish</strong>. It is <strong>in</strong>terest<strong>in</strong>g to note that despite a highaverage catch figure for commercial <strong>fish</strong> <strong>in</strong> Sabah, contribution by the red snappers wasrelatively lower than that <strong>in</strong> Sarawak.Based on the area covered <strong>in</strong> the present survey, it is estimated that Sarawak andpart of the water off Brunei conta<strong>in</strong> about 104,000 m. tons and the west coast of Sabah55,000 m. tons of catchable <strong>demersal</strong> <strong>fish</strong>, the total be<strong>in</strong>g 159,000 m. tons. Add<strong>in</strong>g am<strong>in</strong>imum of 20% as the prawn component and the <strong>fish</strong> resource <strong>in</strong> shallow water, thefigure would come to 190,000 m. tons. Such addition is necessary as the trawl net wasadapted to catch only <strong>fish</strong> and the survey seldom covered <strong>waters</strong> less than 5 nauticalmiles from the shore. If 50% is taken as the m<strong>in</strong>imum escape rate from the trawl net,it is estimated that the <strong>waters</strong> off Sarawak, Brunei and the west coast of Sarawak wouldconta<strong>in</strong> at least 380,000 m. tons of <strong>demersal</strong> <strong>fish</strong> and prawns. Of this, only half isharvestabfe.With the exceptions of large tracts of coral beds <strong>in</strong> the deeper <strong>waters</strong> off B<strong>in</strong>tulu / Miriand scattered coral beds elsewhere, the greater part of the surveyed region is suitablefor trawl<strong>in</strong>g, the ground generally be<strong>in</strong>g of mud and sandy mud and rarely with claybottom. This is so, despite the presence of deep troughs <strong>in</strong> grounds generally taken as30-40 metres deep off Kuch<strong>in</strong>g. The extensive but fiat bottomed troughs make it possibleto trawl there. The distributions of productive grounds show that even <strong>in</strong> Sarawak, thetrawlers do not have to go further offshore to harvest the <strong>demersal</strong> <strong>fish</strong> resource. Thisis very true for the west coast of Sabah. As sut;;h, 30 ton trawlers are suggested foroperation dur<strong>in</strong>g the <strong>in</strong>itial stage of trawl <strong>fish</strong><strong>in</strong>g <strong>in</strong>dustry <strong>in</strong> Sarawak and Sabah.F<strong>in</strong>ally, it is po<strong>in</strong>ted out here that <strong>in</strong> the determ<strong>in</strong>ation of relative catch efficiency ofa 30 ton trawler, the figure was obta<strong>in</strong>ed by extrapolat<strong>in</strong>g the catches froJD availablecommercial trawlers rang<strong>in</strong>g <strong>in</strong> size from 5 to 40 tons to one of 80 tons (size of oneof the research vessels deployed <strong>in</strong> the present survey), assum<strong>in</strong>g that the graph wouldcont<strong>in</strong>ue as a straight l<strong>in</strong>e. On this assumption was the annual land<strong>in</strong>g per 30 tontrawler estimated and the rational number for operation calculated <strong>in</strong> the paper. If thegraph beg<strong>in</strong>s to level off for boats heavier than 40 tons, then the relative catch efficiencyof a 30 tanner would be more than 0.375 assumed and so would its estimated annualcatch. A more reliable figure could only be obta<strong>in</strong>ed by carry<strong>in</strong>g out comparative <strong>fish</strong><strong>in</strong>gbetween a 30 ton trawler and one of the research trawlers deployed <strong>in</strong> the presentsurvey. At the time of the write-up of this paper, no such comparative <strong>fish</strong><strong>in</strong>g had beendone.
The authors would like to thank Tengku Ubaidillah b<strong>in</strong> Abdul Kadir, the Director-General of Fisheries, Malaysia and Mr D. Patham.:ali, the Director of Research for theencouragement shown <strong>in</strong> the preparation of this paper. Proper handl<strong>in</strong>g of the <strong>fish</strong><strong>in</strong>ggear throughout the survey period by Master<strong>fish</strong>erman Mr J. Jensen under the Malaysia!Geqnan Bilateral Aid Agreement is gratefully appreciated.F<strong>in</strong>ally, the authors wish to thank all the staff of the Fisheries Research Institute,Penang for their <strong>in</strong>volvement <strong>in</strong> the project, the staff of the Mar<strong>in</strong>e Fisheries Department,Kuch<strong>in</strong>g and those of the Fisheries Department, Kota K<strong>in</strong>abalu for their <strong>in</strong>valuableassistance at the time when "Penyelidik I" and "Penyelidik II" were conduct<strong>in</strong>g thesurvey <strong>in</strong> Sarawak and Sabah.1. Alverson, D. L. and W. T. Pereyra (l969)-"Demersal Fish Explorations <strong>in</strong> thenortheastern Pacific Ocean--':"'-Anevaluation of Exploratory Fish<strong>in</strong>g Methods andAnalytical Approaches to Stock Size and Yield Forecasts". J. Fish. Res. Bd.Canada 26: 1985-2001.2. Pathansali, D., G. Rauck, A. A. Jothy, Mohammed Shaari b<strong>in</strong> Sam Abdul LatHIand T. B. Curt<strong>in</strong> (1974)-"Demersal Fish Resources <strong>in</strong> Malaysian Waters (1,Trawl survey of the coastal <strong>waters</strong> off the East Coast of West Malaysia)". FisheriesBull. No.1, M<strong>in</strong>istry of Agriculture and Fisheries, Malaysia: 1-46.3. Tanaka, S. (l960)-"Studies on the dynamics and the management of <strong>fish</strong> populations".Bull. Tokai reg. Fish Res. Lab. (28): 1-200.4. Tiews, K. (1966)-"On the possibilities for further developments of the southeast, Asia Fisheries". CurroAf]. Bull. Indo-Pacific Fish. Coun. (47): 1-13.
-TotalSciaenidae 1.7 l.l 1.8 1.2Scomberomoridae 11.0Seolopsls spp. 0.8 0.2Serranjdae 0.9 1.8 4.2Sphyraena spp. 0.9Siliag<strong>in</strong>idae " 0.8 ,r::'Sparidae 1.8 2.1 I.lSynodonlidae 2.3 1.5 0.9 1.8 0.3 1.5 0.3 0.2 1.4 0.2 1.8 1.2Tachysuridae 8.2 0.3 3.5/ 0.2 1.8 3.3Trichiuridae .. l.lRays 1.5Sharks 12.8 3.5 7.5 15.0 9.3PenaeidaeBracbyura 0.2Thenus orientalisLoligoidea 4.1 5.9 4.8 0.3, 8.3 6.8. 6.3 6.6 4.5 15.3 9.0 11.9 3.5 1.5 3.2Sepioidea 1.0 0.8Others 0.6 10.2 0.2 0.8Wt. of Comm. Fish (kg.) 74.6 47.2 61.8 31.7 61.6 108.2 88.7 16.8 6.8 42.7 75.3 111.8 29.1 54.5 121.2Wt. of Trash (kg.) " 89.3 6.2 10.7 0.6 0.8 4.5 9.0 2.3 4.7 5.4 30.0 25.8 5.0 4.5 7.5Wt. of haul (kg.) 163.9 53.4 77 32.3 62.4 112.7 97.7 19.1 11.5 48.1 105.3 137.6 34.1 59.0 128.7/ .//
Wt; of Comm. Fish (kg.) 95.0 47.7 71.1 114.0 26.5 62.6 83.1 72.4 45.3 130.7 9.9 194.6 98.0 1l0.4 78.8Wt. of Trash (kg.) .. 6.S 6.3 7.S 1.5 48.6 4.5 5.3 3.8 7.5 1.5 7.5 36.0 19S.0 105.0Total WI. of haul (kg.) 9S.0 54.2 77.4 121.S 28.0 Ill.2 87.6 77.7 49.1 138.2 11.4 202.1 134.0 30S.4 183.8>".Haul No. 31 32 33 34 35 36 37 38 39 40 41 42 43 44 45Date 6-4-72 7-4-72Ar~a I IfType of bottomClaySandy SandyS::,:,/!Mud Muddy Sandy Sandy Mud Sofi Soft Sandy Soft Soft Sofimud mad sand mad mud mud mud mud mud mud mudDepth of water (m) 39 41 38 :>9 4/ 43 43 45 47 5/ 54 42 38 26 32Warp out (m) 200 250 250 250 250 250 250 250 250 250 250 250 250 200 200-Chirocentrus--JFishGroupsAnodontostoma chacundaAbalistes stellaris 0.2 1.4 0.1 4.8 3.0 7.2 3.6 0.1Botbidac 1.7 0.2 0.1 4.8 0.9 2.4 0.1 0.3Carangidac .. IS.3 10.1 8.9 11.9 14.6 0.6 4.4 0.8 20.0 4.7 7.2 9.9 18.0 51.0 24.0dorab 0.1 0.2 0.6 1.9C1upcidac 65.0 1.I 0.6 0.1 16.3 27.0 4.8Diagramma punctalum 0.4 14.2 IO.SDrepan~ punctata 0.6 S.S 1.5 0.2 0.3 0.2 0.2 5.0 2.1Dussumierla hassellii 0.2Engraulidac ..Ephippus orbis 1.2 0.3 2.1 1.6 0.1 1.9 2.8 1.3GcrridacLciognathidac!.actarius lactar{uJLutianidac 3.0 23.0 10.6 14.0 56.0 7.4 108.S 121.8Mullidac 2S.0 32.0 91.6 43.6 3.3 0.1 0.8 21.0 23.1 2.3 25.0Nemipterus spp. 3.6 4.2 1.6 4.S 3.2 1.4 4.2 4.4 3.9 s.s 3.1 3.1Pampus argenterus 39.3 1.8Pampus ch<strong>in</strong>ensis . 2.5Parastromateus niger 1.0 0.1 0.1 0.1 0.2 0.6 6.5Pcntapodidac 1.9 18.3 1.4Pomadasys spp. 5.3 12.1 6.3 11.7 18.0 4.9 11.4 12.1 0.3 6.5 2.9Psettodes erumei 0.2 1.5 1.4 0.6 0.3 2.2 0.5 0.1 2.4 1.5Rachycentron canadus 0.6 0.1 8.5Rastrelliger spp. 1.4 0.2 0.4 0;7 0.9 0.4 4.5 1.0 1.5Sciaenidae 2.2 1.4 9.2 4.9 1.3 6.9 3.4 4.1 2.7 1.3 0.7 67.0 5.0
TABLEl-(cont.)CATCH FROM INDIVIDUAL., HAULS BY ':PENYELIDIK I"-(cont.)~:-j ~-:i1;tJ "j,'7 ?: ':'r,"" ) 'f (Kilogramme I Hour)-( cant.) :z. ,-,-0.~! "1,"1....•00Scomberomoridae 1.1 0.7 0.2 1.2 1.8 O.S 2.7Scolopsis spp. 0.1 0.1 0.1Serra·nidae 10.0 0.2 1.3 1.1 0.3Sphyraena spp. 0.1Sillag<strong>in</strong>idae ..Sparidae 1.2Synodontidae 6.9 25 5.9 1.8 S.9 1.1 25 11.9 13.9 4.1 3.3 1.7 0.1 1.6Tachysuridae .. 9.2 14.3 5.1 4.2 4.0 0.9 10.0 21.3 9.1 8.0 7.5 2.2Trichiuridae .. 0.1 0.7Rays .. 40.0 5.7 0.9 3.4 5.3 8.2 33.3Sharks 2.8 7.9 2.6 8.5 7.6 3.2 4.1 3.2 5.1 8.0 2.7 9.6 13.5 2.3Penaeidae 1.0 0.1Brachyura 1.0Thenus orientalisLotigoidea 8.7 6.0 3.2 8.4 6.3 14.4 10.2 9.4 2.6 4.3 2.3 2.9 18.3 1.6 1.2Sepioidea 1.6 0.2 0.2 0.8 0.2Others 1.4 1.2 2.6 42.7 30.0Wt. of Comm. Fish 153.0 127.4 88.9 184.0 91.0 37.1 46.9 41.5 155.9 55.6 207.8 203.2 105.3 303.9 105.0Wt.ofTrash 4.0 8.0 30.0 6.0 60.0 5.3 3.0 2.0 42.8 46.8 40.0 40.1 2.0 280.0 15.0Total Wt. of haul .. 157.0 135.4 118.9 190.0 151.0 42.4 49.9 43.5 198.7 102.4 247.8 243.3 107.3 583.9 120.0---------------- --------_._._-_ .._--------_._-_._--_. __ ._-_ ..-------------_._----Haul No. 46 47 48 49 50 51 52 53 54 55 56 57 58 59 60---------_._ ...__ .._-~_._._-------------- .._.__ .--_._-- ----------_. __ ...----_ .._. -" ..... __._-Date 8-4-72 9-4-72 10-4-72Area 11Type of bottom Soft Sand Sandy F<strong>in</strong>e Sand Sand Muddy F;n~ Sandy Soft Sandy Soft Soft Soft Softmud mud sand sand sand mud mud mud mud mud mud mudDepth of water (m) 34 34 35 39 42 40 36 32 30 28 26 19 17 16 21Warp out(m) 250 250 250 250 250 250 250 200 200 200 200 150 150 150 150------Fish GroupsAnodon/ostoma chacunda 0.4 7.0 0.7Abatistes stellaris 0.6 1.2Bothidae 0.3 0.1Carangidae .. 6.9 10.5 19.6 2.8 0.3 0.9 4.2 39.6 16.7 16.6 34.2 28.1 4.8 17.5
Clziroeentrus dorab •• .. - - - - - - - - - - 0.2 0.1Clupeidae .. .. .. 117.9 5.4 0.2 - - - 2.1 - 0.6 3.0 7.7 - 12.4Diagramma punetatum - 9.0 - - 7.2Dr.pane punetata .. .. 0.2 - - - - - - - 0.5 2.0 0.6 6.9 I.I- 4.2-Rastrelliger\QDussumieria hassellii .. - - - - - - - -- - - - 5.6 - - 0.8Engraulidae •. .. .. - - - - - - - - - - - -Ephippus orhis .. .. 1.6- - - - - - - - - 6.6 4.1Gerridae .. .. .. - - - - - - - - - - - - 1.9LeiognathidaeLactarius Iactarius .. .. - - - - - - - - - - - 2.2 1.4- 0.6Lutianidae .. .. .. 4.5 8.1 - - 34.3 0.8 1l.7 - 0.4 - - 0.2Mullidae .. .. .. 28.4 170l.0 - l.2 - - 2.6 0.5 29.9 11.7 - l.3 - 1.3 4.3Nemipterus spp. .. .. 7.1 12.6 20.6 1.0 4.7 21.0 15.7 5.0 10.9 13.1 9.0 5.9 0.6 2.3 8.8Pampus argenteus .. .. - - - - - - - - - 0.7 - 0.2Pampus eh<strong>in</strong>ensis .. .. - - - - - - - - - - - 1.8Parastromateus niger .. 0.1 - - - - - - - - 0.8Pentapodidae .. .. - - - 0.5 - -1.0Pomadasys spp. .. .. 1.9Psettodes erumei .. .. 0.2 0.3 0.4 - - - - - 0.7 1.3 0.9 0.6 1.9Rachycentron canadus .. - 1.1spp. .. .. - - - - - - 0.7 0.2 38.0 2.0 0.2Sciaenidae .. .. .. 22.2 15.9 0.2 0.6 1.3 I.S 5.9 0.8 - - 1.4Scomberomoridae .. .. 0.9 - - - - - - -- - - - - 2.0Scolopsis spp. .. .. - 2.7 4.2 0.1 1.5 2.4 6.1 2.0 1.4Serranidae .. .. .. - - - - - Sphyraena spp. .. .. 0.3 - - - - - - - - 0.1SilJag<strong>in</strong>idae ..SparidaeSynodontidae .. .. 3.2 - 0.6 2.3 1.0 0.2 2.0 0.9 l.0 2.2 1.0 3.1 0.8 0.7 2.8Tachysuridae .. .. 4.9 - 26.1 1.0 0.1 - 0.6 - 3.4 4.4 5.7Trichiuridae .. - - - - - - - - 0.5 - - - - - 0.6Rays •. .. .. .. 2.7 36.0 - - - 70.0 - - J.4 0.2 66.8 6.9 1.0 3.6 2.4Sharks .. .. .. 10.9 3.3 7.3 17.6 - - - - - 9.9 29.7 7.0 1.3 1.9 15.0PenaeidaeBrachyuraThanus oriematis .. - - - 0.9 - 0.7 0.9 0.7 0.5Loligoidea .. .. .. 6.7 5.1 9.3 1.8 1.3 1.9 2.2 2.8 3.7 3.8 3.2 9.1 2.5 7.0 5.0Sepioidea .. .. .. - - - - - - 0.4- - - 0.1 0.2 - - 0.5Others .. .. .. 0.8 3.6 - - - - 7.9 0.1 - - - - - - -Wt. of Comm. Fish .. 221.7 1797.3 104.1 26.8 46.8 97.5 59.8 16.8 98.5 68.0 185.1 96.0 56.3 23.5 77.1Wt.ofTrash .. .. 40.0 - 30.0 2.0 29.2 40.0 3.0 4.0 50.0 ~\b44
-1'1Ii/t- -;~-1 ~. '1 "Z'"1,-'~t..>-Sciaenidac 1.6 6.7 0.7 5.6 0.5 0.4 0.3 3.8 >. 0.7Scomberomoridae 3.4 0.7 0.3 0.5 :0CI3Scolopsis spp. 0.1 0.2 2.2 2.0 5.0 1.4 2.6 5.8 9.7 0.9 ..0 1.4 0.3Serranidac 16.6 0.7 0.2 0.3 !±::iSphyraena spp. 0.2 1.5 0.2 0Sillag<strong>in</strong>idae .. "2Sparidae 3.9 0.6 5.5 6.4 0., 1.8Synodontidae 2.6 2.8 8.4 5.1 3.1 2.7 1.3 2.4 0.5 5.1 6,3 .~ 5.8 7.3Tachysuridae 2.2 7.5 1.4 4.6 7.0 6.9 10.5 8.2 1.3 L7 20.2 4.1~ ,...,.Trichiuridae ..ll) 0.6Rays .. i=O 0.7Sharks 10.6 9.2 18.8 3.3 9.6 8.1 2.1 2.4 3.7 2.3 5.3 4.6PenaeidaeBrachyura 0.2TIJenus orientalis 0.6 0.3 1.3 I.l 0.6 0.3 0.3Loligoidea 5.2 2.7 2.2 0.7 1.4 0.8 0.9 3.4 3.0 1.4 0.6 1.7Sepioidea 0.2Others 0.9 1.9 0.1Wt. of Comm. Fish 54.6 81.6 67.2 42.0 94.5 130.7 63.0 21.2 140.8 117.2 130.8 57.3 110.0 66.9WI. of Trash 40.0 85.0 80.0 40.5 19.3 132.3 81.3 320.0 250.0 380.0 40.4 2.0 18.7 100.3Total Wt. of haul 94,6 166.6 147.2 82.5 113.8 263.0 144.3 341.2 390.8 497.2 171.2 59.3 128.7 167.2Haul No. 76 77 78 79 80 81 82 83 84 85 86 87 88 89 90Date 14-4-72 15-4-72 16-4-72AreaIIIType ofbottom Soft Soft Soft Soft Sandy Soft Soft Soft Soft Soft Soft Soft Soft Soft Softmud mud mud mud mud mud mud mud mud mud mud mud mud mud mudDepth of water (m) 45 57 52 42 45 62 70 75 70 75 61 55 46 37 22Warp out (m) 250 300 300 250 250 300 350 350 300 350 300 300 250 200 150Fish GroupsAnodontostoma chacunda 4.0Abalistes stel1aris 4.0 2.4 5.4 3.3 5.5 4.5 1.8 0.8 0.8 0.6 1.8 2.4 3.3 4.5Bothidae 0.2 0.1 0.2 0.1Carangidae .. 9.4 9.0 7.2 9.1 40.0 8.2 3.7 2.5 1.8 0.5 1.2 4.4 2.4 30.1 8.7Chirocentrus dorab 0.3 0.8 0.2ClupeidaeDiagramma punctatum 1.8 0.3Drepane punctata 0.7 1.2 0.6 1.0 0.1 2.9Dussumieria hasseltii
~;(Kilogramme/Hour)-(coltt.)''f.. ~ • ;. "1(.rEngraulidae ..EphippusGerridaeorbisLeiognathidaeLactarills lactariusLutianidae ..MullidaeNemipeterus spp.Pampus argenteusPampus clt<strong>in</strong>ensisParastromateus nigerPentapodidaePomadasys spp.Psettodes erumeiRachycentron canadusRastrelliger spp.SciaenidaeScomberomoridaeScolopsis spp.SerraoidaeSphyraena spp.Sillag<strong>in</strong>idae ..SparidaeSynodonlidaeTachysuridaeTrichiuridae ..Rays •.SharksPenaeidaeBrachyuraThenus orlentaUsLoligoideaScpioideaOthersWt. of Comm. FishWt.ofTrashTotal WI. of haul •.147.239.0262.783.0345.70.851.81,080.01,131.80.2111.4 106.40.41.3267.050.4317.4223.375.2298.5142.40.90.52.4368.3495.0863.397.8164.0261.8117.148.9166.00.539.6154.5194.10.540.3188.9229.20.625.3168.1193.40.9102.2111.2213.471.2259.2330.4270.8117.2388.0173.3120.0293.3
Haul No. 91 92 93 94 95 96 97 98 99 100 lor 102 103 104 105Date 19-4-72 20-4-72 21-4-72 22-4-72Area IV .,..,,,,.Type of bottom Clay Mud Mud Mud Mud Muddy Muddy Cloy Muddy Sandy Mud Mud Muddy Sandy Muddysand sand sand mud sand mud sandDepth of water (m) 87 88 83 64 49 49 49 45 46 46 49 33 29 20 31Warp out (m) 350 300 350 300 300 300 300 300 300 300 300 300 250 150 250Fish GroupsAnodontostoma ehaeullda 0.1Abatistes stellaris 0.7 4.6 2.9 1.3 9.8 3.9 15.3 13.6 5.1 6.3Bothidae 0.2 0.1Carangidae .. 1.7 0.2 6.0 7.5 11.9 7.5 18.9 13.0 33.6 17.4 14.0 18.1 18.3Chiroeentrus dorab 0.2 0.2Clupeidae 1.4 0.2Diagramma punctatum 0.1 .•..• 0.9.dDrepane pUllctala 0.5 0.20.2 1.8 0.1gpDussumieria hassellii 0.3 0.2~Engraulidae .. UN Ephlppus orbls 0.2
TABLEl-(cont.)CATCH FROM INDIVID1!AL IJt\U~ BY "fENY~LIDIK I"-(cont.)! r'J 7. "/ , /.,'·i. ',1 ql "" fffl) I~( loi " "4( 4v q~ qi( (KilogrammejHour)--(cont.) .Synodontidae .. .. 0.5 11.2 3.3 26.0 21.0 5.5 20.6 46.1 4.0 2.8 40.6 9.0 4.7 6.2Tachysuridae .. - 1.8 0.5 2.2 - 2.1 0.3 1.3 0.8 2.3 I.S .?;o 31.0 4.3 155.3C::'"Trichiuridac .. - 0.2 0.2 - - - - - - - - o~'t:l;:lRays .. - 15.0 - 7.0 8.0 - 128.6 - 70.0 0.4 Cl) 0:1 9.0 0.0 6.0 5.0Sharks 25.0 - - - - - - 2.2 1.1 - 11.1 ACl)Penaeidae .. - - 1.2 - - - - - - - - :~Brachyura - - 0.2 - - - - - - - - ~~Th:mus orientalis - - - - - - - 0.3 0.4 0.9 0.4Loligoidea 0.8 2.5 1.1 1.2 - 2.0 0.7 1.2 3.0 0.4 5.30:1 •.••c:: Cl)3.9 - 62.4't:l.-::s..c::•... -;;; 0.5 0.1 1.70IlC::c::0Il 1.8 2.3 1.4.- 0Sepiodea - - - - - - - - - - - ::::'0 - - 0.58-Others - 14.2 0.3 - 1.9 •..,,",- - - - - - - 0.3 1.1c::otv We. of Comm. Fish .. 29.1 97.8 17.4 81.2oj::.286.3 84.8 178.7 102.2 145.2 64.9 123.7 8bb 88.9 49.7 300.5Ol..\odWt.ofTrash .. 3.0 55.7 7.5 50.0 34.4 90.4 8.8 187.0 2.6 24.7 56.1 :00 900.0 123.0 124.6Total Wt. of Haul .. 32.1 153.5 24.9 131.2 320.7 175.2 187.5 289.2 147.8 89.6 179.8 d~ 988.9 172.7 425.1Haul No. 106 107 108 109 110 III 112 113 114 115 116 117 118 119 120--Dale 22-4-72 23-4-72 24-4·72Area V VI.. -Type of bollom Mud Mud Mud Muddy Mud Clay Clay Clay Mud Mud Muddy Mud Mud Mud MudsandsandDeplh of waleI' (m) 30 25 20 30 37 46 47 37 31 28 24 28 37 40 40Warp OUI (m) 250 250 150 200 300 300 300 250 250 250 250 250 250 300 300----Fish GroupsAllodonloslomachacundaAbalisles slellaris 0.9 0.4 1.2 0.5 - 8.8 8.4 0.7 1.4- - - - 6.1 3.9Bothidae .. 0.3 - - 0.5 - 0.1 - - 9.1 - - - 2.3 0.1Carangidae .. 19.8 34.0 45.0 1.9 5.6 2.9 30.8 16.1 17.5 41.3 6.8 30.4 32.7 4.1 8.9Chlrocenlrus dorab •. .. - - - - - - - - - - - 2.3
tvVIClupeidae 4.9 1.9 1.4 2.3 J.J 0.2Diagramma puncta/urnDrepane punctala 0.5 3.2 6.4 0.1 1.4 3.2 0.6 7.6 0.2Dussumieria hassel/ii 0.6 7.6Engraulidae ..Ephippus orbis 0.1Gerridae 3.6 22.0 1.2 0.8 3.5 4.1 5.3 0.2Leiognalhidae 139.3 14.6 65.4l.actarius lactarius 2.6 1.2 56.3 1.4 15.4 6.8 3.0Lutianidae 0.6 18.3MuJlidac 0.4 97.5 28.8 60.9 17.1 490.0 114.1 65.1 3.7 21.3 41.4 0.3Nemiplerus spp. 38.8 20.6 14.4 15.3 6.0 38.1 63.0 56.0 22.4 1.6 7.4 15.2 30.8 15.9 12.4Pampus argenteus 0.9 1.3 1.9 7.6Pampus ch<strong>in</strong>ensisParaslromaleus nigerPenlapodidae 2.0Pomadasys spp. 0.5 25.4 3.6 0.7 12.6 4.1 8.1 47.9 2.3Psettodes erumei 3.3 5.4 3.2 1.2 1.4 3.5 3.8 6.8 3.6 3.1Rachycentron canadusRastrelliger spp. 0.2 0.4 1.8 1.4 2.3Sciaenidae 0.7 79.1 14.4 12.3 11.9 0.7 2.1 51.1 18.6 74.4 25.1Scomberomoridae 0.3 1.0 1.8 6.3 2.1 1.4 1.9 3.0 0.8 1.0 2.0Scolopsis spp. 0.6 1.9 6.1 1.4 0.7 0.6 0.8 1.4Serranidae 1.4 0.3Sphyraena spp. 3.5 1.2 10.7 0.7 11.2 20.3 1.9 41.8Sillag<strong>in</strong>idac .. 0.3Sparidac 0.7 1.5 5.6 0.3Synodonlidac 7.8 18.0 1.2 24.3 2.5 17.8 4.9 4.9 7.7 9.9 30.4 54.7 35.0 44.0Tachysuridac .. 12.0 25.4 42.0 14.5 12.4 42.0 25.9 56.7 40.5 17.4 32.7 6.5 13.9 8.1Trichiuridae 1.4 0.1 288.0 0.2Rays .. 19.5 3.6 0.2 2.2 5.3Sharks 13.2 31.2 14.4 24.5 16.0 9.0 11.0 15.4 2.7 36.0 4.6Penaeidae 1.3 0.7 12.4BrachyuraThenus orientalis en 0.1Loligoidea 4.2 1.7 2.9 4.2 7.7 1.9 0.8 3.8 l.SSepioidea 1.2 0.5 0.3 6.3 1.4 0.6Olhers 4.9 1.2 0.2WI. of Comm. Fish 105.9 395.1 616.8 140.5 130.1 103.9 678.9 249.8 297.4 163.7 154.4 360.3 183.5 121.1 109.7WI. of Trash 160.0 285.5 129.8 100.0 319.9 80.8 564.2 571.9 280.0 810.0 647.9 456.0 305.1 241.5 400.3TOlal WI. of Haul .. 265.9 680.6 746.6 240.5 450.0 184.7 1,243.1 821.7 577.4 973.7 802.3 816.3 488.6 362.6 510'0
"1.'7, 'YYl-~.. ,'1 "f\('1••• \.,,'",~.,.-\',/'tv-.:ISciaenidae 42.3 0.6 0.6 13.7 0.1Scomberomoridae 0.3 1.6 0.4 0.3 0.3 0.2Scolopsls spp. 4.3 35.8 5.8 9.7 13.1 4.2 1.5 9.3 6.0 0.6 2.4 1.5 1.1Serranidae 0.2 0.5 0.2 0.1 0.2 0.3 0.2 5.2 1.3Sphyraena spp. 1.4 0.2 0.4 44.4 0.6Sillag<strong>in</strong>idae ..Sparidae 5.4 0.6 0.1 2.0 0.3 1.4Synodontidae 2.8 5.2 0.7 6.4 28.2 0.8 10.0 0.1 4.5 4.6 17.1 0.8 2.4 63.8Tachysuridae 41.7 17.3 21.2 3.5 12.4 0.4 1.4 1.6 11.5Trichiuridae .. 0.1Rays .. 2.8 0.6 9.0 0.4 50.0 0.8Sharks 26.8 21.2 14.6 26.0 4.5 0.2 63.4 12.2 3.6Penaeidae 2.1 0.3BrachyuraThenus orientalis 1.1 0.7 1.0 0.3 0.9 2.5 0.6 1.1 0.9Loligoidea 1.4 29.0 0.5 11.2 3.5 2.4 2.5 5.1 5.7 2.7 4.0 5.0 7.3 1.2 16.3Sepioidea 0.2 0.4 0.2 0.1 0.2 0.4 0.3 0.3Others 1.6 1.0 2.9 12.9 1.4Wt. of Comm. Fish (Kg.) 266.1 119.6 36.1 104.6Y 144.4 109.2 63.3 15.7 58.9 148.2 68.7 113.2 47.2 290.2 119.0Wt. of Trash (Kg.) •. 638.8 24.1 42.7 220.0 182.5 280.2 362.2 40.0 161.6 161.1 60.0 45.0 141.6 41.6 767.9Total Wt. of haul (Kg.) 904.9 143.7 78.8 324.4 326.9 389.4 425.5 55.7 220.5 309.3 128.7 158.2 188.8 331.8 886.9Haul No. 136 137 138 139 140 141 142 143 144 145 146 147 148 149 150Date 29-4-72 30-4-72 1-5-72AreaVIType 0/ bottom F<strong>in</strong>e Sandy Sandy Soft Soft Soft Soft Soft Soft Soft Soft Soft Soft Soft Softsand mud mud mud mud mud mud mud mud mud mud mud mud mud mudDepth a/water (m) 37 47 40 29 30 20 15 21 24 29 29 42 41 39 45Warp out (m) 250 300 300 250 250 200 150 150 200 250 250 300 300 300 300Fish GroupsAnodontostoma chacunda 158.8 179.2 427.5 70.5 6.6 232.2 284.5 0.7 2.5Aba/lstes stellaris 14.8 1.7 1.6 0.2Bothidae 0.1 0.2 0.5 3.4 0.5 1.3 0.8 1.6Carrangidae .. 111.7 5.5 11.6 50.3 19.9 10.6 6.8 50.5 10.6 21.2 297.4 16.0 66.6 8.1 67.3Chirocentrus dorab 1.3 4.2Clupeidae 2.1 2.6 4.8 1.3 0.9 38.9Diagramma punctatumDrepane punc/ola 0.1 19.3 0.5 4.1 0.8
~ ..r(TABLEl-(cont.)CATCH FROM INDIVIDUAL HAULS BY "PENYELIDIK I"-(cont.)\~~ \,1 ~'/; '1,r !) (Kilogramme / HourHcont.)+1 HI \'11,. !~~ "F( ;y
Penaeidae 0.2 0.4Brii~~yura 0.1 0.2henu:' orientaii; 0.8 1.1I,oJilloidea. 23.1 5.4 7.7 4.0 0.5 0.6 0.7 1.3 0.4 1.6Sepioidea 9.6 1.5 3.4 0.3 0.3 2.6 2.7 1.6Olhers 1.5 3.3 1.1 5.8 0.1~I~ ot COmm. Fish (Kg.) 677.5 109.3 130.6 2721.7 1114.1 352.5 557.2 274.2 88.6 429.6 867.7 157.5 495.1 407.0 458.3WI. of Trash (Kg.) .. 230.8 62.9 60.0 332.8 142.7 21.8 160.0 409.8 452.6 124.8 332.8 733.1 330.1TOtal WI. of haul (Kg.) 908.3 172.2 199·6 2721.7 1114.1 685.3 699.9 296.0 248.6 839.4 1320.3 282.3 827.9 1140.1 788.4-
TABLE2CATCH FROM INDIVIDUAL HAULS BY "PENYELIDIK II"(Kilogramme / Hour),.\~. ! " >" ~,i~11:0 l~? I'>'''''\ ',~
TABLE2-(cont.).:'..CATCH FROM INDIVIDUAL HAULS BY "PENYELIDIK II"-(cont.)(Kilogramme / Hour)-( cant.),.,'Diagramma puncfatum 8.3 21.2 13.4Drepane punctata 1.6 1.2 2.1 0.7 0.1 23.8 50.0Dussmnieria hasse/Iii 0.4-Engraulidae .. -'--Ephippus orbis 2.2. ..:.:.... 2.4 2.5 15.0Gerridae 0.2 3.5Leiognathidae 3.7Lactarius lac tar ius 1.0Lutianidae 3.0 0.2 - 0.2 80.4 3.4 74.7 0.2 28.0 44.9 13.2 13.4 21.4 1.2Mullidae 14.3 180.0 11.8 3.6 5.8 3.2 3.1 22.0 1.0 3.5 8.6 21.4 12.9 10.6Nemipterus spp. 2.8 4.2 3.9 0.5 0.8 4.7 7.4 7.8 6.0 4.0 5.2 16.6 6.5Pampus argenteus 5.4 13.6Pampus ch<strong>in</strong>ensisW Paras(rOmtlfeus 1~{ger 0.3 0.3 0.8 0.2N.P.entapodidae 0.4 3.0 3.3 0.5 0.2Pomodasys .spp. 7.8 0.5 11.7 1.2 0.9 6.4 40.2 10.4PS,et'04es erumei 0.3 0.3 0.3 3.7 3.0.Rachyt;entron canadus 0.4 0.3 0.2 0.4 2.0 0.7Restrelliger spp. 4.0 0.2Sciae~idae 43.3 6.7 3.3 2.1 0.3 0.7 1.0 0.3 0.2 23.0 1.3I'com1;leromoridae 2.4~cp/opsis spp. 0.2 0.2 1.0 5.4 0.5 0.2Serranidae 6.0 3.2 4.0 1.2 2.1 0.2 6.2 9.4~phyraena spp . 0.5 1.0.Sill~g<strong>in</strong>idae ...~p"Iidae __.SYIlodontjdae 0.4 3.7 3.0 0.2 1.0 0.3 2.8 7.2 1.2 2.8 4.3 l.5 4.0 0.2.'I;achysuridae 1.7 14.0 4.6 3.0 l.5 0.3 26.0 7.3 7.6 22.0 4.3 0.5Trichiuri4ae .. 1.0Rays ..100.0 0.3 1.0Sharks 4.2 49.0 2.0 1.4 7.4 5.1 3.0Penaeidae 1.3 0.1.Brachyura 0.2Thenus orienralis 2.5 1.8 0.5 2.2 0.1~ligoidea 4.0 12.0 27.6 10.8 1.9 2.0 1.4 6.0 8.3 5.8 5.0 2.1 9.2 1.1
Sepioidea 0.2 4.6 5.8 0.2 0.2 0.1 0.2 0.1 3.3 0.3Others 5.5 1.5 0.2 1.1 1.2 0.5 3.2 2.4 0.2 9.7 0.2Wt. of Comm. Fish (Kg.) 134.9 359.2 73.9 30.0 124.7 ltt.3 124.0 22.1 105.5 148.6 61.4 65.1 299.3 204.9 186.0Wt. of Trash (Kg.) •• 20.0 30.0 15.1 10.5 15.0 1.0 10.0 5.1 20.0 2.0 28.5 20.3 25.0 70.0 100.0Total Wt. of haul (Kg.) 154.9 389.2 89.0 40.5 139.7 lt2.3 134.0 27.2 125.5 150.6 89.9 85.4 324.3 274.9/ 286.0./,- /~,J.,.Iyl \l \.. I{ .•. t '0; .~! ' \ Y I 1'}~ \ 0 " t )J) , ~::\,"'.'.> ; (Q( \\ :"'THaul No. 31 32 33 34 35 36 37 38 39 40 41 42 43 44 45Dale 6-4·72 7-4-72 8-4-72Area I IIType of bOl/om 1l1ud Sand Sand Sandy Mud Muddy Sandy Sandy Sand Sand Sand Sandy Sand Sand :Mudmud sand mud mud mudDeplh of lValer (m) 33 37 35 28 19 27 38 32 35 43 42 46 37 30 23Warp oul (m) 150 200 200 150 ISO 150 200 150 150 200 200 200 200 200 150Fish GroupsAnodontostoma chacunda 1.5Abatisles slellaris t.t 3.4 2.5 2.0 5.9 11.0 10.8 3.5 1.3W Bothidae 1.4 0.3 1.6 0.2 0.8wCarangidae .. 6.8 22.6 21.8 16.1 9.0 51.4 5.7 3.7 17.6 1.2 0.7 1.2 33.0Chirocenlrus dorab 0.7 0.7 0.4 t.tClupeidae 16.2 3.3 4.7 23.2 0.8 44.0 1.5 6.1 5.2Diagramma punctatum 1.3 10.4 7.4 4.6 20.0 4.6 2.1Drepane punclala 0.3 0.4 0.6 11.4 4.8 3.2 I.t 1.0 10.8Dussumieria hasseilli 0.2 0.8 2.5 0.4Engraulidae ..Ephippus orbis 0.4 0.4 4.4 0.1 5.0 0.6 ~ 0.3UGerridae.•... ::3Leiognathidae 3.0 17.2iZlLaClarius laclarius 0.2.•... 13.4 0.6ll)Lutianidae 0.4 32.2 4.0 133.2 75.2 3.8 10.0 5.8ZMullidae 5.8 0.5 96.0 12.0 1.6 15.8 45.6 30.0 11.6 1.8 0.2 4.8 8.1 29.0Nemiplerus spp. 6.6 3.3 t.t 0.1 1.8 3.2 6.7 3.5 0.3 5.1 7.5 2.4Pampus argenteus 10.0 45.8 21.5Pampus ellillens/sParaslromaleus niger 0.6 6.0 1.8Pentapodidae 0.8 0.2 2.5 7.3 5.3 0.2 0.1Pomadasys spp. 2.8 0.2 0.5 11.6 35.4 9.2 10.5 54.0 0.6 1.0Psel/odes erumei 0.8 0.5 0.3 1.0 1.0Rachycentron canadus 0.7 0.6 3.6 0.9 0.4 0.1
TABLE2-(cont.)CATCH FROM INDIVIDUAL HAULS BY "PENYELIDIK II"-(cont.)(Kilogramme/Hour)--( cont.)Rastrelllger spp. 0.2 0.2 1.2 2.3 3.1Sciaenidae 5.0 1.2 0.5 7.4 27.0 5.2 2.7 53.4 6.2 10.0 10.4 54.0Scomberomoridae 0.7 2.4Seolopsis spp. 0.5 0.1 0.3 0.3 1.0 0.4 0.4 1.8 6.8Serranidae 0.2 0.4 5.6 0.3 0.2Sphyraena spp. 0.1 1.4 0.3 0.2Sillag<strong>in</strong>idae ..Sparidae 2.1Synodontidae 35.3 2.3 1.7 0.5 2.5 3.5 4.8..s
Carangidae .. 28.2 37.9 28.0 0.2 1.8 0.3 0.4 15.3 0.4 7.5 9.4 13.3 11.0Chirocentrus dorab 0.3C1upeidae 4.0 0.7 0.7 3.9 1.6 2.9 0.2Diagramma punctatum 14.2 3.8 4.9 12.6 16.0Drepana punctata 7.4 0.5 3.5 1.0 2.0 1.9 1.1Dussumierla hasseltli 0.9Engraulidae ..Eph/ppus orbls 2.0 4.0 0.5 4.7 0.5Gerridae 1.0LeiognathidaeLactarlus lactarlus 2.8 0.1 2.3 1.0 0.2Lutianidae 10.3 14.3 2.4 33.4 4.0 27.0 0.2 0.1 0.1Mullidae 50.8 10.2 1.0 4.2 0.9 4.2 3.4 12.6 1.0 1.3 2.0 22.4 37.6 30.0 11.9Nem/pterus spp. 2.5 7.0 3.7 1.3 1.2 6.3 0.4 0.6 1.2 14.6 J.l 6.8 3.8Pampus argcntcusPampus ch<strong>in</strong>ensisParaslromaleus niger 0.8 0.4 1,5Pentapodidae 0.8 0.8 1.3 0.1 0,1 0,2Pomadasys spp. 1.0Pseltodes erumei 1.0 1.5 0.7 1.6 1.7 0,2Rachycentron canat/us 0.5 0.2WV. Rastrelliger spp.15.8 0.3Sciaenidae 1.5 7.5 0.7 1.0 0.3 2.0 1.2Scomberomoridae 2.0 1.0 5.8Scolopsls sPp. 0.4 0.6 1.5 0.1 0.8 2.6 0.1 0.2 0.7Serranidae 0.2 11.8 4.0Sphyraena spp. 0.3Sillag<strong>in</strong>idae ..Sparidae 0.2Synodontidae 2.2 0.4 0.5 0.1 1.2 1.9 0.7 1.0 0.4 J.l 0.1 2.6 1.8Tachysuridae 2.0 21.0 2.8 0.8 0.3 4.6 4.0 29.0 1.0 10.2Trichiuridae .. 0.2Rays .. 20.0 1.0 10.0 8.6Sharks 7.0 7.4 4.5 2.5 20.0 0.8 7.4 23.0 1.0PenacidaeBrachyura 0.2 0.1Thenus orlelltalls 0.6 2.0 1.5 0.8 1.9 0.1 l.l 1.1 0.4 0.1 0.2 1.0 0.2Loligoidea 3.5 7.0 7.1 1.3 0.8 0.5 3.8 6.2 1.0 1.4 5,2 2.2 13.3 9.8Sepioidea 0.1 0.5 0.8 0.1 0.7 l.l 0.1 0.3Others 0.6 6.7 0.7 0.5 02 5.5 0.2 12.3 0.8 0.1Wt. ofComm. Fish (Kg.) 111.2 146.8 54.6 46.9 24.6 32.3 24,1 95.8 23.0 4.9 79.7 81.7 96.0 104.0 60.4Wt. of Trash (Kg.) ., 60.0 40.0 5.0 10.0 10.0 40.1 25.0 6.6 1.0 10.6 10.0 90.0 20.0 400.0 15.0Total Wt. ofhauJ (Kg.) 171.2 186.8 59.6 56.9 34.6 72.4 49.1 102.4 24.0 1.l.5 [,9.7 171.7 116.0 504.0 75.4
TABLE2-(cant.)CATCH FROM INDIVIDUAL HAULS BY "PENYELIDIK II"-(cant.)(Kilogramme / Hour)-( cant.)vf~),~~elf "I' )(). )...1') )(t.( }Itf )rb Jl ;. r-r ..r ')'~ l~ ')-~! }fv " ,Haul No. 61 62 63 64 65 66 67 68 69 70 71 72 73 74 75Date 12-4-72 13-4-72 ]4·4-72Area II IIIType 0/ bottom Muddy Mud Clay Mud Mud Coral Sandy Muddy Mud Sand Mud Muddy Mud Mud Sandsand mud sand sandDepth a/water (m) 19 24 27 30 38 32 32 26 22 26 27 25 25 27 22Warp out (m) 150 150 150 200 200 200 200 150 150 150 150 150 150 150 150---Fish GroupsAnodontostoma chacunda - - - 46.6 0.3 - 8.7 - - - - - - - 0.1Abatistes stellaris 0.5 - - 0.5 3.5 10.4 1.7 - 1.0 - 1.0 2.7Bothidae - - 0.8 - - - - - - - 1.0 0.1 - 0.2w Carangidae .. 137.3 46.8 17.2 39.5 6.5 9.0 18.9 28.2 18.1 19.2 5.6 12.8 52.0 4.7 16.80\ChirocelJtrus dorab 0.9 - - - - - - - - - - - - - 0.2Clupeidae - 13.8 18.1 2.5 0.2 - - - 11.0 - - - - - 0.1Diagramma punctalum 4.9 - - - - - 6.5 - - 4.2 0.8 14.0 0.5Drepane punctata .. 0.2 1.4 3.1 1.5 0.4 1.0 1.0 0.8 2.7 0.4 - - 0.8 0.3 3.5Dussumieria hassellii 0.4 - 0.2 12.3 - - - - 2.0 - - - - 0.4 1.0Engraulidae ..Ephippus orbis 0.6 0.5 - 0.4- - - - - 0.3 - - 1.0 0.1 0.1Gerridae - - - - - 0.1 - - 0.1 - - 1.0 3.8Leiognathidae - 32.2Lactarius lactarills - - 0.4 15.0 0.1 - - - - - - - - - 0.1Lutianidae 1.3 2.1 - 129.9 5.5 0.6 0.7 - - 14.0 14.2 7.1 3.0 0.3Mullidae 320.0 80.0 84.6 26.5 78.0 4.0 0.2 4.5 30.0 9.5 1.7 2.4 23.0 80.0 24.0Nemipterus spp. 2.3 2.5 15.1 5.4 13.8 6.0 7.7 19.8 6.9 0.8 16.3 2.7 27.0 6.1 3.6Pampus argenteus - 0.3 - 1.2- - - - 1.6 - - - - - 2.8Pampusch<strong>in</strong>ensisParastromateus niger 1.0 1.9 0.5 15.6 - - - - - - - - -0.4Pentapodidae - - - - - 0.1 - - - - 4.9 0.1Pomadasys spp. 2.0 - 1.0 22.6 - - - - - - - - - 0.6 1.9Psettodes erumei - - 0.1 0.5 0.1 - - - 1.0 0.4- 0.3 1.0 0.2 1.0Rachycentron canadus 24.6 - - - - - 2.3 1.3 - - - 0.1Rastrelliger spp. - - 0.8 5.5 0.5 - - -1.4 1.7 0.1 0.1 - 0.1.) i v
~.....:lSciaenidae .. .. 1.0 1.6 14.9 1.1 0.3 0.1 0.2 3.4 0.2 - 1.0 4.7 5.0 1.1 2.6Scomberomoridae 4.5 8.2 -- 0.5 - - - 0.3 - 7.3Scolopsis spp. .. 0.4 0.2 - 2.4 3.0 1.8 0.2 J.I - 1.0 4.1 0.1 1.7Serranidae .. .. .. - - - - - 0.1 0.2 - 5.0 0.3 10.0 0.5Sphyraena spp. .. 3.2 0.1 1.0 10.4 0.5 0.1 0.5 0.2Sillag<strong>in</strong>idae .. - - - - - - - - - - - -Sparidae .. - - - - - 2.1 2.3 0.2 - 1.7Synodontidae ., 0.4 1.6 10.9 1.0 9.3 2.0 4.5 6.0 7.5 0.1 3.1 0.1 7.5 1.4 4.3Tachysuridae 57.8 - 5.2 46.0 6.6 14.5 7.0 22.0 4.0 3.0 0.9 - 13.3 5.0 4.0Trichiuridae .. .. - 1.2 - 0.4Rays .. - - - - - - 100.0 - - - - 150.0 201.7 5.0Sharks .. - 67.9 42.0 54.0 18.0 9.0 8.0 8.5 55.0 9.8 3.2 2.7 1.7 8.0 4.0PenaeidaeBrachyura - - - - - - - - - - 0.2Thenus orienta lis - 0.1 - - 0.2 0.9 0.5 1.0 - 0.4 3.4 0.8 1.5 0.7 1.9Loligoidea 8.1 2.0 3.2 1.2 2.2 - 1.4 3.5 1.3 2.4 10.3 2.0 3.5 0.7 1.6Sepioidea 0.1 0.2 - - - - 0.5 0.1 - - - 1.0 - 0.3Others - 0.5 0.2 8.7 2.2 0.3 1.0 - 0.6 5.3 2.4 1.6 0.5 0.1 0.1Wt. of Comm. Fish (Kg.) 571.4 265.0 219.5 448.3 148.7 62.6 173.9 103.4 144.0 80.4 76.5 214.6 355.8 115.7 75.7Wt. of Trash (Kg.) .. .. 40.0 80.0 100.0 1650.0 26.2 3.5 5.0 101.0 100.0 280.0 40.0 90.0 60.0 80.0 100.0Total Wt. of haul (Kg.) .. 611.4 345.0 319.5 2098.3 174.9 66.1 178.9 204.4 244.0 360.4 116.5 304.6 415.8 195.7 175.7.. p'-.....~ }~) lY~ ))~),~ P'. ., ~.z'}~I;3( ..;\,"III- / ••/;:-"'' " ~ ""'1.2- ';.( ; .-Haul No. 76 77 78 79 80 81 82 83 84 85 86 87 88 89 90~j 1 r 1 .-~ '~".I "'IDate 14-4-72 15-4-72 16-4-72Area 111Type of bottom Mud Mud Mud Mud Sandy Mud Mud Mud Mud Mud Mud Mud Mud Mud MudmudDepth of water (m) 31 23 24 21 38 28 38 29 23 22 41 51 52 49 41Warp out (m) 200 150 150 150 200 200 200 200 150 200 200 200 300 250 200--Fish GroupsAnodontosloma chacunda - - - - - - - ~Abalistes stellaris .. .. 7.6 2.5 1.0 - 0.8 2.0 0.4 1.4
--'--~~{--il' -~)
TABLE2--(cont.)CATCH FROM INDIVIDUAL HAULS BY "PENYELlDIK ll"-(conl.)(Kilogramme / Hour)--( cont.)Synodontidae 0.1 4.5 0.8 1.5 1.7 19.6 17.2 10.2 24.8 11.1 39.0 20.0 0.2 0.1Tachysuridae 0.1 1.2 2.6 1.0 I.S 9.3 2.6 2.1 27.6 14.7 1.6Trichiuridae .. I.S 0.1 1.0Rays .. 300.0 100.0 252.0 20.0 150.0Sharks 2.5 2.3 2.8 8.3 23.0 20.0~Penaeidae 0.2 0.4 0.2 (,)~Brachyura c7.iThenus orientalis 0.1 0.1 0.3 0.2 0.9 1.4Loligoidea 0.2 5.5 0.4 3.1 3.1 3.8 11.3 1.0 1.3 1.0 3.4 4.6 1.0 Q) I.SSepioidea 0.2 0.4 1.0 ZOthers 54.5 0.2 6.0 0.1 6.2 0.1 5.0 0.8 9.8 91.6Wt. of Comm. Fish (Kg.) 26.1 96.8 325.6 37.4 31.2 66.5 227.0 67.5 164.3 74.9 385.3 434.0 241.8 253.6Wt. of Trash (Kg.) ., 12.0 10.2 10.0 63.0 35.2 6.5 54.0 17.0 60.0 21.4 33.4 180.0 830.0 25.0Total Wt. of haul (Kg.) 38.1 107.0 335.6 100.4 66.4 73.0 281.0 84.5 224.3 96.3 418.7 614.0 1071.8 278.6~0}.~1 ,,;;:{ 1.~~ ),~11ko 1-6'L.{-v-~_?Jkr i-b:( ;.~1 ).b1 "f, /~ .It-?H" ~ j ;.Haul No. 106 107 108 109 110 111 112 113 114 115 116 117 118 119 120Date 22·4-72 23-4-72 24-4·72AreaVType 0/ bottom Mud Mud Mud Mud Mud Mud Mud Mud Mud Mud Mud Mud Mud Mud MudDepth of water (m) 25 26 26 32 40 42 30 32 27 23 27 27 32 34 47Warp out (m) 150 150 150 150 200 200 200 200 150 150 150 150 200 200 200.....1.0Fish Groups1. .r"1Anadontastoma chacunda 1.0 0.5 0.2AbaUstes stellaris 19.5 3.4 2.0 5.1 4.2 1.0 1.1 0.5 0.2 2.6 5.7Bothidae 0.1 0.1 0.1 0.4 0.3Carangidac .. 5.2 15.9 1.1 1.6 14.5 1.1 10.5 17.2 15.4 11.1 38.3 36.8 34.3 2.2 10.6Chirocenfrus dorab 1.0 0.3Clupeidae 1.3 183.7 0.1 2.1 11.0 3.8Diagramma punctatum 0.7 1.1 0.3Drepane pUl1ctata 0.1 0.2 0.2 0.2 0.4 0.3 0.3 0.8 0.4 0.3
~tJr,IiTABI.E2--(cont.)CATCH FROM INDIVIDUAL HAULS BY "PENYELIDIK ll"-(cont.)(KilogrammelHour)-(col1t.)').11 ~1- l{k· t1~}'1;:"'}1 ;-'42 15 -q~ 190 )} ! }.& l.-- ,." 8' I),0 ",)\~, , "1 .;:- ,;- '!.,,;t. r..;.- (HaulNo. 121 122 123 124 125 126 127 128 129 HO HI H2 H3 134 H5Dale 26-4-72 27·4·72 28-4-72 29-4-72AreaVIType 0/ bottom Mud MIld Mud Mud Mud Mud Mud Sandy Sandy Sandy Mud Mud Mud lv/ud Mudmud mud mudDepl" a/water (m) 40 41 50 43 48 38 47 43 44 41 41 47 47 50 45Warp oul (m) 250 250 300 300 300 250 300 250 300 300 250 300 300 250 250Fis" GroupsAnodonlosloma c"acundaAbalisles sleliaris 3.4 11.8 1.5 5.1 6.3 5.2 2.4 0.9 2.5 2.7 3.7 3.2A Bothidae 0.1 0.1 0.1 1.0 1.4IVCarangidae .. 8.1 2.1 0.8 0.3 24.2 4.2 5.3 4.3 2.4 14.8 1.9 5.2 41.1Chirocentrus dorabClupeidae 1.4 66.8 0.1 0.2Diagramma punctalum 2.0Drepane punctala 0.1Dussumieria hassellii 0.4Engraulidae ..Ephlppus orbisGerridae 1.1 0.6 1.2Leiognathidae 2.1Lactarlus [actarills 2.0 65.4Lutianidae 0.2 0.1 4.9 0.4 2.0 5.0 0.5 0.1 0.2 21.4Mullidae 13.6 1.5 355.0 2.8 498.8 20.0 39.2 0.3 5.0 1.6 8.1 7.6 0.1 1.6Nemiplerus spp. 20.6 12.4 1.2 3.2 5.7 16.0 9.0 0.9 13.8 19.4 8.2 34.8 49.8 11.8 31.6Pompus argenteus 1.2 0.6Pampus ch<strong>in</strong>ensisParaslromaleus niger 1.5 0.5 0.5Pentapodidae 3.4 0.3 0.4 6.1 2.6 S.4Pomadasys spp. 0.3 0.1 8.0 1.5 I.S 0.2 2.3 26.7PUllodes erumel l.l 0.1 14.2 2.0 0.9 0.2 1.0Rachycenlron canadus 1.5 0.1 0.3 2.2 1.3 0.3j
Raslrelliger spp •. 1.5 10.0 0.2 0.2 0.7Sciaenidae 56.8 0.5Scomberomoridae 3.4 0.9 0.1 1.4 2.0 1.0 0.8 0.1Seolopsis spp. 5.4 6.8 0.8 0.8 0.2 1.5 0.1 3.5 7.1 6.7 7.5 3.7ol:oWSerranidae 2.8 0.2 0.1 0.3 0.3 0.5 0.2 1.0 14.6 ..,.".Sphyraena spp. 2.2 18.8 0.4 49.7 0.1 0.2Sillag<strong>in</strong>idae .. 0.1 0.1Sparidae 0.1 1.6 1.5 0.3 0.1 1.7Synodontidae 27.7 0.5 3.0 51.6 6.9 16.6 0.1 3.8 10.3 13.6 19.7 27.4 34.2 9.9Tachysuridae 19.2 7.8 0.2 764.5 17.0 3.6 0.8 9.6 l.l 3.1 3.1 0.2Trichiuridae .. 1.0 35.5 0.1 0.1Rays .. 3.0 23.0 4.5 54.5 200.0 200.0 100.0Sharks 11.3 4.8 5.5 8.5 11.4 2.7 3.3Penaeidae 0.3 3.8BrachyuraThenus orientalis 0.4 4.0 0.9 0.2 2.8 0.1 0.1 0.2 0.6 1.1 0.2 1.8 1.0 0.9 0.2Loligoidea 6.8 1.0 10.0 1.0 4.1 7.0 7.8 5.7 3.1 5.3 11.4 3.0 8.3Sepioidea 0.1 0.2 0.2 1.5 0.2 0.2 1.5Others 3.7 0.1 0.1 11.4 11.5 47.1 1.0Wt. of Comm. Fish (Kg.) 124.8 35.0 401.8 35.2 1698.5 93.4 150.4 14.9 251.4 72.9 53.5 1020 367.2 177.0 165.4WI. of Trash (Kg.) .. 1103.0 50.1 190.0 23.5 258.6 40.0 50.4 15.0 73.6 63.4 15.2 42.2 120.7 25.0 20.1Total WI. of haul (Kg.) 1227.8 85.1 591.8 58.7 1957.1 133.4 200.8 U.9 325.0 136.3 68.7 144.2 487.9 202.0 185.5-----y2~ ill- h.~~ v1U.•.. , r.''}q';/ ,C; ,.., C; -, ,, , ;> ___~2. "" • If' ..' ,( ' . '"IHaul No. 1),6J
TABLE2-(cont.)CATCH FROM INDIVIDUAL HAULS BY "PENYELIDIK II"-(cont.)(Kilogramme / Hour)-(cont.)Dussumi~ria hasultii .. - - - 2.9 - 0.6 0.4 0.4 2.6 S.2 6.1 0.4 31.6 S.OEngraulidae ..Ephlppus orblsGerridae - 0.1 - 1.4 0.3 2.3 1.0 3.6 1.2 1.8 - 0.3 - 0.1Leiognathidae .. - - 21S.1 34.7 33.8 12.4 18.1 23.S 11.2 33.2 4.0 191.7 7.0Lactarius lactarius .. - - - 60.2 1.4 1.2 0.6 1.0 4.4 0.4Lutianidae .. - - - 2.9 37.7 3S.0 - - 4.0 O.S - - - 3.8Mullidae 2.8 1.1 0.6 30.1 67.3 16.4 17.1 7.8 39.2 S6.7 76.8 S7.0 S7.1 23.9Nem/pterus spp. 37.S 9.1 24.0 II.S 4.6 24.2 9.0 12.0 22.0 26.6 SS.2 76.4 29.3 41.2Pampus argenteus - - 0.3 S.O 2.3 1.7 7.8 S.7 1.5 4.4 45 2.9 II.S 7.2Pampusch<strong>in</strong>ensisParastTamaleus nigrr - - - - - 0.4 - - - 5.8 0.7 - 3.7 4.6PentapodidaePomadasys spp. I.l 0.4 3.1 IS.8 6.3 16.9 8.8 12.9 16.6 24.1 18.2 9.0 1.7 2.2~ Psettodes erumei 0.1 0.2 0.2 - 0.3 0.2 O.S 1.0 0.4 0.8 S.6 4.7 3.0 4.4Rachycentron canadus - - - - - - - -RastreJIIger spp. .. - E- 8.6 0.7 2.9 0.7 2.SO.S - 0.1 0.7 1.0 05Sciaenidae .. - - - 143.4 0.7 0.4 0.8 0.4 ~ 8.7 4.6 - 1.0 6.0 1.8Scomberomoridae - - - 2.9 0.3 0.4 - 1.1 •... - O.S - 0.6 3.8 1.9Scolopsls spp. S.4 0.4 04.1 - - - - - - 0.1Scrranidae 0.1 0.2 - - - Z- - S.4 - 0.1 0.3 - 0.1Sphyraena spp. - - - 10.0 0.7 1.4 S.3 1.1 9.1 1.6 - - 3.0 0.2Sillag<strong>in</strong>idae ..Sparidae - - - 7.2 - - - - - - - - 0.3 0.3Synodontidae 41.4 105 42.0 38.7 29.1 13.3 4.4 11.3 13.1 21.7 31.6 37.9 17.3 48.4Tachysuridae - 0.4 37.3 11.4 10.2 13.0 20.9 IS.I 37.0 2S.6 6.4 - 21.2Trichiuridae .. .. 0.1 - 67.4 - - 0.3 0.1 - - 0.1 - 11.3Rays .. .. - - - - - - - - - - - 4.0Sharks .. - - - - - 0.3 3.9 - 0.2 21.0 14.4 9.4 15.1Penaeidae .. .. - - 11.4 0.1 0.3 - - 0.1 0.1Brachyura - - - - - 0.2 - - - 0.3Thenus orientalis - - - - - - 0.1Loligoidea 1.9 3.4 10.2 5.7 1.3 I.S 1.4 0.4 10.4 0.3 0.3 0.3 1.0Sepioidea 0.1 0.7 - 0.2 0.6 05 0.7 O.S 0.8 0.1 0.1 0.9Others 0.4 - - 17.2 - - 0.4 - - - 2.9 - - 2.3WI. of Comm. Fish (Kg.) .. 98.1 28.6 9S.2 172S.8 S92.9 288.3 198.0 188.1 321.S 299.S 317.0 301.0 406.2 239.3Wt. of Trash (Kg.) .. 2S.0 l.S 16.2 1290.6 346.7 120.7 323.0 140.0 640.0 100.0 200.0 21S.1 S64.1 266.6Total Wt. of haul (Kg.) .. 123.1 30.1 111.4 3016.4 939.6 409.0 S21.0 328.1 961.S 399.S S17.0 S16.1 970.9 50S.9
jTABLE 3IIAVERAGECATCH RATES ACCORDING TO SUB-AREAS. IRRESPECTIVEOF "PENYELIDIK I" OR "PENYELIDIK II"(Kilogramme/Hour)Fish Groups-WholeSub-areas I /l 1Il IV V VI SurveyedRegionNumber of hauls 70 57 49 24 32 60 292Anodontostoma chacunda 0.09 0.99 0.52 0.05 36.69 7.85Abalistes stellaris 2.08 1.21 2.17 3.92 2.77 2.42 2.22Bothidae 0.34 0.14 0.07 0.07 0.42 0.25 0.22Carangidae 9.37 16.14 16.09 7.75 17.67 21.09 15.00Chirocentrus dorab 0.08 0.10 0.08 0.02 0.11 0.12 0.09Clupeidae 10.64 5.33 0.23 7.73 6.69 19.17 8.94I Diagramma punctaturn 3.23 2.58 0.90 0.43 0.62 1.60Drepane punctala 2.23 1.25 0.82 0.09 0.88 0.5i 1.13Dussumieria hassellii .. 0.10 0.41 0.08 0.15 0.45 1.69 0.53Engraulidae 0.08 0.02Ephippus orMs 0.98 0.66 0.11 0.02 0.01 0.04 0.39Gerridae 0.05 0.05 0.14 0.51 1.63 6.25 1.55'ILeiognathidae 0.11 0.87 0.22 9.13 41.40 9.72Lactarias factarius 0.06 0.71 0.24 0.25 3.95 2.48 1.16Lutianidae 14.28 14.31 4.28 1.68 0.83 3.82 7.95Mullidae 16.16 49.23 26.93 17.57 64.07 39.07 34.49N~mipterus spp. 5.98 5.68 19.91 18.85 19.25 28.59 15.42Pampus argenteus 1.46 1.14 0.36 0.78 2.05 1.14Pampus ch<strong>in</strong>ensis 0.03 0.08 0.02Parastromateus niger .. 0.69 0.56 0.08 0.13 0.08 0.57 0.42Pentapodidae .. 1.37 0.75 0.25 0.28 0.33 0.48 0.68Pomadasys spp. 4.73 2.94 9.60 2.99 4.58 25.03 9.21Psettodes erumei 0.62 0.41 0.41 0.44 1.29 1.40 0.76Rachycentron canadus 0.55 0.71 0.58 0.95 0.40 0.53Rastrelliger spp. 0.42 1.38 0.61 0.01 0.53 1.03 0.74Sciaenidae 5.90 5.80 1.42 1.73 19.14 5.29 6.11Scomberomoridae 0.63 0.61 0.31 0.23 1.26 0.51 0.58Scolopsis spp. .. 0.44 0.69 1.48 0.92 1.42 2.74 1.28Serranidae 2.25 0.44 1.32 0.65 0.35 0.95 1.13Sphyraena spp. 0.22 0.31 0.32 1.98 5.04 8.58 2.65Sillag<strong>in</strong>idae 0.01 0.D3 0.02 0.01' ItSparidae 0.22 0.06 0.66 0.27 0.48 0.50 0.35Synodontidae .. 3.04 2.46 8.09 14.22 12.22 19.80 9.14Ili:iI'Tachysuridae 5.84 6.81 7.15 4.44 24.26 24.44 11.98 ' ITrichiuridae 0.12 0.18 1.27 0.13 9.20 1.94 1.69IRays 6.27 13.35 12.35 44.42 1.39 11.43 12.33Sharks .. 5.24 9.56 6.66 4.26 12.52 5.85 7.17Penaeidae 0.29 0.15 0.02 0.08 0.48 0.32 0.23Brachyura 0.01 0.03 0.01 0.01 0.01 0.01Thenus orientalis 0.12 0.35 0.37 0.23 0.16 0.43 0.28Loligoidea 6.59 4.50 1.53 2.48 2.20 4.29 4.04Sepicidea 0.55 0.10 0.08 0,07 0.53 0.55 0.34Others .. 1.90 3.30 0.59 4.13 3.34 2.17 2.35IAU co=ercial <strong>fish</strong> 115.37 156.33 128.09 143.91 229.94 324.98 183.45Trash <strong>fish</strong> 33.40 114.95 133.03 114.21 246.60 221.75 134.74Comb<strong>in</strong>ed groups 148.77 271.28 261.12 258.12 476.54 546.73 318.19M<strong>in</strong>imum 11.40 20.80 27.30 24.90 57.70 29.90 11.20Maximum 726.80 2098.30 1131.80 1071.80 1359.90 3016.40 3016.4045I, ilr:II
I,L:il·I:11 • TABLE4ii,'I ''I' PERCENTAGE CATCH BY WEIGHT ACCORDING TO SUB-AREAS,:1 11 :I I,IRRESPECTIVE OF "PENYELIDIK I" OR "PENYELIDIK II"I!I i IWholeSub-areas I II III IV V VI SurveyedRegionNumber af hauls 70 57 49 24 32 60 292Fish Graups-Anodontostoma chacunda 0.06 0.37 0.20 0.01 6.71 2.47I, Abalistes stellar is 1.40 0.45 0.83 1.52 0.58 0.44 0.70I',Bothidae 0.23 0.05 0.03 0.Q3 0.09 0.05 0.07Carangidae 6.30 5.95 6.16 3.01 3.71 3.86 4.72Chiraeentrus dorab 0.06 0.04 0.03 0.01 0.02 0.02 0.03L Clupeidae 7.15 1.97 0.09 2.99 1.40 3.51 2.81'II Diagramma puneialum 2.17 0.95 0.34 0.09 0.11 0.50H Drepane punctala 1.50 0.46 0.31 0.04 0.18 0.10 0.351 I Dussumieria hasse/ti; .. 0,07 0.15 0.03 0.06 0.09 0.31 0.17I! Engraulidae 0.05 0.01Ephippus orhis 0.66 0.24 0.04 0.01 0.01 0.12Gerridae 0.04 0.02 0.05 0.20 0.34 1.14 0.49Leiognathidae 0.08 0.32 0.08 1.92 7.57 3.06Lactarius lactarius 0.04 0.26 0.09 0.10 0.83 0.45 0.36Lutianidae 9.60 5.28 1.64 0.65 0.17 0.70 2.50Mullidae 10.87 18.15 10.31 6.81 13.45 7.15 10.84Nemipterus spp. 4.02 2.09 7.63 7.30 4.04 5.23 4.85Pampus argenteus 0.98 0.42 0.14 0.16 0.38 0.36Pampus ch<strong>in</strong>ensis 0.02 0.03 0.01Parastromateus niger .. 0.46 0.21 0.03 0.05 0.02 0.10 0.13Pentapodidae .. 0.92 0.28 0.10 0.1I 0.07 0.09 0.21Pomadasys spp. 3.18 1.08 3.68 1.16 0.96 4.58 2.89Psettodes erumei 0.42 0.15 0.16 0.17 0.27 0.26 0.24Rachycentron canadus 0.37 0.26 0.22 0.37 0,07 0.17Rastrelliger spp. 0.28 0.5\ 0.24 0.0\ 0.1 \ 0.19 0.23Sciaenidae 3.97 2.14 0.55 0.67 4.02 0.97 1.92Scomberomoridae 0.43 0.22 0.12 0.09 0.27 0.09 0.18Swlapsis spp ... 0.29 0.26 0.57 0.36 0.30 0.50 0.40Serranidae 1.51 0.16 0.50 0.25 0.07 0.17 0.36Sphyraena spp. 0.\5 0.12 0.12 0.77 1.06 1.57 0.83Sillag<strong>in</strong>idae 0.01 0.0\Sparidae 0.\5 0.02 0.25 0.1I 0.10 0.09 0.1ISynodontidae .. 2.04 0.91 3.\0 5.5\ 2.56 3.62 2.87Tachysuridae 3.93 2.5\ 2.74 1.72 5.09 4.47 3.76Trichiuridae 0.08 0.07 0.49 0.05 1.93 0.35 0.53RayS 4.21 4.92 4.73 17.21 0.29 2.09 3.88Sharks .. 3.53 3.52 2.55 1.65 2.63 1.07 2.25Penaeidae 0.19 0.06 0.01 0.03 0.\0 0.06 0,07Brachyura 0.0\ 0.01 IThenus orientotis 0.08 0.13 0.14 0.09 0.03 0.08 0.09Loligoidea 4.43 1.66 0.~8 0.96 0.46 0.78 1.27,1Sepioidea 0.37 0.04 0.03 0.Q3 0.11 0.10 0.11Others .. 1.28 1.22 0.22 1.60 0.70 0.40 0.74 ' IAll commercial <strong>fish</strong> 77.58 57.66 49.06 55.79 48.23 59.44 57.66ITrash <strong>fish</strong> 22.42 42.34 50.94 44.21 51. 77 40.56 42.34Comh<strong>in</strong>ed groups 100.00 100.00 100.00 100.00 100.00 100.00 100.00
TABLE5AVERAGE CATCH RATES ACCORDING TO DEPTH ZONES, IRRESPECTIVEOF "PENYELIDlK I" OR "PENYELIDIK II"(Kilogramme / Hour)OverDepth Range (Metres) 10-20 21-30 31-40 41-50 51-60 60Number of hauls 14 69 85 80 21 23Fish Grollps-Anodontostoma chacllnda 59.18 19.96 0.77 0.11 0.52Abalistes stellaris 0.14 0.85 1.59 4.26 3.10 2.07Bothidae .. 0.58 0.16 0.33 0.22 0.03Carangidae · . 26.98 27.78 13.65 9.73 4.79 2.04Chirocentrus dorab 0.09 0.18 0.08 0.07 0.01 0.05Clupeidae · . 4.94 2.26 21.08 7.41Diagramma punctatum .. 0.41 0.75 1.94 1.07 4.11 3.23 iDrepane punctata 5.49 2.39 0.85 0.16 0.11 rDussumieria hasseltii 0.97 1.04 0.65 0.17 "Engraulidae 0.07 !Ephippus orbis 1.57 0.63 0.49 0.06 0.13 •,Gerridae .. 1.90 1.24 3.95 0.06 0.01 ILeiognathidae 13.25 30.18 5.70 1.08Lactarius lactarius 0.70 1.28 2.04 0.84 0.01Lutianidae 2.92 4.96 8.84 7.38 16.50 10.86Mullidae .. · . 32.11 21.36 57.38 33.29 23.88 4.67IINemipterus spp. · . 10.00 11.65 17.89 18.01 16.44 10.90Pampus argenteus 5.21 2.44 0.71 0.37 0.04 .'~ iPampus ch<strong>in</strong>ensis 0.13 0.06 I!!Parastromateus niger 0.21 0.78 0.52 0.23 0.05 0.15Pentapodidae'! ~· . 0.23 0.27 0.58 2.28 2.78Pomadasys spp. .. 8.57 23.31 3.74 6.11 6.85 0.44 I!'Psettodes erumei .. 2.14 0.60 0.96 0.70 0.31 0.32Rachycentron canadlls .. 1.76 0.09 0.15 1.04 0.51 0.72:IRastrelliger spp. .. 0.76 1.72 0.60 0.44 0.06 ,'ISciaenidae 3.91 7.96 11.35 1.99 0.80 1.74"Scomberomoridae 1.06 0.85 0.62 0.30 0.91 0.04Scolopsis spp. 0.15 1.03 1.42 2.17 0.27 0.03Serranidae 1.15 1.32 1.02 0.79 1.77Sphyraena spp. · . 1.57 4.99 1.85 3.03 0.25 0.05 i,Sillag<strong>in</strong>idae 0.01 0.04 .IiI'iSparidae 0.01 0.24 0.40 0.40 0.53 0.39 IiSynodontidae 7.50 5.34 10.23 12.99 9.79 3.55Tachysuridae 11.44 13.45 12.30 16.18 2.08 1.08Trichiuridae 20.59 0.90 1.14 0.52 0.15 0.09Rays 12.94 14.71 8.60 16.67 0.84 14.04Sharks 2.61 9.83 10.13 4.88 2.62 3.09Penaeidae 0.07 0.33 0040 0.09 0.01 0.09Brachyura om 0.01 0.02 0.01 0.01 0.03Thenus orientalis .. 0.01 0.36 0.30 0.38 0.04Loligoidea 3.57 2.90 5.01 4.51 4.47 2.13Sepioidea .. 0.49 0.47 0.53 0.18 0.08 0.01Others 1.34 3.36 2.23 1.77 0.67 3.93All commercial <strong>fish</strong> 247.28 223.79 212.03 160.55 104.09 70.29Trash <strong>fish</strong> 220.40 221.59 123.76 94.64 88.59 44.29Comb<strong>in</strong>ed groups 467.68 445.38 335.79 225.19 192.68 114.58M<strong>in</strong>imum 27.00 11.40 20.80 11.20 30.10 24.90Maximum 746.60 2721.70 3016.40 1957 10 1131.80 335.60
IIIIITABLE6PERCENTAGE CATCH BY WEIGHT ACCORDING TO DEPTH ZONES,1 IRRESPECTIVE OF "PENYELIDIK I" OR "PENYELIDIK II"! I'Over!I Depth Range (Metres) 10-20 21-30 31·40 41-50 51·60 60. Number of hauls 14 69 85 80 21 23Fish Groups~jAnodontostoma chacunda 12.65 4.48 0.23 0.04 0.27Abalistes stellaris 0.03 0.19 0.47 1.67 1.61 1.80IBothidae .. 0.12 0.04 0.10 0.09 0.02jCarangidae 5.77 6.24 4.07 3.81 2.48 1.78Chirocentrus dorab 0.02 0.04 0.02 0.03 0.01 0.051Clupeidae 1.06 0.51 6.28 2.90Diagramma punctatum 0.09 0.17 0.58 0.42 2.13 2.82II Drepane punctata 1.17 0.54 0.25 0.06 0.05Dussumieria hasse-Wi 0.21 0.23 0.19 0.Q7Engraulidae 0.03Ephippus orbis 0.34 0.14 0.15 0.02 0.Q7Gerridae .. 0.41 0.28 1.18 0.03Leiognathidae 2.83 6.78 1.70 0.42Lactarius lactarius 0.15 0.29 0.61 0.33IILutianidae 0.63 1.11 2.63 2.89 8.56 9.48Mullidae .. 6.87 4.80 17.09 13.05 12.40 4.08Nemipterus spp. 2.14 2.62 5.33 7.06 8.53 9.51Pampus argenteus 1.11 0.55 0.21 0.15 0.02Pampus ch<strong>in</strong>ensis 0.03 0.011'1Parastromateus niger 0.04 0.18 0.15 0.09 0.03 0.13~Pentapodidae 0.05 0.08 0.23 1.18 2.43Pomadasys spp. .. 1.83 5.23 1.11 2.40 3.56 0.38Psettodes erumei .. 0.46 0.13 0.29 0.28 0.16 0.28I; Rachycentron canadus 0.38 0.02 0.05 0.41 0.27 0.63Rastrelliger spp. .. 0.16 0.39 0.18 0.17 0.03Sciaenidae 0.84 1.79 3.38 0.78 0.41 1.51Scomberomoridae 0.23 0.19 0.19 0.12 0.47 0.04Scolopsis spp. 0.03 0.23 0.42 0.85 0.14 0.03Serranidae 0.26 0.39 0.40 0.41 1.55Sphyraena spp. 0.34 1.12 0.55 1.19 0.13 0.05Sillag<strong>in</strong>idae 0.02Sparidae .. 0.05 0.12 0.16 0.28 0.34SynodDntidae 1.60 1.20 3.05 5.09 5.08 3.10Tachysuridae 2.45 3.02 3.66 6.34 1.08 0.94Trichiuridae 4.40 0.20 0.34 0.20 0.08 0.08Rays 2.77 3.30 2.56 6.53 0.44 12.26Sharks 0.56 2.21 3.02 1.91 1.36 2.69Penaeidae 0.02 0.07 0.12 0.03 0.08Brachyura 0.01 0;01 0.02Thenus orientalis .. 0.08 0.09 0.15 0.02Loligoidea 0.76 0.65 1.49 1.77 2.32 1.86Sepioidea .. 0.10 0.11 0.16 0.07 0.04 omOthers 0.29 0.75 0.66 0.70 0.35 3.43All commercial <strong>fish</strong> 52.89 50.25 63.16 62.94 54.02 61.36Trash <strong>fish</strong> 47.11 49.75 34.84 37.06 45.98 38.64Comb<strong>in</strong>ed groups 100.00 100.00 100.00 100.00 100.00 100.0048
SOUTH CHINASEA_.,_._.-.;,'.r·I(' ._,' - '! ". -.1, _,,,..Fig. 1. The division of the survey region <strong>in</strong> Sarawak, Brunei and the west coast of Sabah<strong>in</strong>to sub-areas I-VI.
• ...J' ,/ -,.'.•• / " ••....• .7li.M .•"··.~·· ••__ ;~....... ,/ / r ~_ RESEARCH VESSI:C~ PENYE~iDt!i"·i-··""·"--· j' .' \13J ~~ RESEARCH VESSEL PENYELIDEK II /' \ 111 . 3et ~;1'~. 0 UNSUCCESSFUL HAUL FOR PENYELIDEK t / \ *12 7@ UNSUCCESSFUL HAUL FQR PENYELIDEK Ilf 14.j) ~.~................ '\ ~ ~./ .."".,,~:•••.•••. ,..- .••... [9-t:t.'\ /"') /,~---.......rf ( ....£5 ,/:'5 11;'iT 36/' 35 )i¢.~.~.·····"··,, .. ··( ), /~·· .._·j,6 16/19 / .:. ;"/ '\, I' i ~ ~/ lO@l'./i"'/ I • 34 "-,, .•33.....~ ,. i I' • ~ 1'1 i t- '.,- ~5 [", / '" / t -;[1- 3ill ')l4•••••••••...•.••••..~.~ SUS'AR'&" t...-/ 18..-- 'I) 8 -J. -I. 1'
~ RESEARCH VESSEL PENYEUDEK 1 ...~ RESEARCH VESSEL PENYELIDEK 11 /'"o UNSUCCESSFUl.. HAUL FOR PENYELIDEK t,/@ UNSUCCESSFUL HAUL FOR PENY.ELlDEK Ji'.- ,I.•..••.•/.. 52 ~ / •.......\ ....•.................../" '53 :::~ •./. 54SUB- ARE~ ...l1/ ?!-.,;.l'...~....... ~.•....•\. ,I •.•. ..•.:. ••••. 51 •.•... 55".......... 22-0 ,.. .... .......•.. t St. ..·····')... \52\ ~ 41 .•.•. / .' ./ ,/ ~ 63JSQM ....•..•.
63ft"~'~-~\..65'64 J-f ..•/;r:;:;~J;·t~:l-·,1................. '" ~ ~ ~ / ..90/T.• ZQN._ •...•.... -- ••~:/:///'O~~ '. . -... _. "'r{,7/t ':L! 76 "'/~-~:::~:"""""'84...... /._ -"..].3 , /.... .r.:}:' /~1....,... 75 --'815 ... :.... : :"t 71 l' .../. / ) 72 ~ •......, ./ ,•.......~sq~: ·........ .:" '. /!/ '\7-7 ~ 79·",,-- ! 76£ 70~ ;i" 7a. ?9. ~75 ./74......... /i (,"".68A ' .. It'67. 7~ 7~ ;' '\'73.1" I\:. '\ ...-'.66 ,\ i65!' · ·:]0 "1 ./.•.. •••.•. i ~67-» ./ ,J}68--» ~ j ...t~;'Ai9'\\66' ./~ ,....•./(
11!~............-.. RESEARCH VESSEL PENYELIDEK I...•• RESEARCH VESSEL PENYELIDEK IIo UNSUCCESSFUL HAUL FOR PENYELI DEK r@ UNSUCCESSFUL HAUL FOR PENYELIDEK 1ISU13- AREA IV ,-.~.,"::..::~:: ., ~~/~..•.\IIIIiji!•,IJ.I
0::.•... ::I:~w
~ Trash <strong>fish</strong>w~cr: 200:I:U~ Uw
C2:J:~UJ~0:::J:~5300UJ~0::UJ~21-30 31-40 41-50 51-60DEPTHZONES (METRES)Fig. 5. Average catch rates of the comb<strong>in</strong>ed groups of commercial and trash <strong>fish</strong>, accord<strong>in</strong>gto depth zones.
.r~Af.,"'"'." ........•...,SOM................•//CORAL BEDS. i 5~'-:STATIONS SHOWING CATCH IN KG/HFI. / ,/OF COMMERCIAL ,.·,{RASH FIS.~•.,~O~8JNED ••.···129). {' \ ../ , .'/, , .J .\~. ,J" 't, ~{~~•....... ".".. \ ./ ,.J_5_U_B_-A_R_E_,A_' _1 /~.~./...............~. ("--"\ ./ 1,22.' .~........... ./ \\··/ ::·~9··:1I·."""""·" .\ .....)IB'· q4.........•......117,140.4132.30.M. '" •........•\.151'9053Il
C ) PRODUCTIVEGROUNDS• • • CORAL BEDS /."' --:;:::: ................'\. 192/"'" .._ - ....•STATIONS SHOWING CATCH IN KG/HR SUB-AREA !II /,,/11 (OF COMMERCIAL & TRASH FISH CO~E[J'/··_ .._....•· ••···,·,'" .•.. "S.QM .. " .. _" .•-,.--- •.••... "".· .."""."" ...•.. /1.,·.// ..."" .../..............SUB - AREA-"I1'.. ',•....•...,/ i...•......•..•ti .• ",/.~.....•...~.....-.."'- ..~. "" ~4~ .102 ,/77 " ,;"" / '24./ ..·•..·•. ···76......
CJ113°) PRODUCTIVE GROUNDS.• • • CORAL BEDS.STATIONS SHOWING CATCH IN KG/HR.OF COMMERCIAL 8. TRASH FiSH COMBINED ......i..............•....... ".10M ../ - / _.-" l' .•.·- .....~~-,.~ SUS- AREA/If!• .,. .•..1••.•.•• -•••.•••.•••••••••~ •••••••.•••.•••• oI"'60 M. -.,~._ ..•-., ...-- .••,•.......-.>.. }'-"~SQ.f,L~ ./ ............. - ""..- ,... f'
C:>•••PROOUCnv~ GROUNDSCORAL BEDSSTATIONS SHOWING CATCH IN KGjHROF COMMERCIAL & TRASH FISH COMBINED.,.',.;./.r-..,/'.f ./. ..-/ ,.',.,/ .,/ t·····. ,//>,/..... ,":' ;i ) ~_~:.","\.•..,
c: ") PRODUCTIVE GROUNDS.• •• CORAL BEDS ...•..-" .....\STATIONS SHOWING CATCH lNOF COMMERCIAL & TRASH FISHCOMBINED.KG/HR...:'~. ~.:::