Collective Forest Tenure Reform under Village Democracy
Collective Forest Tenure Reform under Village Democracy
Collective Forest Tenure Reform under Village Democracy

You also want an ePaper? Increase the reach of your titles
YUMPU automatically turns print PDFs into web optimized ePapers that Google loves.
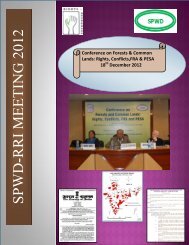
Conference on <strong>Forest</strong>s and Common LandsRights, Conflicts, FRA and PESA<strong>Collective</strong> <strong>Forest</strong> <strong>Tenure</strong> <strong>Reform</strong><strong>under</strong> <strong>Village</strong> <strong>Democracy</strong>Overview and Preliminary AnalysisJintao Xu, Peking UniversityDec 18, 2012, New Delhi, IndiaSPWD, RRI
Potential Impacts• <strong>Forest</strong> Management– Incentives for farmer and private sector investment– Better protection– Higher productivity– <strong>Forest</strong> policy reform– International supply chain• Farmer Livelihood– Income and income structure– Labor allocation– Capacity for investment• Social and Political Stability– Equity– Relationship between farmers and government– <strong>Village</strong> governance
Policy and Research QuestionsHow the reforms were conducted at County\Township\<strong>Village</strong> Level--Are farmer forest tenure stronger?--<strong>Reform</strong> conducted with due process?--Stakeholder attitude?What are the impacts?--Do farmers harvest them all?--Do farmers plant?--Are farmers better off directly?--Impacts on farmer labor allocation?--Impact on forestland market?--Impact on farmer social organization?--Impact on State <strong>Forest</strong> <strong>Reform</strong>?Needs for future policy and regulatory adjustment/reform?--<strong>Forest</strong> regulation reform? Logging quota?--Regulation on forestland transfer/market.--Regulation on farmer association.--Policy on farmer financing
<strong>Forest</strong> <strong>Tenure</strong> in China• Two ownership types• State• ~42% forest area and 68% volume;Managed by state forest enterprises and farms• <strong>Collective</strong>• 58% area and 32% volume• Growing share of timber production• Diversified management schemes
Two Rounds of <strong>Tenure</strong> <strong>Reform</strong>• First Round: 1981-1986– A fluctuating processin <strong>Collective</strong> <strong>Forest</strong>s– Different level of progresses among provinces– <strong>Tenure</strong> remains controversial Issue• Second Round: 2000-,– 2003-2007, 14 provinces announced new reform policy– In July 2008, Central Government <strong>Reform</strong> Policy wasdeclared, conclusion of the policy change process– By 2010, 20 provinces with reform policies
What’s New• Fujian• Local Initiatives to National Consolidation• “<strong>Village</strong> Autonomy”• Longer contract• Rich rights• <strong>Forest</strong> Certificates
Two Rounds of Repeated Surveys时 间 Time 省 份 Province 县 County 乡 Town 村 <strong>Village</strong> 农 户 HH2006.3-4 福 建 Fujian 12 36 72 7202006.5 江 西 Jiangxi 5 15 30 3002006.10-11 浙 江 Zhejiang 6 18 36 3602007.4 安 徽 Anhui 5 15 30 3002007.4 湖 南 Hunan 5 15 30 3002007.5-6 辽 宁 Liaoning 5 15 30 3002007.5-6 山 东 Shandong 5 15 30 3002007.8 云 南 Yunnan 6 12 30 600总 数 Total 49 141 288 3180
<strong>Forest</strong> Distribution in China
Changes in Share of Each <strong>Forest</strong> <strong>Tenure</strong> Type(Units: %)percent0 20 40 60 80 1004543442000315685020053212415120102159263200020104363834812005201080718420008071842005160607820100323922000100318682138620062010Progress of <strong>Reform</strong><strong>Tenure</strong> Share Change 2000-2010Fujian Jiangxi Zhejiang AnhuiIndividualNatural Cluster<strong>Collective</strong>PartnerOutsiderpercent0 20 40 60 80 100320491Changes in Share of Each <strong>Forest</strong> <strong>Tenure</strong> Type(Units: %)12049335238720002006201028219843231237557932061200020062010Hunan Liaoning Shandong YunnanIndividualNatural Cluster<strong>Collective</strong>459047397054344062200020062010PartnerOutsider80320609017470134151256200020062010
Annual Harvest by <strong>Village</strong>s (m3)500.00450.00400.00350.00300.00250.00200.00150.00100.0050.000.0089 107 107441198155 134 14111115156 48 685713 282000 2003 2005 2010 2000 2003 2005 2010 2000 2003 2005 2010 2000 2003 2006 2010FJ JX ZJ AHIndividual Partner Nat Vil Outsider <strong>Collective</strong>1400.001200.001000.00800.00600.00400.00200.000.001,17456 67 84 81 46 53 98 110 22 31 17 40 121 92 1782000 2003 2006 2010 2000 2003 2006 2010 2000 2003 2006 2010 2000 2003 2006 2010HN LN SD YNIndividual Partner Nat Vil Outsider <strong>Collective</strong>
Annual <strong>Forest</strong>ation by <strong>Village</strong>s (ha)25.0020.0015.0010.005.000.001612147 68 89 9724331 22000 2003 2005 2010 2000 2003 2005 2010 2000 2003 2005 2010 2000 2003 2006 2010FJ JX ZJ AHIndividual Partner Nat Vil Outsider <strong>Collective</strong>160.00140.00120.00100.0080.0060.0040.0020.000.0058691 9 5 61829 25 3443161 3 2 12000 2003 2006 2010 2000 2003 2006 2010 2000 2003 2006 2010 2000 2003 2006 2010HN LN SD YNIndividual Partner Nat Vil Outsider <strong>Collective</strong>
Income Structure Change 2000-2010Breakdown Anuual Income per Captia by Sources(Unit: %)(%)0 20 40 60 80 100578791113133938 344652557770233235333337307238161397635491191110121117 1531454241464546514557521358313033263934 35372728181915114 46 5736713373966235125253 42000 2005 2010 2000 20052010 20002005 2010 20002005 2010 2000 2005 2010 2000 2005 2010 2000 20052010 20002005 2010FJ JX ZJ AH HN LN SD YN<strong>Forest</strong>AgricultureNon-agricultureOthers7242643
Results from Preliminary Analyses• <strong>Tenure</strong> Choice– Dominated by rural governance structure• Afforestation– <strong>Reform</strong> increased forestation area by 8%• Labor Allocation– Safety net effect for better educated farmers– Labor tying effect for ordinary farmers– Enhance self-employment15
Thanks !
<strong>Tenure</strong> Share Change (2000-2010)(village average, ha)1800.001600.001400.001200.001000.00800.00600.00400.00200.000.002000 2006 2010 2000 2006 2010 2000 2006 2010 2000 2006 2010 2000 2006 2010 2000 2006 2010 2000 2006 2010 2000 2006 2010FJ JX ZJ AH HN LN SD YNIndividual Partner Nat Vil Outsider <strong>Collective</strong>
Rural p.c. Income Change 2000-20100 10,000 20,000 30,000 40,000674Breakdown of Annual Income Per Captia by Sources(Units:RMB)FJ JX ZJ Anhui Hunan LN SD YN2000 2005 2010 2000 2005 2010 2000 2005 2010 2000 2005 2010 2000 2005 2010 2000 2005 2010 2000 2005 2010 2000 2005 2010179259531737436647595494 29323055 391125326853713873264218810505919415716071610 22630841913532437924311486693949961381 30751134673627517783182148641491108496056443662665207<strong>Forest</strong>1474No-agriculture111949863322387314185141804661675261503121687900AgricultureOthers2592966744905338116749793599377732162310497137842721407709635063625077902239992641572695883103621539739074762142112891357943323135595779