Volume of Distribution Prediction: Physiologically Based ...
Volume of Distribution Prediction: Physiologically Based ...
Volume of Distribution Prediction: Physiologically Based ...

Create successful ePaper yourself
Turn your PDF publications into a flip-book with our unique Google optimized e-Paper software.
AAPS<strong>Volume</strong> <strong>of</strong> <strong>Distribution</strong> <strong>Prediction</strong>:<strong>Physiologically</strong> <strong>Based</strong> MethodologiesPatrick PoulinConsultant, Québec city, CanadaLos Angeles - November 11, 2009patrick-poulin@videotron.ca P. Poulin. April, 2007.<strong>Distribution</strong> <strong>Prediction</strong> AAPS – November 11, 2009
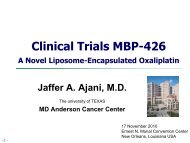
Number <strong>of</strong> Publicationpatrick-poulin@videotron.ca P. Poulin. April, 2007.<strong>Distribution</strong> <strong>Prediction</strong> AAPS – November 11, 2009Publications on Tissue <strong>Distribution</strong> <strong>Prediction</strong>A Shift from Environmental to Pharmaceutical Sciences3025Publications (1970-2009)EnvironmentalToxicologyPharmaceuticalContribution (1970-2009)Others20Sawada et al.15Abraham et al.Poulin, Krishnan, Theil10Lombardo et al.5Rowland et al.01970-1999 2000-2009Year
patrick-poulin@videotron.ca P. Poulin. April, 2007.<strong>Distribution</strong> <strong>Prediction</strong> AAPS – November 11, 2009AAPSOutline1<strong>Distribution</strong> Parameters: Introduction234<strong>Physiologically</strong>-<strong>Based</strong> <strong>Prediction</strong>:Presenting the methodsCross-Validation ExercisesFurther Developments5 Conclusion6 Acknowledgements and References
patrick-poulin@videotron.ca P. Poulin. April, 2007.<strong>Distribution</strong> <strong>Prediction</strong> AAPS – November 11, 2009AAPS1. <strong>Distribution</strong> Parameters: Introduction
patrick-poulin@videotron.ca P. Poulin. April, 2007.<strong>Distribution</strong> <strong>Prediction</strong> AAPS – November 11, 2009<strong>Distribution</strong><strong>Distribution</strong>The distribution <strong>of</strong> xenobiotics inthe body after their absorptionExtent <strong>of</strong> <strong>Distribution</strong>Determined by:• partitioning across various membranes.• non-specific binding to tissue components.• specific binding to proteins.• physiological volumes.
patrick-poulin@videotron.ca P. Poulin. April, 2007.<strong>Distribution</strong> <strong>Prediction</strong> AAPS – November 11, 2009<strong>Distribution</strong> Parameters EstimationMETHOD XMETHOD YKpEssential inputParameters <strong>of</strong>PBPK modelsTissue<strong>Volume</strong>sVdssVdssVdss = volume <strong>of</strong> distribution at steady-stateKp = tissue:plasma (blood) ratios at steady-state
patrick-poulin@videotron.ca P. Poulin. April, 2007.<strong>Distribution</strong> <strong>Prediction</strong> AAPS – November 11, 2009<strong>Distribution</strong> Parameters:How can we estimated it?In vivo StudiesBolus: Statistical momenttheory (Vdss)Infusion: measurement inanimal tissues (Kp)<strong>Prediction</strong> MethodsDiverse correlationsAlgorithms"Hybrid" models<strong>Prediction</strong>: knowing Vdss earlier would reduce time, cost and animals.<strong>Physiologically</strong>-based prediction: knowing that we may lackknowledge to facilitate more rationale decisions.
patrick-poulin@videotron.ca P. Poulin. April, 2007.<strong>Distribution</strong> <strong>Prediction</strong> AAPS – November 11, 2009AAPS2. <strong>Physiologically</strong>-<strong>Based</strong> <strong>Prediction</strong>:Presenting the methods
patrick-poulin@videotron.ca P. Poulin. April, 2007.<strong>Distribution</strong> <strong>Prediction</strong> AAPS – November 11, 2009First Mechanistic/Physiological<strong>Prediction</strong> method <strong>of</strong> <strong>Distribution</strong>Volatile Organic Chemicals (VOCs) in the EnvironmentMETHOD YNeutral VOCsLipophilicityNeutral lipidsKp(tissue:air PC)
patrick-poulin@videotron.ca P. Poulin. April, 2007.<strong>Distribution</strong> <strong>Prediction</strong> AAPS – November 11, 2009Starting Point <strong>of</strong> Tissue CompositionModels (TC) – Reconstituting the tissueExperimental work <strong>of</strong> Lowe & Hagler, 1969 for VOCs:Triglyceride:air PCTissuecomponentsCholesterol:air PCPhospholipid:air PCWater:air PCKp ( tissue:air)PC : air * VcComponentvolume fractions
patrick-poulin@videotron.ca P. Poulin. April, 2007.<strong>Distribution</strong> <strong>Prediction</strong> AAPS – November 11, 2009In-vitro <strong>Distribution</strong> <strong>of</strong> Neutral VOCsSupporting the Concept <strong>of</strong> Lowe & HaglerPoulin and Krishnan & de Jongh et al.
patrick-poulin@videotron.ca P. Poulin. April, 2007.<strong>Distribution</strong> <strong>Prediction</strong> AAPS – November 11, 2009Predicting <strong>Distribution</strong> for DrugsNeutral VOCsBasesacidic phospholipids,cation transportersAcids, Neutralsalbumin, lipoproteinsIonizationPlasma proteinsbindingDrugs
patrick-poulin@videotron.ca P. Poulin. April, 2007.<strong>Distribution</strong> <strong>Prediction</strong> AAPS – November 11, 2009Existing <strong>Prediction</strong> methods <strong>of</strong> Kpand/or Vdss based on PhysiologyTissue compositionmodels/algorithmsAll in vitro-basedLowe and HaglerPaterson and MackayPoulin et alBerezhkovskiyRodgers & RowlandGastroPlus®Correlation-HybridmodelsPoulin & Theil (in vitro-based)Bjorkman (in vivo-based)Janssen et al (in vivo-based)Arundel modelAstra Zeneca (in vivo-based)Oie-Tozer modelLombardo et al (in vitro-based)
patrick-poulin@videotron.ca P. Poulin. April, 2007.<strong>Distribution</strong> <strong>Prediction</strong> AAPS – November 11, 2009<strong>Prediction</strong> Methods <strong>of</strong> Kp (Vdss)PrincipleDrug-SpecificInputsTISSUECOMPOSITION (TC)- Kp’s were calculated as the ratio<strong>of</strong> the sum <strong>of</strong> free and bound drug(i.e., nonspecific & specific) in tissuecomponents (intracellular &interstitial spaces) to that in plasma.- Lipophilicity (Log P, Log D)- Plasma proteins binding (fup)- Blood:plasma ratioARUNDEL- Kp’s were calculated from therelationships between Vdss anddisappearance rate constantsobserved in 5 groups <strong>of</strong> tissues.- Lipophilicity (Log D)- Plasma proteins binding (fup)- Rat Vdss in vivoData - In vitro based (All classes <strong>of</strong> drugs) - In vivo based (All classes <strong>of</strong> drugs)Number <strong>of</strong>publishedversions- 4 (Poulin, Krishnan & Theil, 1995-2002)(Rodgers & Rowland, 2007) (GastroPlus®)- 1 (Astrazeneca, 1997)
patrick-poulin@videotron.ca P. Poulin. April, 2007.<strong>Distribution</strong> <strong>Prediction</strong> AAPS – November 11, 2009<strong>Prediction</strong> Methods <strong>of</strong> Kp (Vdss)CORRELATIONSHYBRIDS &OIE TOZERPrincipleDrug-SpecificInputs- Kp’s were predicted with correlations.- Kp muscle is correlated with Kp <strong>of</strong>other lean tissues for in vivo data.- Kp fat is correlated with Kp muscleadjusted for lipophilicity.- Kp in vivo <strong>of</strong> muscle- Rat Vdss in vivo- Lipophilicity (log P)- Kp’s were predicted with correlations.- Kp <strong>of</strong> lean tissues and fat (or Vdss)are correlated with in vitro data(blood:plasma PC or physicochem.).- Some Relations with Physiology.- Lipophilicity (Log p)- Plasma proteins binding (fup)- Blood:Plasma ratioData - In vivo based (All classes <strong>of</strong> drugs) - In vitro based (Basic drugs only)Number <strong>of</strong>publishedversions- 3 (Poulin & Theil 2000) (Bjorkman 2004)(Janssen et al. 2008)- 3 (Poulin & Theil 2009 A,B)(Lombardo 2004)
patrick-poulin@videotron.ca P. Poulin. April, 2007.<strong>Distribution</strong> <strong>Prediction</strong> AAPS – November 11, 2009AAPS3. Cross-Validation Exercises
patrick-poulin@videotron.ca P. Poulin. April, 2007.<strong>Distribution</strong> <strong>Prediction</strong> AAPS – November 11, 2009Validation <strong>of</strong> <strong>Prediction</strong> Methods <strong>of</strong> VdssValidation Articles and InitiativeRodgers & RowlandDe Buck et al. (2007)Pharm. Res. (24):918 ; DMD (35):649Janssen et al.(2008)J. Pharm. Sci. (97):2324Poulin & Theil(2009)J. Pharm. Sci. (98):4941PhRMAInitiative2007-2010Two tissuecompositionmodelsOnecorrelationmodelSixIn vitro- based &hybrid modelsNineteentypes <strong>of</strong>model142 drugs22 drugs61 drugs108 drugsValidation with Diverse Datasets:Rat and/or Human Vdss (Kp)
patrick-poulin@videotron.ca P. Poulin. April, 2007.<strong>Distribution</strong> <strong>Prediction</strong> AAPS – November 11, 2009Validation <strong>of</strong> <strong>Prediction</strong> Methods <strong>of</strong> VdssCurrent initiative <strong>of</strong> PhRMA/PISC on Predictive ModelsMain focus is on the predictability <strong>of</strong> human PK based on preclinical data usinga novel and blinded dataset (n=108 drugs).First head-to-head evaluation <strong>of</strong> models. Publications expected in 2010.PART 1Allometry & OthersCalculation MethodAllometric Wajima(Dedrick)PART 2<strong>Physiologically</strong><strong>Based</strong> (PBPK)Assessment <strong>of</strong> several methodsused for predicting parameters<strong>of</strong> ADME (Vdss, CL, AUC, F).Direct validation <strong>of</strong> 19 differentprediction methods <strong>of</strong> human Vdss(mechanistic vs. empirical)Assessment <strong>of</strong> several methods used forpredicting plasma concentration-time pr<strong>of</strong>ilesby integrating predicted ADME parametersobtained from Part 1.Indirect validation <strong>of</strong> predictionmethods <strong>of</strong> Vdss
Additional Validation <strong>of</strong> this StudyCROSS-VALIDATION OF ALL DISTRIBUTION MODELSPREDICTION METHODSIN VITRO-BASED MODELSTC1 : Poulin & Theil (2002)TC2 : Berezhkovskiy (2004)TC3 : Rodgers & Rowland (2007)TC4 : GastroPlus®Oie-Tozer : Lombardo (2004)Correlation-Hybrid : Poulin & Theil (2009)IN VIVO-BASED MODELSArundel : Astrazeneca (1997)Correlation : Janssen et al. (2008)Literature-based dataThree datasets:A. 39 drugsB. 61 drugsC. 64 drugsLog P (-0.09 to 5)fup: 0.009 to 1pKa 2 to 11ALLOMETRYSA : bound and unbound drugsHuman VdssRat Kp’spatrick-poulin@videotron.ca P. Poulin. April, 2007.<strong>Distribution</strong> <strong>Prediction</strong> AAPS – November 11, 2009
patrick-poulin@videotron.ca P. Poulin. April, 2007.<strong>Distribution</strong> <strong>Prediction</strong> AAPS – November 11, 2009Reported Predictive Performance for Kp and Vdssusing diverse Datasets and Methods% Within 2-FoldError Window100%Rat Kp’s*81%Rat Vdss85%Human Vdss94%50%39%35%14%0%* : 13 tissues
% WITHIN 2-FOLD ERRORPredictive Performance in HumanIn vitro & In vivo models - Dataset on Vdss <strong>of</strong> 39 drugsHuman Vdss100STRONG ACIDS ALL & NEUTRALS DRUGS BASES (n=39) (n=16) (n=23)755025 250TC1 (Poulin)TC1 (Poulin)TC3 (Rodgers)TC3 (Rodgers)TC4 (GastroPlus)TC1 (Poulin, 2002)TC2 (Berezhkovskiy)TC3 (Rodgers)TC2 (Berezhkovskiy)TC2 (Berezhkovskiy)Oie-Tozer (Lombardo)TC4 (GastroPlus)Correlation (Janssen)Arundel (AZ)Correlation (Janssen)Arundel (AZ)Correlation (Janssen)Arundel (AZ)TC4 (GastroPlus)Hybrid (Poulin, 2009)
patrick-poulin@videotron.ca P. Poulin. April, 2007.<strong>Distribution</strong> <strong>Prediction</strong> AAPS – November 11, 2009Predictive Performance in HumanIn vitro models - Dataset on Vdss <strong>of</strong> 61 Basic drugsHuman VdssPERCENTAGE WITHIN 2 FOLD-ERRORHybrid (Poulin)10080Oie-Tozer (Lombardo)6040200TC1 (Poulin)TC4 (GastroPlus)TC2 (Berezhkovskiy)TC3 (Rodgers)Poulin and Theil, 2009AB, JPS(A:accepted, B:submitted)
% WITHIN 2-FOLD ERRORpatrick-poulin@videotron.ca P. Poulin. April, 2007.<strong>Distribution</strong> <strong>Prediction</strong> AAPS – November 11, 2009Predictive Performance in RatIn vitro & In vivo models - Dataset on rat Kp’s <strong>of</strong> 64 drugsChoosing the more accurate method for each class <strong>of</strong> drugsRat Kp’s (13 tissues) (n=600)1007550TC1 (Poulin)TC3 (Rodgers)TC4 (GastroPlus)Correlation (Janssen)250Neutrals Acids Bases Zwiterions
patrick-poulin@videotron.ca P. Poulin. April, 2007.<strong>Distribution</strong> <strong>Prediction</strong> AAPS – November 11, 2009PHYSIOLOGY VS ALLOMETRYHuman Vdss% Within 2-FoldError Window100%PHYSIOLOGICALIN VITRO-BASED94%25 DRUGS OUF OF THOSE THREE DATASETSIN VIVO-BASED85%COMMON EMPIRICAL75%ALLOMETRY(SA BOUND & UNBOUND DRUGS)*65%50%30%33%*Rat, dog + mouse and/or monkey0%
patrick-poulin@videotron.ca P. Poulin. April, 2007.<strong>Distribution</strong> <strong>Prediction</strong> AAPS – November 11, 2009AAPS4. Further Developments
patrick-poulin@videotron.ca P. Poulin. April, 2007.<strong>Distribution</strong> <strong>Prediction</strong> AAPS – November 11, 2009Unified Algorithm for Predicting PartitionCoefficients (PCs) (Kp)Environmental Chemicals and DrugsThe objective was to develop a unified algorithm such that the PCsfor both drugs and environmental chemicals could be predicted.PCs were calculated as the ratio <strong>of</strong> the sum <strong>of</strong> free and bound chemical(i.e., nonspecific and specific) in tissue components (intracellular &interstitial spaces) to that in blood (plasma & erythrocyte).A total <strong>of</strong> 455 PCs (muscle, liver, fat) were calculated for several classes<strong>of</strong> drugs (n=68) and environmental chemicals (n=80).The level <strong>of</strong> prediction accuracy is identical to that <strong>of</strong> the previouslypublished algorithms for specific sub-set <strong>of</strong> drugs or chemicals.First attempt towards the computation <strong>of</strong> macro and micro level PCs fordeveloping organ and cellular-based PBPK models for diverse molecules.
patrick-poulin@videotron.ca P. Poulin. April, 2007.<strong>Distribution</strong> <strong>Prediction</strong> AAPS – November 11, 2009Comparison <strong>of</strong> <strong>Prediction</strong> Methods <strong>of</strong> <strong>Distribution</strong>Peyret T, Poulin P, Krishnan K. Toxicological Sciences (2010)MECHANISTICEQUATIONSENVIRONMENTAL CHEMICAL PCsPHARMACEUTICAL PCsTISSUE:AIR BLOOD:AIR BLOOD:AIR TISSUE:BLOOD TISSUE:PLASMA UNBOUNDALL VOCsLIPOPHILICVOCsHYDROPHILICVOCsPoulin & Krishnan (1996) A X X X XCONTAMINANTS BASES ACIDS, NEUTRALS,ZWITERRIONSHaddad et al. (2000) BXPoulin & Theil (2002) C X X XRodgers et al. (2005) DXRodgers & Rowland (2006) EXSchmitt (2008) F X XSUGGESTED UNIFIEDALGORITHMX X X X X XA: Toxicol Appl Pharmacol 136: 126-130 and 131-137.B: Chemosphere 40: 839-843..C: J Pharm Sci 91:129-156.D: Pharm Res 24:918-933.E: J Pharm Sci 95:1238-1249.F: Toxicol In Vitro 22: 457-67
Estimating Drug Permeation Limitation forTissue Partition Coefficients (PCs) (Kp)• There is an evident lack <strong>of</strong> tools to predict tissuepermeation for drugs in PBPK models.• Must always optimize permeability-area product.• Challenges:– <strong>Prediction</strong>s from physicochemical properties.– <strong>Prediction</strong>s from in vitro data.– Estimating tissue area subjected to exposure.Hantash J, Millipore (St. Charles, MO)Haddad S, Université du Québec à Montréal (Montréal, Canada)patrick-poulin@videotron.ca P. Poulin. April, 2007.<strong>Distribution</strong> <strong>Prediction</strong> AAPS – November 11, 2009
Cell permeability (cm/s)Cell permeability (cm/s)Estimating Drug Permeation Limitation forTissue Partition Coefficients (PCs) (Kp)PAMPACellsbased1000MDCK100CACO21001010.10.011.E-06 1.E-04 1.E-02 1.E+00 1.E+02PAMPA permeability (cm/s)1010.10.010.0011.E-06 1.E-04 1.E-02 1.E+00 1.E+02PAMPA permeability (cm/s)• A dataset <strong>of</strong> 67 compounds is investigated (acids, bases, neutrals)• 7 types <strong>of</strong> tissue are studied• Outliers –> identified as actively transported compoundsHantash J, Millipore (St. Charles, MO)Haddad S, Université du Québec à Montréal (Montréal, Canada)
patrick-poulin@videotron.ca P. Poulin. April, 2007.<strong>Distribution</strong> <strong>Prediction</strong> AAPS – November 11, 2009AAPS5. Conclusion
patrick-poulin@videotron.ca P. Poulin. April, 2007.<strong>Distribution</strong> <strong>Prediction</strong> AAPS – November 11, 2009Conclusion<strong>Prediction</strong> <strong>of</strong> <strong>Distribution</strong>Several in vitro and in vivo based models are availablein the literature only for rat and human.In vitro models may provide similar degree <strong>of</strong> predictionaccuracy compared to in vivo-based models and allometry.There is a need to come up with generic models morepredictive since no models were perfect with all classes <strong>of</strong>drugs and all parameters (Vdss, Kp).Main inaccuracies were observed for zwitterions.Drug permeation limitation and transports are not yetaccounted for in prediction models <strong>of</strong> distribution.
patrick-poulin@videotron.ca P. Poulin. April, 2007.<strong>Distribution</strong> <strong>Prediction</strong> AAPS – November 11, 2009AAPS6. AcknowledgementsNamesInstitutionsDr. Zhang Hua LillianDr. Jennifer ShengDr. Michael HagemanPhRMA membersPr<strong>of</strong>. Kannan KrishnanThomas PeyretPr<strong>of</strong>. Sami HaddadFDA, Washington DCAstrazeneca, USABMS, USAPhRMA, Washington DCUniversité de MontréalUniversité de MontréalUQAM, MontréalDr. Thierry LavéH<strong>of</strong>fmann-La Roche, BaselDr. Frank-P Theil Genentech, San FranciscoThank you!
ReferencesPoulin P, Theil FP. 2002. <strong>Prediction</strong> <strong>of</strong> pharmacokinetics prior to in vivo studies: 1. Mechanism-based prediction <strong>of</strong>volume <strong>of</strong> distribution. J Pharm Sci 91:129-156.Poulin P, Theil FP. 2009A. Development <strong>of</strong> a novel method for predicting volume <strong>of</strong> distribution at steady-state <strong>of</strong>basic drugs and comparative assessment with existing methods. J Pharm Sci 98:4941-4961.Poulin P, Theil FP. 2009B. Follow up <strong>of</strong> a novel correlation method used to predict volume <strong>of</strong> distribution atsteady-state. J Pharm Sci (October, submitted).Berezhkovskiy LM. 2004. <strong>Volume</strong> <strong>of</strong> distribution at steady-state for a linear pharmacokinetic system withperipheral elimination. J Pharm Sci 93:1628-1640.Rodgers T, Leahy D, Rowland M. 2005. <strong>Physiologically</strong> based pharmacokinetic modeling 1: Predicting the tissuedistribution <strong>of</strong> moderate-to-strong bases. J Pharm Sci 94:1259-1267.Rodgers T, Rowland M. 2007. Mechanistic approaches to volume <strong>of</strong> distribution predictions: Understanding theprocesses. Pharm Res 24:918-933.Lombardo F. 2004. <strong>Prediction</strong> <strong>of</strong> volume <strong>of</strong> distribution values in human for neutral and basic drugs usingphysicochemcal measurements and plasma protein binding data. J Med Chem 47:1243-1250.Jansson R, Bredberg U, Ashton M. 2008. <strong>Prediction</strong> <strong>of</strong> drug tissue to plasma concentration ratios using ameasured volume <strong>of</strong> distribution in combination with lipophilicity. J Pharm Sci 97:2324-2339.Bjorkman S. 2002. <strong>Prediction</strong> <strong>of</strong> the volume <strong>of</strong> distribution <strong>of</strong> a drug: which tissue-plasma partition coefficients areneeded? J Pharm Pharmacol 54: 237-245.GastroPlus®. www.simulationplus.com. Lancaster California.Lowe HJ and Hagler K. 1969. Determination <strong>of</strong> volatile organic anesthetics in blood, gases, tissues and lipids:partition coefficients. In: Porter R, ed. Gas chromatography in biology and medicine. A Ciba-GeigyFoundation Symposium. Chruchill, New York. Pp. 86-103.Arundel PA. 1997. A multi-compartmental model generally applicable to physiologically-based pharmacokinetics.(Astra-Zeneca, UK). Poster presentation during the third IFAC symposium. Modeling and control inbiomathematical systems. University <strong>of</strong> Warwick, UK, 23–26 March.Paterson S, and Mackay D. 1989. Correlation <strong>of</strong> tissue, blood and air partition coefficients <strong>of</strong> volatile organicchemicals. Brit. J. Ind. Med. 46: 321-328.