Journal of European Integration History – Revue d'histoire de l'
Journal of European Integration History – Revue d'histoire de l' Journal of European Integration History – Revue d'histoire de l'
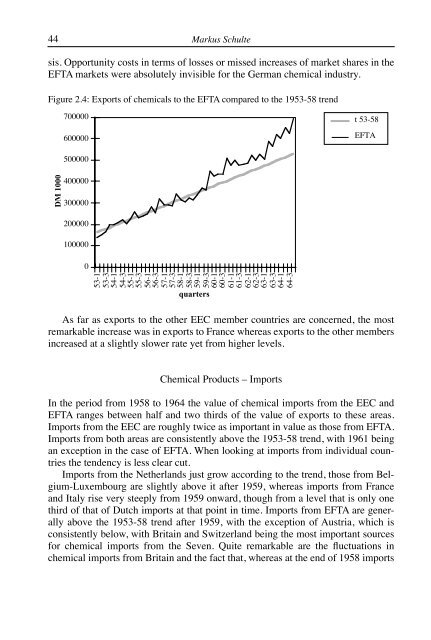
44Markus Schultesis. Opportunity costs in terms of losses or missed increases of market shares in theEFTA markets were absolutely invisible for the German chemical industry.Figure 2.4: Exports of chemicals to the EFTA compared to the 1953-58 trend700000600000t 53-58EFTA500000DM 1000400000300000200000100000053-153-354-154-355-155-356-156-357-157-358-158-359-159-360-160-361-161-362-162-363-163-364-164-3quartersAs far as exports to the other EEC member countries are concerned, the mostremarkable increase was in exports to France whereas exports to the other membersincreased at a slightly slower rate yet from higher levels.Chemical Products – ImportsIn the period from 1958 to 1964 the value of chemical imports from the EEC andEFTA ranges between half and two thirds of the value of exports to these areas.Imports from the EEC are roughly twice as important in value as those from EFTA.Imports from both areas are consistently above the 1953-58 trend, with 1961 beingan exception in the case of EFTA. When looking at imports from individual countriesthe tendency is less clear cut.Imports from the Netherlands just grow according to the trend, those from Belgium-Luxembourgare slightly above it after 1959, whereas imports from Franceand Italy rise very steeply from 1959 onward, though from a level that is only onethird of that of Dutch imports at that point in time. Imports from EFTA are generallyabove the 1953-58 trend after 1959, with the exception of Austria, which isconsistently below, with Britain and Switzerland being the most important sourcesfor chemical imports from the Seven. Quite remarkable are the fluctuations inchemical imports from Britain and the fact that, whereas at the end of 1958 imports
Industrial Interest in West Germany´s Decision 45from Britain were still more than twice those from France or Italy, within two yearsimports from France surpassed British imports and Italian imports assumed a valuesimilar to those from Britain in the same time-span.Machinery – ExportsAfter the Second World War the machinery sector ranked among the most successfulGerman industries and had nothing to fear but everything to gain from either theEurope-wide free trade area or the accession and association of the EFTA membersto the EEC. When in 1964 imports from the EEC and EFTA together reach theirhighest point during the period that is analysed here, they still only make up a thirdof the value of German machinery exports to these markets, which demonstratesthe dominating position of German industry in Western Europe in this field. Howeverduring a period from the beginning of 1958 to mid-1961 German machineryexports to the EEC and EFTA visibly fall and remain below their 1953-58 trend,while they afterwards pick up again and remain consistently above the trend for therest of the period.The deviation from the trend for export to EFTA is less pronounced than forexports to the other EEC partners.The values of exports to EFTA remain at a level which is roughly 20% lowerthan the one for exports to the EEC in the early 1960s. With the exception of Austria,exports to EFTA are well above the 1953-58 trend for all other members of theSeven with the most pronounced increases in exports to Britain and Switzerland.With exports to the Netherlands and to Belgium-Luxembourg stagnating throughout1958 and 1959 and rising only slightly above the trend afterwards, France andItaly become the most important export markets for the German machinery industryfrom 1960 onward, with a particularly steep increase of exports to Italy.Thus quite similar to the exports of chemical products, there is no visible differenceat all between the EEC and EFTA as far as the changes in growth rates areconcerned, suggesting that exports to the EFTA market not only were unhampered,but entirely unaffected by both arrangements, whereas the lowering of internal tariffsand quantitative restrictions within the EEC had a strong impact on exports toFrance and Italy, but hardly affected those to the already relatively open markets ofthe Netherlands and Belgium-Luxembourg.Machinery – ImportsMachinery imports from all important European markets except Switzerland aremarkedly above the 1953-58 trend after 1959, whereas the values for Switzerlandclosely follow the trend-line. Values of imports from both EFTA and the EEC reacha very similar level at the end of the period. The graphs could suggest that importsfrom the other EEC partners, after starting off from a very low level and rising only
- Page 6: 4Introductory note - Introduction -
- Page 9 and 10: Dieses Dokument wurde erstellt mit
- Page 11 and 12: Challenge to the Community 91961. T
- Page 13 and 14: Challenge to the Community 11cellor
- Page 15 and 16: Challenge to the Community 13widesp
- Page 17 and 18: Challenge to the Community 15about
- Page 19 and 20: Challenge to the Community 17undoub
- Page 21 and 22: Challenge to the Community 19period
- Page 23 and 24: Challenge to the Community 21concer
- Page 25 and 26: Challenge to the Community 23partia
- Page 27 and 28: Challenge to the Community 25of-pay
- Page 29 and 30: Challenge to the Community 27ment b
- Page 31 and 32: Challenge to the Community 29With r
- Page 33 and 34: Challenge to the Community 31The Au
- Page 35 and 36: Challenge to the Community 33nauer
- Page 37 and 38: Dieses Dokument wurde erstellt mit
- Page 39 and 40: Industrial Interest in West Germany
- Page 41 and 42: Industrial Interest in West Germany
- Page 43 and 44: Industrial Interest in West Germany
- Page 45: Industrial Interest in West Germany
- Page 49 and 50: Industrial Interest in West Germany
- Page 51 and 52: Industrial Interest in West Germany
- Page 53 and 54: Industrial Interest in West Germany
- Page 55 and 56: Industrial Interest in West Germany
- Page 57 and 58: Industrial Interest in West Germany
- Page 59 and 60: Industrial Interest in West Germany
- Page 61 and 62: Industrial Interest in West Germany
- Page 63 and 64: Industrial Interest in West Germany
- Page 65 and 66: Dieses Dokument wurde erstellt mit
- Page 67 and 68: Swedish Neutrality, the Finland Arg
- Page 69 and 70: Swedish Neutrality, the Finland Arg
- Page 71 and 72: Swedish Neutrality, the Finland Arg
- Page 73 and 74: Swedish Neutrality, the Finland Arg
- Page 75 and 76: Swedish Neutrality, the Finland Arg
- Page 77 and 78: Swedish Neutrality, the Finland Arg
- Page 79 and 80: Swedish Neutrality, the Finland Arg
- Page 81 and 82: Swedish Neutrality, the Finland Arg
- Page 83 and 84: Dieses Dokument wurde erstellt mit
- Page 85 and 86: The Diplomacy of ‘dignified calm
- Page 87 and 88: The Diplomacy of ‘dignified calm
- Page 89 and 90: The Diplomacy of ‘dignified calm
- Page 91 and 92: The Diplomacy of ‘dignified calm
- Page 93 and 94: The Diplomacy of ‘dignified calm
- Page 95 and 96: The Diplomacy of ‘dignified calm
44Markus Schultesis. Opportunity costs in terms <strong>of</strong> losses or missed increases <strong>of</strong> market shares in theEFTA markets were absolutely invisible for the German chemical industry.Figure 2.4: Exports <strong>of</strong> chemicals to the EFTA compared to the 1953-58 trend700000600000t 53-58EFTA500000DM 1000400000300000200000100000053-153-354-154-355-155-356-156-357-157-358-158-359-159-360-160-361-161-362-162-363-163-364-164-3quartersAs far as exports to the other EEC member countries are concerned, the mostremarkable increase was in exports to France whereas exports to the other membersincreased at a slightly slower rate yet from higher levels.Chemical Products <strong>–</strong> ImportsIn the period from 1958 to 1964 the value <strong>of</strong> chemical imports from the EEC andEFTA ranges between half and two thirds <strong>of</strong> the value <strong>of</strong> exports to these areas.Imports from the EEC are roughly twice as important in value as those from EFTA.Imports from both areas are consistently above the 1953-58 trend, with 1961 beingan exception in the case <strong>of</strong> EFTA. When looking at imports from individual countriesthe ten<strong>de</strong>ncy is less clear cut.Imports from the Netherlands just grow according to the trend, those from Belgium-Luxembourgare slightly above it after 1959, whereas imports from Franceand Italy rise very steeply from 1959 onward, though from a level that is only onethird <strong>of</strong> that <strong>of</strong> Dutch imports at that point in time. Imports from EFTA are generallyabove the 1953-58 trend after 1959, with the exception <strong>of</strong> Austria, which isconsistently below, with Britain and Switzerland being the most important sourcesfor chemical imports from the Seven. Quite remarkable are the fluctuations inchemical imports from Britain and the fact that, whereas at the end <strong>of</strong> 1958 imports


