Instruments and Methods Geophysical imaging of alpine rock glaciers
Instruments and Methods Geophysical imaging of alpine rock glaciers
Instruments and Methods Geophysical imaging of alpine rock glaciers

Create successful ePaper yourself
Turn your PDF publications into a flip-book with our unique Google optimized e-Paper software.
Maurer <strong>and</strong> Hauck: <strong>Instruments</strong> <strong>and</strong> methods 115<br />
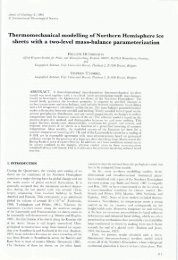
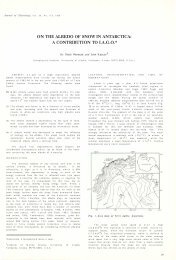
Fig. 5. (a) Georadar section recorded along the Murtèl <strong>rock</strong> glacier. (b) Our interpretation superimposed on the georadar section. Location <strong>of</strong><br />
the pr<strong>of</strong>ile is shown in Figure 2.<br />
The series <strong>of</strong> reflections observed in the up-glacier part <strong>of</strong><br />
the georadar section (Fig. 5) are most likely to originate from<br />
alternating snow <strong>and</strong> debris accumulations created by mass<br />
movement events from the slope above the <strong>rock</strong> glacier.<br />
Such features are quite common in georadar images <strong>of</strong> the<br />
upper part <strong>of</strong> <strong>rock</strong> <strong>glaciers</strong>; they represent the snow <strong>and</strong><br />
debris sources that define the typical morphology <strong>of</strong> <strong>rock</strong><br />
glacier bodies (e.g. Berthling <strong>and</strong> others, 2003). In the<br />
central <strong>and</strong> down-glacier parts <strong>of</strong> the georadar section, the<br />
two dominant reflections originate from the ice-rich <strong>and</strong><br />
moderately ice-rich layers observed in the borehole (reflection<br />
intersects the borehole at the boundary between icerich<br />
<strong>and</strong> s<strong>and</strong> <strong>and</strong> ice layers; Fig. 6). The deeper reflection at<br />
�20–30 m depth between 0 <strong>and</strong> 125 m distance corresponds<br />
to the bottom <strong>of</strong> the ice-containing units <strong>and</strong> to the<br />
shear horizon observed in the inclinometer measurements<br />
described by Vonder Mühll <strong>and</strong> Holub (1992). Their<br />
measurements indicate displacement rates <strong>of</strong> 0.04 m a –1 at<br />
this depth.<br />
The seismic speed discontinuity, S2, in Figure 4d defines<br />
the top <strong>of</strong> the bed<strong>rock</strong>. Towards the frontal part <strong>of</strong> the <strong>rock</strong><br />
glacier, S2 becomes shallower, reaching the surface at about<br />
170 m horizontal distance. The high bed<strong>rock</strong> speeds within<br />
this bed<strong>rock</strong> protrusion may indicate the presence <strong>of</strong><br />
virtually unfractured <strong>rock</strong> that may have acted as a barrier<br />
to the flow <strong>of</strong> the <strong>rock</strong> glacier.<br />
4. MURAGL CASE STUDY<br />
4.1. Site description<br />
The Muragl <strong>rock</strong> glacier is also located in the Upper<br />
Engadine area. It is 100–300 m wide, �700 m long <strong>and</strong><br />
extends over an altitude range <strong>of</strong> 2600–2800 m (Fig. 7). It is<br />
distinguished by rapid horizontal movements <strong>of</strong> up to<br />
0.5 m a –1 (Kääb <strong>and</strong> Vollmer, 2000). This is substantially<br />
faster than typical <strong>rock</strong> glacier movements, which are <strong>of</strong> the<br />
order <strong>of</strong> several cm a –1 . Like the Murtèl <strong>rock</strong> glacier, it exhibits<br />
pronounced flow lobes with transverse furrows <strong>and</strong><br />
ridges. The irregular flow-lobe pattern <strong>of</strong> the Muragl <strong>rock</strong><br />
glacier (compare Fig. 7b with Fig. 2b) may be the result <strong>of</strong><br />
periodic mass movements, perhaps reflecting several generations<br />
<strong>of</strong> <strong>rock</strong> glacier evolution. In 1999, four boreholes,<br />
B1–B4, were drilled through the <strong>rock</strong> glacier to bed<strong>rock</strong><br />
Fig. 6. Integrated interpretation <strong>of</strong> boundaries observed in the<br />
geoelectric (blue lines), seismic (red lines) <strong>and</strong> georadar (magenta<br />
lines) images from the Murtèl <strong>rock</strong> glacier. The borehole log is also<br />
displayed. DC1 <strong>and</strong> S1 denote the active layer, DC2 is the boundary<br />
between frozen <strong>and</strong> unfrozen material, S2 is the bed<strong>rock</strong> interface<br />
<strong>and</strong> S3 is probably a huge boulder.