Dutchess County Aquifer Recharge Rates & Sustainable Septic ...
Dutchess County Aquifer Recharge Rates & Sustainable Septic ...
Dutchess County Aquifer Recharge Rates & Sustainable Septic ...

You also want an ePaper? Increase the reach of your titles
YUMPU automatically turns print PDFs into web optimized ePapers that Google loves.
<strong>Dutchess</strong> <strong>County</strong> <strong>Aquifer</strong> <strong>Recharge</strong> <strong>Rates</strong>and <strong>Sustainable</strong> <strong>Septic</strong> System Density RecommendationsPage iiLIST OF TABLESDocument Tables (bound at rear of report)Table 1: <strong>Aquifer</strong> Discharge; Baseflow Separation in <strong>Dutchess</strong> <strong>County</strong> WatershedsTable 2: <strong>Aquifer</strong> <strong>Recharge</strong> <strong>Rates</strong>; by Watershed/Region & Hydrologic Soil GroupTable 3: Recommended Minimum Average <strong>Septic</strong> System DensitiesLIST OF FIGURESExecutive Figures (bound with Executive Summary)Executive Figure 1: <strong>Dutchess</strong> <strong>County</strong> Annual <strong>Aquifer</strong> <strong>Recharge</strong> <strong>Rates</strong> andMinimum <strong>Sustainable</strong> <strong>Septic</strong> System DensitiesExecutive Figure 2: <strong>Dutchess</strong> <strong>County</strong> Hydrologic Soil GroupsDocument Figures (bound at rear of report)Figure 1: <strong>Dutchess</strong> <strong>County</strong> Watersheds, Precipitation and GeologyFigure 2: Detail of Hydrologic Soil Groups versus Surficial GeologyFigure 3: <strong>Dutchess</strong> <strong>County</strong> Annual Precipitation and Watershed DischargeFigure 4: New Jersey <strong>Septic</strong> System Density ModelFigure 5: <strong>Dutchess</strong> <strong>County</strong> 1982 Gerber <strong>Septic</strong> System Density ModelFigure 6: <strong>Dutchess</strong> <strong>County</strong> Hydrologic Soil GroupsThe Chazen CompaniesApril 2006
<strong>Dutchess</strong> <strong>County</strong> <strong>Aquifer</strong> <strong>Recharge</strong> <strong>Rates</strong>and <strong>Sustainable</strong> <strong>Septic</strong> System Density RecommendationsPage iiiForewordby Scott Chase, Executive Director<strong>Dutchess</strong> <strong>County</strong> Water & Wastewater AuthorityThis report was commissioned by the <strong>Dutchess</strong> <strong>County</strong> Water & Wastewater Authorityto better understand <strong>County</strong>-wide aquifer recharge rates and to give municipalitiesguidance in setting sustainable development densities specifically related to the use ofindividual wells and conventional individual septic systems based upon our betterunderstanding of aquifer recharge.While I don’t like introducing a report with language that points out limitations, thereis always a concern that some will misuse guidelines when carrying out decisions infavor or against development proposals. Therefore, it is critical for readers of thisdocument to understand that the numerical minimum septic system densitiesrecommended herein cannot be applied more broadly to limit any other manner ofdevelopment in the <strong>County</strong>, and there are also variables in these calculations that canin some cases change the outcome of these septic system density calculations.Specifically, these development density recommendations for septic systems are notapplicable in areas where development will use combinations of central water supplies,central sewer systems or septic systems with enhanced wastewater treatment processesthat change nitrogen/nitrate discharges to groundwater. In addition, each developmentdecision may involve other information and/or unique circumstances that will requiredifferent inputs to the calculations and result in different outcomes for therecommended density guidelines. With this clarification stated, the informationcontained within the report and the logic for establishing the mathematical formulasand carrying out the calculations should be extremely valuable to community decisionmakers,and particularly to municipal governing boards and their advisors chargedwith setting long-range sustainable development goals.<strong>Dutchess</strong> <strong>County</strong> and most of its communities have adopted Greenway Compactprinciples to guide future development. The septic system density guidelines in thisreport should be viewed as consistent with these principles since the density guidelinesare average, rather than fixed-parcel size, densities. As such, they do not preclude useof smaller lots to conserve natural greenspace and farmland, as found in “conservationor cluster development”. Conservation development can and should still berecommended, as long as the total parcel and area-wide average build-out densities ofseptic systems are maintained and as long as wells are placed with consideration of anyareas of concentrated septic system discharge.The Chazen CompaniesApril 2006
<strong>Dutchess</strong> <strong>County</strong> <strong>Aquifer</strong> <strong>Recharge</strong>and <strong>Sustainable</strong> Rural Density Analysis Page 2inches of annual precipitation. <strong>Aquifer</strong> recharge rates in the Wappinger Creek andFishkill/Sprout Creek watersheds lie between the values listed above.These aquifer recharge rates are expected to inform understanding of a wide rangeof future aquifer and water resource protection inquiries. Examples include waterbudgets and SEQRA reviews, build-out water supply analyses at local or regionalscales, water budgets often provided with pumping test yield reports, and streambaseflow and riparian wetland management assessments.This report includes updated septic system density guidelines as the first of manylikely applications of the newly available aquifer recharge rates. Extensive areas of<strong>Dutchess</strong> <strong>County</strong> are and will continue to be dependent on the use of individualwells and conventional septic systems for water supply and wastewater disposal. Insuch areas, guidelines for maximum sustainable densities of wells and septicsystems will help insure availability of potable well water supplies.The Executive Figure 1 posts minimum average recommended sustainable parcelsizes for areas reliant on use of wells and septic systems. The calculations assumeresidential occupancy rates of 2.6 persons per system and include a 0.1 acreallowance for on-site impervious surfaces on each parcel. In summary,• In areas with Hydrologic Soil Groups A and A/D, minimum sustainableaverage septic system densities vary from east to west across the <strong>County</strong>between 1.2 and 1.4 acres per system;• In areas with Hydrologic Soil Group B, minimum sustainable average septicsystem densities vary from east to west across the <strong>County</strong> between 1.6 and1.9 acres per system;• In areas with Hydrologic Soil Groups C and C/D, minimum sustainableaverage septic system densities vary from east to west across the <strong>County</strong>between 3.0 and 3.5 acres per system;• In areas with Hydrologic Soil Group D, minimum sustainable average septicsystem densities vary from east to west across the <strong>County</strong> between 5.4 and6.2 acres per system.The ranges of recommended average minimum parcel sizes relate to the differingaquifer recharge rates identified across the <strong>County</strong>. The smallest average parcelsizes can be sustained in the Tenmile River watershed where precipitation andaquifer recharge rates are highest. Larger average parcel sizes are necessary in thenorthwest towns of Hyde Park, Rhinebeck and Red Hook where precipitation andaquifer recharge rates are lowest. <strong>Sustainable</strong> septic system densities on lands inThe Chazen CompaniesApril 2006
<strong>Dutchess</strong> <strong>County</strong> <strong>Aquifer</strong> <strong>Recharge</strong>and <strong>Sustainable</strong> Rural Density Analysis Page 61.0 INTRODUCTIONA key objective of the present effort is to present data and findings that are easy forthe general public to read. Section 1.0 of this report is therefore written to bypassmost technical language and to most clearly provide the results of this study.<strong>Aquifer</strong> recharge rates and septic system density recommendations have beenassigned to the four Hydrologic Soil Groups (HSG) described by the NaturalResource Conservation Service (NRCS). These soil groups can be identified fromsoil survey materials and normally require no further hydrogeologic interpretation.The distribution of hydrologic soil groups is shown on Figure 6. The most commonsoil groups are group C and C/D soils which together constitute fifty-three percentof <strong>Dutchess</strong> <strong>County</strong>. Hydrologic soil group B soils cover twenty-seven percent ofthe county. Hydrologic soil groups A and A/D cover ten percent, and hydrologic soilgroup D covers five percent of <strong>Dutchess</strong> <strong>County</strong>.Results of this investigation have been helpfully reviewed prior to public release byagency personnel in the <strong>Dutchess</strong> <strong>County</strong> Water & Wastewater Authority, <strong>Dutchess</strong><strong>County</strong> Department of Planning, <strong>Dutchess</strong> <strong>County</strong> Soil & Water ConservationDistrict, <strong>Dutchess</strong> <strong>County</strong> Department of Health, and the Cornell CooperativeExtension/<strong>Dutchess</strong> <strong>County</strong>, and the Chair of the Environment Committee of the<strong>Dutchess</strong> <strong>County</strong> Legislature. Levels of review among the above ranged from verbalbriefings, to formal presentations, to close edits of draft text. An early draft of thisreport was also generously reviewed by United States Geological Survey geologistAllan Randall. Notwithstanding the above beneficial reviews, the work producthere remains the responsibility of The Chazen Companies.1.1 Summary of <strong>Aquifer</strong> <strong>Recharge</strong> <strong>Rates</strong><strong>Recharge</strong> rates for aquifers in <strong>Dutchess</strong> <strong>County</strong> have been estimated in this reporton the basis of soil classes. Soils in <strong>Dutchess</strong> <strong>County</strong> have been assigned toHydrogeologic Soil Groups (HSG) by the Natural Resources Conservation Service(NRCS). These classifications range from HSG group A soils with the highestinfiltration rates to HSG group D soils with the most restrictive infiltration rates.The aquifer recharge analysis conducted in this study focuses on recharge mostlikely to reach aquifer horizons used for water well supply uses. The recharge rateestimates therefore exclude more ephemeral groundwater replenishment sometimesreferred to as interflow, quick flow, or rejected recharge, all of which normally failsto reach deeper aquifer horizons due to diversion along buried clay seams, lodgmenttill, or shallow buried bedrock surfaces. The updated aquifer recharge rateestimates identified in this report therefore represent a subset of overallThe Chazen CompaniesApril 2006
<strong>Dutchess</strong> <strong>County</strong> <strong>Aquifer</strong> <strong>Recharge</strong>and <strong>Sustainable</strong> Rural Density Analysis Page 7groundwater recharge which includes the more intermittent or ephemeral interflowgroundwater components. A recent study of the Wappinger Creek watershedemploys methods to identify both the interflow and aquifer recharge components oftotal groundwater recharge (Chazen, March 2006).This study does not distinguish between aquifer recharge to sand and gravelaquifers or to fractured bedrock aquifers. This is because although pumping ratesfrom bedrock wells and pumping rates from sand and gravel wells can varyconsiderably, the long-term sustainable yield of all wells is ultimately predicated onavailable aquifer recharge. It is this aquifer recharge which is the focus of thisinvestigation.Significantly different aquifer recharge rates occur across <strong>Dutchess</strong> <strong>County</strong> becauseof different precipitation patterns. Figure 1 documents the variability, from a low ofapproximately 38 inches per year in Hyde Park, Rhinebeck and Red Hook, to over46 inches per year in parts of the Harlem Valley and the Fishkill watershed. Thesedifferences directly influence groundwater recharge and stream flows across<strong>Dutchess</strong> <strong>County</strong>.Table 2 lists aquifer recharge rates identified by this study. <strong>Aquifer</strong> recharge ratesare highest in the Fishkill and Tenmile River watersheds where precipitation ratesare highest. Lower aquifer recharge rates are identified in the Wappinger Creekwatershed. Yet lower aquifer recharge is projected for the towns of Hyde Park,Rhinebeck and Red Hook due to proportionally lower available precipitation rates.The low aquifer recharge rates identified by this study in northwest <strong>Dutchess</strong><strong>County</strong> are consistent with findings in a 2002 <strong>Dutchess</strong> <strong>County</strong> study (Chazen,2003), documenting lowest <strong>County</strong> drought-stage stream flows in the Crum ElbowCreek in Hyde Park and the Little Wappingers Creek in adjacent parts of the Townof Clinton.As shown on Table 2, <strong>Dutchess</strong> <strong>County</strong> aquifer recharge rates for soils in HSGgroups A and A/D range between 17.3 and 20.2 inches per year, recharge rates onHSG group B soils range between 12.6 and 14.7 annual inches, recharge rates onHSG groups C and C/D soils range between 6.5 and 7.6 inches per year andrecharge on HSG group D soils range between 3.6 and 4.2 inches per year.The NRCS has identified some dual-HSG A/D and C/D soils. These assignmentsreflect sub-soil conditions which can slow the initial rates of infiltration, usuallybecause of buried clay or shallow bedrock horizons or because the deeper sedimentsare periodically saturated at near-watertable conditions. In this analysis, theestimated aquifer recharge rates for such dual-category soils have been consolidatedwith their higher-infiltration category (e.g. A/D with A soils and C/D with C soils)since most aquifer recharge occurs during rain events of less than 1.25 inchesThe Chazen CompaniesApril 2006
<strong>Dutchess</strong> <strong>County</strong> <strong>Aquifer</strong> <strong>Recharge</strong>and <strong>Sustainable</strong> Rural Density Analysis Page 8(Charles, et al, 1993) when the initial rate of infiltration will not yet be slowed bythe slowing effect which only begins to occur as the upper-most soil becomes fullysaturated and the lower-permeability secondary characteristic begins to affect netinfiltration rates.Precipitation recorded at the Institute of Ecosystem Studies EnvironmentalMonitoring Program in Millbrook New York over a recent ten year period, fromJanuary 1, 1996 to January 1, 2006, indicates that precipitation events exceeding1.25 inches occur on average just 6.7 days per year. This study estimates that onlyduring such heavier events will the effect of the deeper horizon inhibit theotherwise higher immediate tendency of the soil to accept aquifer recharge.1.2 Summary of <strong>Sustainable</strong> <strong>Septic</strong> System DensitiesThe sustainable residential density recommendations presented here apply only tosites or regions reliant on wells and septic systems. The formula used to developthese recommendations is shown on Table 3 and is printed below. It considersaquifer recharge rates, household occupancy rates, annual nitrate production percapita, impervious surface coverage, and a selected allowable residual nitrateconcentration target.Recommended minimum average parcel sizes are summarized in shaded columnson Table 3. Where traditional site design is used, (e.g. without low-impact designfeatures such as rainfall gardens or other focused efforts to enhance on-siterecharge) between 1.2 and 1.4 acres per system are needed where HSG A and A/Dsoils are present, between 1.6 and 1.9 acres per system are needed where HSG Bsoils are present, between 3.0 and 3.5 acres per system are needed where HSG Cand C/D soils are present, and as much as 5.4 to 6.2 acres per system are neededwhere HSG D soils are found. The regional variation reflects precipitation andhence aquifer recharge rate changes across <strong>Dutchess</strong> <strong>County</strong>.To provide perspective on regional implications of these recommendations andbased on specific analysis of the three dominant <strong>County</strong> watersheds (Table 2), HSGB and HSG C and C/D soils together cover approximately eighty percent of<strong>Dutchess</strong> <strong>County</strong> and Hydrologic Soil Groups C and C/D alone cover fifty-threepercent of <strong>Dutchess</strong> <strong>County</strong>, so the sustainable minimum average parcel size inareas with wells and septic systems should for the over fifty percent of <strong>Dutchess</strong><strong>County</strong> exhibiting HSG C or C/D soils be no less than 3.0 to 3.5 acres per parcel.The distribution of Hydrologic Soil Groups is shown on Figure 6.These minimum average parcel size recommendations assume a target groundwaternitrate concentration of 5.2 milligrams per liter and a typical residential occupancyrate of 2.6 persons per household based on typical <strong>Dutchess</strong> <strong>County</strong> occupancyThe Chazen CompaniesApril 2006
<strong>Dutchess</strong> <strong>County</strong> <strong>Aquifer</strong> <strong>Recharge</strong>and <strong>Sustainable</strong> Rural Density Analysis Page 9levels in 2000 census data. We note that average family sizes in <strong>Dutchess</strong> <strong>County</strong>are reportedly over 3.0 persons per household, but the overall average occupancyrate of 2.6 persons per household was judged to most closely describe typicalresidential occupancy rates and was used in the default density recommendationsprovided here. The calculated average parcel sizes also include an allowance of upto 0.1 acre of impervious surface per system and an average annual discharge of 10pounds of nitrate-nitrogen per person. <strong>Aquifer</strong> recharge rates used in thecalculations were selected for each watershed region and Hydrologic Soil Groupfrom Table 2.Minimum regional density recommendations are also provided on Table 3. Thesedensity values differ from minimum average parcel size recommendations byincluding an additional allowance for proportionally-associated roads normallyaccompanying parcels. For these regional density recommendations, the impervioussurface allowance is increased to 0.3 acres per septic system to account for both onsiteroof and driveway impermeable surfaces, and a share of roads to support each,parcel, all designed assuming traditional stormwater management techniqueswhich most commonly focus on removing stormwater from immediately adjacentareas and which usually include detention techniques rather than rechargemitigation techniques. All other inputs are left as for the minimum average parcelsize calculations. If calculated impervious surfaces for proposed particular projectsdiffer from 0.30 acres per septic system the regional density recommendations canbe adjusted accordingly.For reference purposes, the guiding formula for the recommendations provided inthis report is provided below, available for use a project scale, on for municipal orwider-regional analysis:A = 4.4186HM / CqR + IscWhereA = acres per average system, in acresH = persons per systemM = pounds of nitrate-nitrogen per person per year, in poundsCq = Nitrate-nitrogen target average groundwaterconcentration, in mg/LR = Annual <strong>Recharge</strong> Rate, in inchesIsc = Impervious surface cover, in acres.More complete details describing the selected density model are discussed in Section3.0 of this report, including a review of assumptions and conditions applicable to themodel.The Chazen CompaniesApril 2006
<strong>Dutchess</strong> <strong>County</strong> <strong>Aquifer</strong> <strong>Recharge</strong>and <strong>Sustainable</strong> Rural Density Analysis Page 102.0 AQUIFER RECHARGE ANALYSIS2.1 <strong>Aquifer</strong> <strong>Recharge</strong> Evaluation Components2.1.1 Types of <strong>Recharge</strong><strong>Aquifer</strong> recharge in <strong>Dutchess</strong> <strong>County</strong> comes from local rather than distant areas. Aportion of precipitation infiltrates through soil layers to underlying saturatedporespace or fractures. These saturated geologic formations constitute the aquiferswhich supply water to wells and which receive septic system liquid discharges.Clay horizons in some settings and the generally clay-rich soils found in someupland areas can each reduce infiltration rates; in general, however, all land in<strong>Dutchess</strong> <strong>County</strong> allows at least some measure of aquifer recharge.Investigators distinguish between various types of recharge (de Vries & Simmers,2002; Hiscock, 2004; Scanlon et al, 2002). Under various names, these includedirect recharge falling on a site, additional localized recharge flowing onto a sitefrom adjacent areas to supplement direct recharge, and indirect or induced rechargewhich occurs where pumping wells draw surface water down into aquifers. Thereare also important distinctions between types of recharge and infiltration:infiltration refers to water movement into the subsurface, while recharge refers tothe share of infiltration which reaches either the uppermost surface of the aquiferknown as the watertable, recognized here as aquifer recharge, or at least reachesshallow groundwater flow pathways below root zones and so escapes prompttranspiration back to the atmosphere. This last fraction of infiltration follows claylayers or bedrock layers to streams or ponds in a matter of days or weeks withoutever meaningfully replenishing the aquifer and is sometimes referred to as“interflow”, “quick flow” or “rejected recharge,” depending on mechanisms involvedand investigators consulted. In this report this component of groundwater rechargeis referred to as interflow. Thus, only a fraction of infiltration ends up as aquiferrecharge successfully recharging underlying fractured bedrock or granular sedimentaquifers. These aquifers serve as substantial groundwater storage reservoirs andare the geologic horizons from which wells intersect and extract water supplies.The present study focuses on the aquifer recharge rates, excludingevapotranspiration and interflow losses. The present study also estimates thatindirect or induced recharge from pumping wells seldom occurs from use of lowcapacitydomestic wells which are the primary subject of this evaluation. Finally,the present study does not distinguish between direct and localized recharge sincemost areas of at least a few acres in size likely benefit from each and seeking todistinguish between these is presently beyond the scope of this study and is unlikelyto yield substantially different overall results.The Chazen CompaniesApril 2006
<strong>Dutchess</strong> <strong>County</strong> <strong>Aquifer</strong> <strong>Recharge</strong>and <strong>Sustainable</strong> Rural Density Analysis Page 112.1.2 Summary of Prior <strong>Recharge</strong> Rate EstimatesVarious prior investigators have estimated groundwater recharge rates for<strong>Dutchess</strong> <strong>County</strong> or adjacent regions. These estimates have been developed using arange of methods and recharge rate estimates have generally been similar. Allinvestigators have recognized that soil types crucially influence effective rechargerates to the underlying aquifers so most describe recharge rates in terms ofrecharge into surficial geologic formations without consideration of the variousunderlying bedrock formations. No known prior investigators focusing on <strong>Dutchess</strong><strong>County</strong> have distinguished between aquifer recharge and interflow components ofoverall groundwater recharge.Another general convention among prior investigators has been to evaluate annualtotal recharge rather than identifying month-to-month or seasonal recharge rates.This study also focuses on annual aquifer recharge since most wells used forresidential purposes are, or should be, installed deeply enough to access sufficientstored groundwater in fractures or pore spaces to support several months waterdemand without meaningful recharge. Such periods without recharge currentlyoccur during most summers when evapotranspiration loss rates routinely exceedpotential recharge rates.Robert Gerber (1982) provided some of the earliest recharge rate estimatescommonly referenced in <strong>Dutchess</strong> <strong>County</strong> groundwater investigations. Gerber usedpublished literature from other regions to estimate annual recharge for fiveprevalent <strong>Dutchess</strong> <strong>County</strong> geologic landscapes. In areas with sand and gravelbasedsoils, Gerber estimated annual recharge rates of 14.3 inches where depositswere relatively thin and 18.0 inches for thicker deposits. Gerber’s recognition of theimportance of sediment thickness may allude to what today we recognize asinterflow or rejected recharge along buried bedrock surfaces occurring wherethinner sandy soils allow limited retention time during which fuller recharge of thebedrock formation could occur. In till-covered upland areas, Gerber estimatedannual recharge rates of 6.75 inches and 3.2 inches for areas with thin and thickclay-rich till coverage, respectively. The higher recharge estimate for thin-soiledareas addresses the opportunity for some recharge to pass directly into fracturedbedrock through bare-rock areas, whereas areas with thicker, clay-rich till hasfewer such recharge windows. Finally, in <strong>Dutchess</strong> <strong>County</strong> locations where postglacialtemporary lake beds collected layered silty-clay deposits, Gerber’s researchsuggested an estimated annual recharge rate of 2.25 inches.A study by Snavely (1980) offers less geologic detail than Gerber by focusing only onvalley versus upland landscapes. This simplified dual-terrain study approachestimated an annual recharge rate of 21 inches for valley areas with sand andgravel deposits in the Fishkill-Beacon area, and 8 inches of annual recharge inThe Chazen CompaniesApril 2006
<strong>Dutchess</strong> <strong>County</strong> <strong>Aquifer</strong> <strong>Recharge</strong>and <strong>Sustainable</strong> Rural Density Analysis Page 12adjacent hillside areas covered with glacial till. Written communication withUnited States Geological Survey geologist Allan Randall is cited as the source of therecharge rate estimates. The basis for Randall’s estimates is not provided so it isunknown how the estimates were determined.A 1995 evaluation of aquifer recharge rates in Putnam and Westchester Countiesused a computer model to estimate recharge rates for sediment-filled valley depositsand upland till-mantled areas (Wolcott & Snow, 1995). The selection of a dualterrainmodel was similar to the approach used by Snavely. The model wascalibrated to water level data in observation wells and to the groundwatercomponent of streamflow, or baseflow. The analysis estimated annual aquiferrecharge rates of 19.17 inches in valley areas and 8.45 inches in upland areas withclay-rich glacial till. The method of baseflow separation used in the analysis islikely to have identified the combined groundwater components of interflow andaquifer recharge. Methods of baseflow separation which can be used to separatethese two components are addressed in Section 2.2.3 and elsewhere (Chazen, March2006).New Jersey regulators have researched recharge rates for all soil types in the state(Charles et al, 1993). New Jersey’s Geological Survey has worked cooperativelywith NJ Department of Environmental Protection to develop recharge rateestimates for soils in New Jersey, taking into consideration state-wide precipitationvariations, existing land uses, runoff coefficients representative of typical rainfallevents, and evapotranspiration losses. The resulting recharge estimates arecalibrated using baseflow separation data from New Jersey’s rivers and streams.New Jersey’s Geological Survey recommends using a baseflow separation methoddevised by Posten (1984) for calibrating recharge rates (Hoffman, 1999). <strong>Recharge</strong>rates identified by New Jerseys program vary from less than 3 inches annually toover 20 inches annually for different soil types.These various prior investigations have generally converged on similar rechargerate estimates for many common <strong>Dutchess</strong> <strong>County</strong> terrains. <strong>Recharge</strong> ratesthrough open sand and gravel formations are agreed to lie somewhere between 14and 20 inches per year. Silt-rich glacial till landscapes are agreed to allow between3 and 9 inches of annual recharge. Massive clays are agreed to be least conducive toaquifer recharge. All methods consider soil types or surficial geology to be the mostsignificant factors in defining recharge rates. None of the prior methods havedistinguished between the interflow and aquifer recharge components of overallgroundwater recharge.The Chazen CompaniesApril 2006
<strong>Dutchess</strong> <strong>County</strong> <strong>Aquifer</strong> <strong>Recharge</strong>and <strong>Sustainable</strong> Rural Density Analysis Page 132.1.3 Regional Scale of <strong>Recharge</strong> EstimatesThe investigations above evaluated groundwater recharge at several scales (e.g. sizeof the study area). Methods by Snavely (1980) and Snow & Wolcott (1995) identifyrecharge rates only between predominantly water-laid valley deposits and typicallyclay-rich upland deposits. The general recharge rates assigned by these studies arehelpful at the landscape scale but become problematic where clay or silty depositsare found in valley settings, or where more granular tills are found in upland areas.Work completed in Connecticut assigns similar regional recharge rates to suchmonolithic “upland” versus “valley” deposits and considers also the ratio betweensuch upland and valley-train deposits when estimating low-flow duration reliabilityin river systems (Cervione, et al, 1972). For review purposes only, these broadvalley versus upland geographic type-areas are shown on Figure 1 of this report,demonstrating visually that the distribution of such glacio-fluvial deposits aresomewhat uniformly distributed throughout <strong>Dutchess</strong> <strong>County</strong>, and demonstratingalso the lack of refinement offered by such approaches.Gerber (1982) provided more distinct recharge estimates for smaller geographicunits, assigning separate recharge rate estimates to five landscape terrains. Theresearch underlying the recharge estimates was not extensive but the terraindistinctions provide more refinement than the broader categories assigned bySnavely, and Wolcott & Snow.<strong>Recharge</strong> rate analysis completed for the State of New Jersey is extensive,providing discrete recharge estimates for every soil type in the State. The researchbehind these assigned rates was not exhaustively reviewed for the present studybut the peer review process followed by the United States Geological Survey and itsState offices is extensive, so project output is likely to be among the highest qualitycurrently available. <strong>Recharge</strong> rate values provided by the New Jersey model fallwithin the ranges of values identified by all prior investigations.This review indicates that recharge rates can be estimated at the broad landscapelevel as shown by the work of Snavely and Wolcott & Snow, or at a more focused butstill broad basis as shown by Gerber’s five recharge classes, or can be estimateddown to the individual soil group level as has been attempted in New Jersey.The Chazen CompaniesApril 2006
<strong>Dutchess</strong> <strong>County</strong> <strong>Aquifer</strong> <strong>Recharge</strong>and <strong>Sustainable</strong> Rural Density Analysis Page 142.2 <strong>Dutchess</strong> <strong>County</strong> <strong>Aquifer</strong> <strong>Recharge</strong> Assessment2.2.1 <strong>Dutchess</strong> <strong>County</strong> Geology and <strong>Aquifer</strong>sBedrock aquifer formations underlying <strong>Dutchess</strong> <strong>County</strong>’s watersheds are varied interms of types and distribution but generally consist of shale/greywacke and theirmetamorphic equivalents, limited crystalline, and dolomite limestone’s and theirmetamorphic equivalents. Evaluations by Gerber (1982) and Simmons (1961)among others indicate that median and average domestic well yields from bedrockaquifers in <strong>Dutchess</strong> <strong>County</strong> vary by less than one order of magnitude, consistentwith their uniform reliance on secondary porosity for groundwater storage andtransmission.Overlying the bedrock formations are a variety of unconsolidated materials. Siltdominatedglacial till mantles all upland and some low-land areas within thewatersheds. During glacial recession, melt water flushed sediment down watershedvalleys, depositing high-permeability sand and gravel in many localities anddepositing silt and clay in larger temporary lakes where flow slowed. These waterlaiddeposits of glacial origin are shown in a simplified form on Figure 1 based oninterpretation from New York State’s surficial geologic map. Each watershedcontains approximately equivalent ratios of upland geology versus the valley glaciofluvialdeposits which include outwash sand and gravel, lacustrine deposits andkame deposits.Watersheds and streamflow records were closely evaluated in this study to helpestimate rates of aquifer recharge. The selection of watersheds and data years wasbased on the availability of historic USGS streamflow data. The three largestwatersheds in <strong>Dutchess</strong> <strong>County</strong> are the Wappinger Creek, Tenmile River, and theFishkill/Sprout Creek. The Tenmile river flows eastward to the Housatonic River inConnecticut while the Wappinger and Fishkill/Sprout Creek watersheds flowsouthward to the Hudson river.Available historic precipitation data from weather stations selected near thewatersheds show that precipitation is normally evenly distributed throughout theyear, although increasing slightly during the summer months. The mean annualprecipitation at <strong>Dutchess</strong> <strong>County</strong> airport for the 109-year period (1896-2004) ofrecord is approximately 40.4 inches. Figure 1 demonstrates a marked increase inaverage precipitation from northwest to southeast across <strong>Dutchess</strong> <strong>County</strong>, withannual averages ranging from 38 inches annually in Hyde Park, Rhinebeck and RedHook to over 44 inches in portions of southeast <strong>Dutchess</strong> <strong>County</strong> andMassachusetts.The Chazen CompaniesApril 2006
<strong>Dutchess</strong> <strong>County</strong> <strong>Aquifer</strong> <strong>Recharge</strong>and <strong>Sustainable</strong> Rural Density Analysis Page 15The Wappinger Creek is the second largest stream in <strong>Dutchess</strong> <strong>County</strong>, flowing 32miles from Pine Plains in the northeast to New Hamburg in the southwest (Figure1). The drainage area of the watershed above the Red Oaks Mill USGS gaugingstation located upstream of the Village of Wappingers Falls is approximately 181square miles. It has a total fall of 460 feet and an average fall of about 14 feet permile. The watershed lies entirely in <strong>Dutchess</strong> <strong>County</strong>, draining much of the TownsClinton, Stanford, Washington, Pleasant Valley, and portions of the Towns of Milan,Pine Plains, Hyde Park, Poughkeepsie, and LaGrange. Main Wappinger Creektributaries generally follow a dendritic drainage pattern within a landscape ofrolling hills and valleys. The drainage density (miles of blue USGS map streamsper watershed square mile) is approximately 1.73 miles per square mile ofwatershed.The Fishkill/Sprout Creek watershed drains most of the central and southern partsof the <strong>Dutchess</strong> <strong>County</strong> (Figure 1). It flows southwesterly from Union Vale to theHudson River at Beacon. It has a total fall of about 600 feet in 26 miles, or anaverage fall of about 23 feet per mile. The drainage area above the USGS gaugingstation at Beacon, NY is about 190 square miles. The Fishkill watershed is drainedby two major tributaries. The Sprout Creek drains the western portion of thewatershed while the upper reaches of the Fishkill Creek drain the eastern portionsof the watershed. The resulting drainage density of approximately 1.95 miles persquare mile of watershed would normally be predictive of more rapid baseflowdepletion than that of lower-density streams but baseflow depletion curves for theWappinger Creek, Fishkill Creek and Tenmile Rivers are quite similar (Ayer &Pauszek, 1968), so the higher drainage density in the Fishkill Watershed appears tobe more a function of having two major tributaries than of a single more efficientoverall drainage network.The Tenmile River has a drainage area of 203 square miles above the USGSgauging station near Taylorsville, Connecticut. The watershed lies in <strong>Dutchess</strong><strong>County</strong> and part of the state of Connecticut (Figure 1). A unique characteristic ofthe Tenmile river is its occupation of a single and deep north-south valley.Tributaries generally follow a dendritic drainage pattern within this elongate valleywith a drainage density of approximately 1.75 miles per square mile of watershed.2.2.2 <strong>Recharge</strong> Assessment Method SelectionSelection of a recharge assessment method for this study involved selecting betweenmethods and data sets based on necessary levels of precision and budgetconstraints. Key selection decisions follow:Scale: Chazen and DCWWA selected a study scale more geographically focusedthan the simple dual terrain model used by Wolcott & Snow, and by Snavely butThe Chazen CompaniesApril 2006
<strong>Dutchess</strong> <strong>County</strong> <strong>Aquifer</strong> <strong>Recharge</strong>and <strong>Sustainable</strong> Rural Density Analysis Page 16less geographically precise than the New Jerseys emphasis on individual soil types.Visual inspection of Figure 2 confirms that use of the Hydrologic Soil Groupsprovides a far greater level of detail than use of the simple Valley and Uplanddistinctions used by Wolcott & Snow and by Snavely. Estimation of recharge ratesfor individual soils was both beyond the scope of work envisioned for this study andwas judged unwarranted given the applications envisioned for the rechargeestimates.A choice remained between continued using five glacial geologic terrains asidentified by Gerber (1982) or to convert to use of four Hydrologic Soil Groups. Theadvantages of the NRCS Hydrologic Soil Groups (HSG) are evident because currentmaps showing Hydrologic Soil Groups are accessible to planners and communitymembers and so require no continued mapping by others. These units weretherefore judged more accessible and less prone to challenge than continued use ofGerber’s geologic mapping boundaries. No specific geologic or hydrogeologicinvestigations would be needed to apply recharge rates if the report findings werekeyed to Hydrologic Soil Groups.NRCS soil groups, and maps thereof, also reflect a more current interpretive effortthan the Gerber maps, and NRCS may be expected periodically update these soilsmaps as new soil survey date become available. The soil units and boundariesdelineated by Gerber already no longer conform to most recent soils and surficialgeology maps in some localities and so are not readily updated. Finally, the fourhydrologic soil groups are assigned on the basis of infiltration ranges, consideredrelevant to proportional net aquifer recharge rates. Supportive work publishedrecently by Brands et al (2005) also confirms that hydrologic soil groups andwatershed drainage density most reliably predict or model baseflow recessionperformance in watersheds.Therefore, for purposes of this study, aquifer recharge has been assigned to NRCSHydrologic Soil Groups.Where soils are classified by NRCS as Hydrologic Soil Group A/D or C/D, these havebeen consolidated in this analysis with their respective primary A and C classessince infiltration rates associated with the primacy capacity is generally dominantduring rainfalls of less than 1.25 inch even in areas with buried bedrock interfacesor shallow watertable conditions. Stated another way, it is only during the heaviestrains that the “/D” adjudicating classification diverts infiltration to interflow alongburied clay or buried bedrock horizons, or leads to rejection of recharge if soils arealready fully saturated in riparian wetlands or otherwise already flooded sediments.Since research indicates that most groundwater recharge occurs during lighterrather than heavier rainfalls (Hoffman & Canace, 2002), uppermost soil horizonswith an A or C HSG ranking are likely to allow initial rapid infiltration before beingThe Chazen CompaniesApril 2006
<strong>Dutchess</strong> <strong>County</strong> <strong>Aquifer</strong> <strong>Recharge</strong>and <strong>Sustainable</strong> Rural Density Analysis Page 17slowed by deeper horizons warranting the “/D” modifying characteristic. There aresome areas where infiltration reaching a buried “/D” horizon will not reach asignificant underlying aquifer, but for purposes of septic system densityrecommendations, many such areas are close to aquifer discharge locations wherethe general importance of calculating sustainable septic density recommendationsmay be less crucial because of a lack of downgradient wells.Areas for which no Hydrologic Soil Group assignment is available are limited,consisting primarily of unmapped soils and/or open water bodies representing onlysmall percentages of the total watershed areas.<strong>Recharge</strong> <strong>Rates</strong>: Chazen identified aquifer recharge rates by using baseflowseparation data from the three watersheds in <strong>Dutchess</strong> <strong>County</strong>, calculating thefractional share of each Hydrologic Soil Group in each watershed, and performingan approximate “best fit” analysis to select recharge rates for each soil group,constrained by the existing literature citation recharge values including those citedin Section 2.1.2 of this report. Posten’s method (Posten 1984) was selected forbaseflow separations because this method best identifies baseflow associatedaquifer recharge/discharge. <strong>Recharge</strong> rate adjustments were applied individuallyto each watershed based on historic average precipitation rates in the individualwatersheds, and projected recharge rates were assigned to the towns of Hyde Park,Rhinebeck and Red Hook based on precipitation--calibrated adjustment of thebaseflow-based aquifer recharge rates. Advantages of the selected approachinclude:• Literature sources cited in Section 2.1.2 provide credible recharge estimateranges which can be reasonably matched to the Hydrologic Soil Groups usedby this study.• The use of baseflow data from streams in and near <strong>Dutchess</strong> <strong>County</strong> allowedcalibration to select “best fit” proportional recharge rates for each hydrologicsoil group from among the many values found in the literature. Posten’sbaseflow separation method is a conservative baseflow method (Hoffman,1999) and so is least likely to over-emphasize interflow which does notmeaningfully reflect groundwater used by groundwater wells. As such,calibration using the Posten method provides a balanced and somewhatconservative planning bias without over-focusing on “worst-case” rechargeconditions. The balance between average and worst-case conditions wasjudged appropriate because aquifer storage capacity provides impactbuffering during extreme droughts so residential density based only ondrought data is overly conservative, and because any short-term defectoccurring droughts will be manifested by temporary nitrate elevations but nomore catastrophic well impacts. Rutledge (1998) recommends not usingThe Chazen CompaniesApril 2006
<strong>Dutchess</strong> <strong>County</strong> <strong>Aquifer</strong> <strong>Recharge</strong>and <strong>Sustainable</strong> Rural Density Analysis Page 18baseflow separation on watersheds over 500 square miles since it becomesincreasingly difficult to distinguish surface water from true baseflow;however, neither the Wappinger Creek, Tenmile River nor the Fishkill Creekare near this limit.• Use of USGS precipitation data records (Randall, 1996) allowed proportionalcorrection of recharge rates for each hydrologic soil group based onapproximate precipitation rates identified for each watershed and for townsin northwest <strong>Dutchess</strong> <strong>County</strong>.2.2.3 <strong>Aquifer</strong> <strong>Recharge</strong> Analysis for <strong>Dutchess</strong> <strong>County</strong>Precipitation records from the <strong>Dutchess</strong> <strong>County</strong> airport were examined to evaluaterelationships between annual precipitation and total flow in the Wappinger Creek,Tenmile River, and Fishkill creek. Daily rainfall data from the <strong>Dutchess</strong> <strong>County</strong>Airport from 1948 from 2001 were accessed from the National Climate Data Center(NCDC). Annual rainfall totals were compared to annual hydrograph totals for theavailable associated water years of the three watersheds. Figure 3 demonstratesthat annual stream flow correlates generally with precipitation. The lack of perfectcorrelation reflects changes in groundwater storage based on drought or flushaquifer storage condition in preceding years.The Wappinger Creek was selected as a control watershed for this evaluationbecause it flows through the center of <strong>Dutchess</strong> <strong>County</strong> and has a long hydrographdata record. Fifteen years were selected in which total annual stream flow volumefell within 10 percent of the mean streamflow value over the period of record. Fromthese, ten also agreed with years during which annual total flow of the TenmileRiver was also within 10 percent of mean stream flow values for that stream. TheTenmile River has an approximately equal record of available hydrograph data.The ten years of average total stream flow discharge common to both the WappingerCreek watershed and the TenMile River watershed were then selected for baseflowseparation. The ten years for which records were available in both the WappingerCreek and Tenmile River were: 1933, 1943, 1948, 1956, 1961, 1978, 1982, 1986,1993 and 1998.The record of available hydrograph data from the Fishkill Creek is much shorterthan that of the other two watersheds. The period of available record was inspectedand, of the ten median streamflow years evaluated for the Tenmile River andWappinger Creek, data for Fishkill Creek flows were only available for 1948, 1956,and 1961. Additional years were not selected for the Fishkill Creek since any otheryears would likely fall outside of those years during which streamflow in the otherwatersheds fell within 10 percent of average flows over their longer periods ofrecord. Only these three years of record in the Fishkill Creek watershed wereThe Chazen CompaniesApril 2006
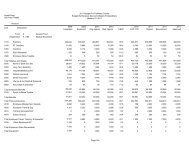
<strong>Dutchess</strong> <strong>County</strong> <strong>Aquifer</strong> <strong>Recharge</strong>and <strong>Sustainable</strong> Rural Density Analysis Page 19therefore selected for baseflow separation. Data years and resulting baseflowseparation findings for each of these years from each watershed are summarized onTable 1.Baseflow separations were completed for these years following methods outlined byPosten (1984). Resulting tabulated findings from Chazen’s baseflow separationwork are provided on Table 1. The results provide the basis for calculating averagerecharge rates for each watershed, constituting between approximately 50 to 54percent of total runoff for each watershed. Variations are attributed to aquiferstorage differences between the three watersheds among other considerations. Aslisted on Table 2, these recharge estimates equate to approximately 9.53 net inchesof aquifer recharge across the full expanse of the Wappinger Creek watershed, 10.50inches across the Fishkill Watershed and 10.59 inches across the Tenmile Riverwatershed. The differences in recharge in these watersheds closely follows thepattern of increased annual precipitation across the <strong>County</strong>, with approximately 40inches of rainfall in the Wappinger watershed, 42 inches of rainfall in the Fishkillwatershed and as much as 44 inches of rainfall in the Tenmile River watershed(Figure 1). Figure 1 also indicates that precipitation in the towns of Hyde Park,Rhinebeck and Red Hook near the Hudson River is only approximately 38 inches,predicting proportionally lower net aquifer recharge rates in these towns.To estimate recharge rates attributable to different soils, hydrologic soils groupswere totaled in each watershed using a GIS. Total acreages in watershed and areaare shown on Table 2. Trial-and-error, weighted average recharge assignmentsconstrained by literature-guided recharge rate estimates were adjusted untilpredicted net watershed recharge rates reached a best possible fit, calibrating withthe watershed-wide baseflow findings to within approximately 0.2 inches of actualannual recharge. Agreement to within 0.2 inches was judged to be a reasonablysuccessful level of precision given the scale of the study and the range of potentialadditional variables contributing to watershed systems. Proportional changes inavailable rainfall in each basin were used to scale recharge estimates for each soilgroup. For example since rainfall in the Wappinger watershed is approximately95% of that in the Fishkill watershed, the recharge values assigned to eachhydrologic soil group in the Wappinger watershed is 95% of the recharge values inthe Fishkill watershed.Calibration stream flow data were not available for all portions of <strong>Dutchess</strong> <strong>County</strong>.However, inspection of Figure 1 indicates where precipitation rates remainconsistent with or suggest the need for proportionally adjusted aquifer rechargerate assignments beyond watershed boundaries. Precipitation in Hyde Park,Rhinebeck and Red Hook is approximately 10 percent less than rainfall in theFishkill watershed. Rainfall in northern portions of Milan and Pine Plains areapproximately similar to rainfall in the Wappinger watershed, so reasonableThe Chazen CompaniesApril 2006
<strong>Dutchess</strong> <strong>County</strong> <strong>Aquifer</strong> <strong>Recharge</strong>and <strong>Sustainable</strong> Rural Density Analysis Page 20estimates of proportionally adjusted aquifer recharge for such areas could beprojected. Similarly, rainfall and thus likely aquifer recharge rates in the Town ofPoughkeepsie is likely to be comparable to that found throughout the WappingerCreek watershed. Rainfall in the Town of Wappinger includes rates found in boththe Wappinger Creek and the Fishkill/Sprout Creek watersheds, so recharge ratesand associated aquifer recharge rates from either watershed might apply but aconservative assignment selects the Wappinger Creek values. By such means,reasonable estimates of aquifer recharge rates can be provided for all areas in<strong>Dutchess</strong> <strong>County</strong>.<strong>Aquifer</strong> recharge rates for each hydrologic soil group within the individualwatersheds and for the northwest municipalities of Hyde Park, Rhinebeck and RedHook and enclosed villages are shown on Table 2. Hydrologic soil groups are shownon Figure 6.The Chazen CompaniesApril 2006
<strong>Dutchess</strong> <strong>County</strong> <strong>Aquifer</strong> <strong>Recharge</strong>and <strong>Sustainable</strong> Rural Density Analysis Page 213.0 SUSTAINABLE SEPTIC SYSTEM DENSITY ANALYSISThe preservation of well yield capacity and groundwater quality are importantfactors for the sustainable use of domestic wells and conventional septic systems.Individual systems are prevalently used in suburban to rural areas, whilecommunity cores and some suburban areas rely on centralized water and/or sewerservices.The following analysis of sustainable septic system densities applies only to areasusing domestic wells and conventional individual or community septic systems.State regulations already require specific separation distances between wells andseptic system leaching fields. The distances are primarily focused on ensuringreliable die-off of pathogenic coliform and viruses (10 NYCRR, Appendix 5-B). Lessattention has so far been given to groundwater quality management addressingconservative inorganic wastewater constituents like sodium chloride and forms ofnitrogen for which drinking water standards exist, or for recently-identifiedpharmaceutical product residues, endocrine disrupting steroids and other personalcare chemicals for which no standards presently exist. The presence of highconcentrations of nitrates may be an indication that there are other such persistentcontaminants in groundwater originating from septic tanks which, like nitrate, donot readily break down and will normally be most cost-effectively managed bydilution.The relatively high concentration of nitrogen released from septic systems and therelatively low drinking water and groundwater standard for nitrate has madenitrate frequently-modeled compound for research and sustainable density analysis.Groundwater nitrate concentrations originating from natural sources are generallyinconsequential while a wide range of human activities can increase nitrate levelssubstantially. The New York State Department of Health standard for nitrate indrinking water is 10 milligrams per liter (mg/l). The average human being releasesapproximately 10 pounds of nitrogen per year to septic systems (Hoffman & Canace,2002).In a properly functioning septic system, nitrogen is converted to nitrate by biologicalactivity occurring in the soil horizon under system leaching fields. Oncenitrification processes are complete, nitrate is generally stable in groundwater, andsince it does not bond to soil, it migrates freely with groundwater (Hoffman &Canace, 2002). Some natural processes reduce nitrate levels in groundwater,including denitrification to nitrogen gas under specific conditions or nitrogen uptakeby vegetation; however, neither is considered a significant mitigating factor in thisinvestigation because denitrification to nitrogen gas occurs most readily inThe Chazen CompaniesApril 2006
<strong>Dutchess</strong> <strong>County</strong> <strong>Aquifer</strong> <strong>Recharge</strong>and <strong>Sustainable</strong> Rural Density Analysis Page 22anaerobic settings uncharacteristic of <strong>Dutchess</strong> <strong>County</strong> aquifers, and mostvegetative nitrate mitigation occurs when the water table is within 5 to 10 feet ofground level (from Schoonover & Williard, 2002), a condition generally existing in<strong>Dutchess</strong> <strong>County</strong> only near aquifer discharge locations including wetland andstream riparian areas.The concentration of nitrate in septic system effluent both at its point of releasefrom the septic system and at its point of mixing with an underlying aquifer hasbeen estimated by various investigators, and likely ranges between 30 and 50 mg/l(e.g. Horseley Witten Hegemann, 1992). Other investigators concentrate onidentifying the annual nitrate load to the aquifer rather than day-to-day effluentconcentrations because the later tends to increase as water conserving plumbingfixtures become increasingly prevalent and fluctuate more on a day-to-day basisbecause of varying domestic activities. A general estimate of annual nitrogenwaste discharge is 10 pounds of nitrogen waste per year per capita (Hoffman &Canace, 2002) As the nitrate impact of this concentrated release migrates awayfrom septic field areas it persists as a nitrate plume exceeding groundwater anddrinking water standards unless and until diluted by aquifer recharge.The essential components of a sustainable well and septic system density modelbased on nitrogen dilution, provides a general analog for approaches which couldalso be used to manage other conservative wastewater contaminants; however, nocomparable ratios to ensure potability of other constituents are yet known to beavailable. Therefore, nitrate modeling was used in this analysis.3.1 Review of Models and AssumptionsVarious nitrate dilution models have been described in published literature or havebeen applied by consultants working in <strong>Dutchess</strong> <strong>County</strong>.• The earliest known residential density model applied to <strong>Dutchess</strong> <strong>County</strong> isthat of Gerber (1982) who used a mass balancing equation to ensure thatsufficient recharge was available near each septic system to ensure dilutionof the wastewater concentration estimated to flow from each septic system.The formula and its conclusions are reproduced at Figure 5. Gerber’sestimated septic effluent concentration were 300 gallons per day conveying30 mg/l nitrate and Gerber’s target concentration after dilution by localaquifer recharge was 10 mg/l. The necessary number of acres of landcalculated by Gerber to provide the necessary nitrate dilution ranged from0.5 acres for areas with readily-recharged thick sand and gravel deposits to4.0 acres for areas with glacial-era lake deposits of silt and clay that allowminimal aquifer recharge. The strength in Gerber’s method is its simplicity.Weaknesses of the Gerber method include the use of a precise estimates ofThe Chazen CompaniesApril 2006
<strong>Dutchess</strong> <strong>County</strong> <strong>Aquifer</strong> <strong>Recharge</strong>and <strong>Sustainable</strong> Rural Density Analysis Page 23wastewater gallons and effluent concentrations both of which are subject tochange as conservation water fixtures become more common, use of a targetnitrate concentration of 10 mg/l rather than using a more conservative targetwhich ensures that wells will remain below rather than at the standard of 10mg/l, an accessible method to adjust the calculation based on householdoccupancy levels, and the lack of any consideration of impervious surfaces onor associated with the recommended acreages. A broader weakness with theGerber model is that, as published, it requires continued reference to hisgeologic terrain maps which no longer coincide with published NaturalResources Conservation Service (NRCS) soils maps.• In 1992, Horsley Witten & Hegemann completed nitrogen loading analysesassessing water quality threats to specific wells supporting centralizedcommunity water systems in <strong>Dutchess</strong> <strong>County</strong>. The study was not conductedto recommend individual septic system densities, but its consideration ofpotential sources of nitrogen contamination concluded that individual septicsystems were estimated to release 124 gallons of wastewater daily at aneffective concentration of 33 mg/l nitrate (Horsley Witten Hegemann, 1992).The nitrate concentration closely matched that of Gerber (1982) but theeffluent volume reaching the watertable sharply differed from that used byGerber. Where the Horsley, Witten & Hegemann report referenced aquiferrecharge rates, they appear to be based on the work by Gerber (1982).• In 1998 and 1999, The Chazen Companies recommended minor modificationsto Gerber’s calculations to ensure greater assurances that groundwaternitrate concentrations would reliably remain below 10 mg/l. The specificrecommendation was to replace Gerber’s groundwater quality target of 10mg/l with a planning objective of 5 mg/l. The Gerber target essentiallyconceded that the resulting distribution, or bell-curve, of actual groundwaterquality findings would fall both below and above the groundwater anddrinking water standards of 10 mg/l once full build-out was achieved. Toavoid this conclusion, Chazen recommended recalibrating the Gerber densitycalculation to a target output of 5 mg/l (Chazen, 1998, 1999). The changeeffectively doubled the recommended acreages provided by Gerber. No othermodifications to the Gerber model were proposed by the Chazen Companiesat that time. Chazen did suggest that localized recharge by water run-onfrom valley walls (see vocabulary discussion in Section 2.1.1) wassupplementing direct recharge along the steep valley walls in the HarlemValley. However, since most groundwater recharge occurs during lowintensitystorms which generate little runoff, the volume of suchsupplemental recharge may not be great as previously thought, and thesignificance of such run-on during heavy rains would likely result only inThe Chazen CompaniesApril 2006
<strong>Dutchess</strong> <strong>County</strong> <strong>Aquifer</strong> <strong>Recharge</strong>and <strong>Sustainable</strong> Rural Density Analysis Page 24near-stream interflow or quickflow recharge rather than significantadditional aquifer recharge.• Various investigators working primarily in New Jersey have developed adetailed groundwater recharge and nitrate dilution residential density modelfor use in the State of New Jersey (Charles, et al, 1993). The methods used toidentify recharge rates are addressed briefly in Section 2.1.2 of this report.The New Jersey density calculations are stipulated to apply to aquiferrecharge rates and aquifers in New Jersey and include additional variablesdescribed here to recommend sustainable well and septic densities.Specifically, the calculation recommends using a target nitrate concentrationof 5.2 mg/l to statistically ensure that the distribution or bell-curve ofprobable groundwater quality outcomes remains below 10 mg/l. Thecalculation avoids the vagaries of effluent concentration and volumeestimates by instead using a reference per capita waste generation factor of10 pounds of nitrate-nitrogen per person per year. Residential occupancyrates can thus also be addressed in the formula. Finally, the formulaincludes a natural-log variable interpreted from air photo evaluation ofdeveloped parcels of differing sizes to account for the inverse percentagerelationship between impervious surfaces and lot size. The New Jerseydensity formula is shown on Figure 4. This model is detailed and has beenpeer reviewed and so is judged to be one of the most defensibly developed ofthe formulae surveyed here. It is somewhat difficult to use becausesimultaneous solution of two variables in the calculation is required toidentify recommended acreages relative to a given recharge rate.• A nitrate-based residential density model applied by the New York RuralWater Association (NYRWA, 2005) uses general approaches from all priorinvestigations but separately calculates and then combines effluent dilutionand well recharge areas for each parcel. The effluent dilution area iscalculated using a target nitrate concentration of 5 mg/l and an averagehousehold wastewater discharge volume of 200 gallons daily at 40 mg/lnitrate, based on a typical household occupancy of 2.5 persons discharging 80gallons daily per capita. The additional well recharge area is specified basedon withdrawals of 250 gallons daily. It is not clear why the dilution acreagecannot meet both the dilution objective and the well recharge requirement.The NYRWA method adds an impervious surface factor from the USDA SoilConservation Service 1986 TR-55 small watershed Urban Hydrology programto reach final density recommendations. There is little discussion of thesource of recharge rates used in the NYRWA study but recharge rate valuesappear comparable to estimates developed by Gerber (1982).The Chazen CompaniesApril 2006
<strong>Dutchess</strong> <strong>County</strong> <strong>Aquifer</strong> <strong>Recharge</strong>and <strong>Sustainable</strong> Rural Density Analysis Page 253.2 <strong>Septic</strong> System Density Analysis for <strong>Dutchess</strong> <strong>County</strong>This study has adopted use of a variation of the NJ septic system densitycalculation with a modification to allow simpler, user-selected input of animpervious surface factor. The resulting method is shown and discussed below.A = 4.4186HM / CqR + IscWhereA = recommended minimum acres per system, in acresH = persons per systemM = pounds of nitrate-nitrogen per person per year, in poundsCq = Nitrate-nitrogen target average groundwaterconcentration, in mg/LR = Annual <strong>Recharge</strong> Rate, in inchesIsc = Impervious surface cover, in acres.Use of an Isc factor selected on a case-by-case basis rather than New Jersey’sautomatically-calculated standard is recommended for <strong>Dutchess</strong> <strong>County</strong>, not only tosimplify use of New Jersey’s mathematically complex model, but also to allow localanalysis and adjustment of the impervious surface factors for particular projectsites, impervious coverage allowances in local zoning, or to suit regional designallowances for road drainage design or other stormwater management approaches.Table 3 and the Executive Figure in this report use a default Isc factor of 0.1 acresper septic system for minimum average recommended parcel sizes and a factor of0.3 acres for minimum average regional densities. These factors are applied inTable 3 but the variables may be modified where warranted by site conditions.Table 3 summarizes the resulting recommended minimum septic system densitiesfor each Hydrologic Soil Group in <strong>Dutchess</strong> <strong>County</strong>’s 3 major watersheds and theTowns of Hyde Park, Rhinebeck and Red Hook. Recommended minimum averageparcel sizes and regional septic system densities assume roads with stormwatercontrols generally diverting runoff to surfacewater bodies and site design whichdoes not emphasize on-site recharge of runoff from driveways and roofs. Use ofdesign features which compensate for aquifer recharge lost due to impervioussurfaces offers potential opportunities or incentives for denser but still sustainableseptic system uses.The Chazen CompaniesApril 2006
<strong>Dutchess</strong> <strong>County</strong> <strong>Aquifer</strong> <strong>Recharge</strong>and <strong>Sustainable</strong> Rural Density Analysis Page 263.3 Conditions and ApplicationsVarious conditions apply to the present septic system density recommendations.These include the following:• <strong>Recharge</strong> rate estimates are based on best available stream hydrographrecords over a period of record of approximately 70 years, manuallycompleted baseflow separation analysis of median hydrograph flow years,consolidation of hydrologic soil groups, an approximation of typical long-termrainfall for <strong>Dutchess</strong> <strong>County</strong>’s three watersheds and northwest towns, andbest-fit calibration of data to identify approximate recharge rates.• In selecting a septic system density model, a planning target for groundwaternitrate concentrations from regional use of conventional septic systems of 5.2mg/l was selected to ensure that the vast majority of actual groundwaternitrate concentrations would vary around the target concentration such thatan anticipated natural divergence of actual values (e.g. the statistical bellcurveof possible outcomes) will remain below the drinking water standard of10 mg/l at the downgradient property line.• Additional sources of nitrate do exist but are not addressed by this septicsystem density model. Lawn chemical applications are frequently the nextmostcommon source of nitrate in aquifers in heavily settled areas. Ifproperly applied, lawn fertilizers are fully utilized by site vegetation andneed not contribute to elevated regional groundwater nitrate concentrations.Moreover, wastewater discharges are released at every home, not just thosethat elect to use law fertilizers and are released below the lawn level and socan only be partially and seasonally mitigated by vegetative uptake inlimited areas over septic system leaching fields. In contrast, elevated nitrateresulting from lawn fertilization can be readily addressed or mitigated bymodified practices and community best management practice education.Nitrate concentrations released from conventional septic systems can only bemitigated by dilution measures recommended here or by using more costlyadvanced onsite treatment facilities seldom considered for broad regional use.If advanced treatment unit septic systems are used in focused regions toeffectively reduce nitrate releases to groundwater, adjustments to the densitymodel could be considered since the effective per capita nitrate-nitrogenrelease per person to the groundwater would be reduced below 10 pounds peryear.• Density recommendations based on nitrate dilution rely on variousfundamental hydrogeologic and operational assumptions. These are listed indetail in Hoffman & Canace (2002). Most are judged to fully apply toThe Chazen CompaniesApril 2006
<strong>Dutchess</strong> <strong>County</strong> <strong>Aquifer</strong> <strong>Recharge</strong>and <strong>Sustainable</strong> Rural Density Analysis Page 27<strong>Dutchess</strong> <strong>County</strong> such that the model approach is judged to be applicable inall but rare circumstances throughout <strong>Dutchess</strong> <strong>County</strong>. These include:o Wastewater releases and on-site groundwater recharge occur in thesame aquifer and at least seasonally there is a high likelihood ofcomplete and uniform mixing of the two aspects. During wet periods,some components of wastewater and groundwater may leave sites asinterflow, but during dry seasons, both components will fully mix inthe common aquifer on or near the site. The model selected here maygenerally be considered to predict the average nitrate concentration inthe aquifer at the downgradient property line.o The only water available to dilute wastewater is on-site recharge. Theassumption ignores mixing of the plume with upgradient groundwatersince the calculation is intended for sub-regional applications (e.g.build-out, subdivision, or zoning district scale applications) wheredensity cannot rely on other areas to provide necessary dilution waterstreams.o Once in the aquifer, nitrate is effectively inert and not prone todecomposition by any methods. Dilution, therefore, is presently themost cost-effective quality management technique. This assumptionwould also apply to other wastewater constituents not prone tobiological breakdown (e.g. pharmaceutical residues, caffeine, etc.), butthe dilution calculations here have been applied only to nitrate.Within residential areas, nitrate is generally not selectively removedby root systems since upland depths to watertable during critical dryseasonperiods normally exceed at least 30 feet, only becomingshallower in riparian or near-wetland settings. A literature searchindicates that denitrification from vegetation normally only occurswhere the watertable is within 10 feet or less of grade (Schoonover &Williard, 2002)o There is a one-to-one correspondence between homes and disposalsystems. Where community septic systems are used, the numbers ofusers per system can easily be adjusted in the model calculation.o By adjusting the Impervious Surface Cover factor, the densitycalculation may be revised to address any beneficial on-site rechargedesign features (e.g. any Low Impact Development LID or other gooddesign features which enhance on-site recharge) or revised to reflectprecisely known or allowed impervious surface acreages from roofs,driveways and roadways. Where good design practices are used andThe Chazen CompaniesApril 2006
<strong>Dutchess</strong> <strong>County</strong> <strong>Aquifer</strong> <strong>Recharge</strong>and <strong>Sustainable</strong> Rural Density Analysis Page 28storm drainage does not intentionally channel roof, driveway and otherrunoff away from the site, most precipitation may continue to rechargesites during lower-volume rain events by flowing to nearby lawn ornatural areas to recharge the underlying aquifer.o The model is not intended to accurately identify precise nitrateconcentrations along groundwater flow paths, but rather to addressbroader impact estimates of regional use of conventional septicsystems on aquifers also used to support domestic wells. The generalassumptions are judged to model conservative and realistic averagenitrate concentrations, but in doing so will underestimate nitrateconcentrations immediately downgradient of a system leaching fieldand overestimate nitrate concentrations in areas most distant from aleaching field plume.• The density recommendations found here do not preclude use of clustersubdivision models as recommended in the <strong>Dutchess</strong> <strong>County</strong> GreenwayConnections guide and many municipal zoning ordinances andComprehensive Plans. As long as overall site density objectives are met, andwith proper site design and engineering practices, the model will continue tomanage groundwater nitrate concentrations while allowing clusteredconstruction techniques. For example, in some cases, one could increase thelength of casing for added protection if clustered wells and septic systemsmust lie near one another, or quality risks may be reduced by locating wellsupgradient from septic systems, or wells may be sited in open space areas toprotect well water quality.• The present model derives ground water recharge rates from precipitationand steam-flow calibration data derived over an approximate period of up to70 years. This period accounts both for wet and drought periods and sorepresents long-term averages. Some investigators use specific droughtconditions, which could result in more conservative minimum parcel sizerecommendations, however, use of the extended period of record provides astrong record for use of typical effective aquifer recharge rates in <strong>Dutchess</strong><strong>County</strong>, and the baseflow method selected by the study is consideredsufficiently conservative to represent average recharge rates to the waterbearingaquifer formations supporting domestic wells without interference bymore ephemeral interflow recharge volumes.• Although in summer very little aquifer recharge occurs which can dilutewastewater nitrate concentrations, groundwater moves very slowly sosummer-time nitrate loads travel a long time before reaching a downgradientwell. This travel time is usually longer than a full summer, so the autumn,The Chazen CompaniesApril 2006
<strong>Dutchess</strong> <strong>County</strong> <strong>Aquifer</strong> <strong>Recharge</strong>and <strong>Sustainable</strong> Rural Density Analysis Page 29winter, and spring wet periods provide the necessary recharge and nitratedilution before a nitrate plume from one septic system will normally reach anadjoining downgradient well assuming typical geology and adherence to theaverage density recommendations found herein.• This model does not address yield reliability of wells, focusing instead onrecommending regional water balances needed to ensure potablegroundwater quality. The effect of the model, however, is to recommendlarge enough parcel densities that recharge volumes needed for dilutionpurposes also exceed normally rates of well-water consumption, thereforeeffectively providing a measure of protection preserving most well yieldsduring extended drought periods. In some cases, however, specific study willstill be required to ensure that well capacity needs can be met on sites.• Soil cover rather than bedrock formation is an effective predictor of netaquifer recharge. Surficial aquifers and other unconsolidated pore spaceprovides temporary storage retaining groundwater over buried bedrocksurfaces, facilitating recharge to the underlying deeper aquifer zonesnormally intersected by domestic wells. Neither recharge nor septic systemwastewater releases are observed seeping directly into streams during dryperiods, verifying that during all but the wettest periods, a majority ofrecharge passing through soils reaches the underlying aquifer.• This study does not factor in changes in aquifer recharge that might beattributable to slopes. <strong>Recharge</strong> values during the low-intensity stormsresponsible for most aquifer recharge does not generate much runoff so evenprecipitation on steep slopes is able to penetrate into the ground.• No correction factors have been applied to calibration data to account forexisting land uses in <strong>Dutchess</strong> <strong>County</strong>. This is because the vast majority ofland uses in the Wappinger Creek, Tenmile River, and Fishkill/Sprout Creekwatersheds, with potential exception of lower-watershed portions of theFishkill watershed including the Village of Fishkill, remain substantially inconditions of open land or residential development with impermeabilitycoverage of less than 15 percent. Under such conditions, stormwater peaks(which are not the subject of this study) may be increasing due to more rapidtimes of runoff concentration; however, overall runoff volumes generally donot substantially increase relative to pre-development natural conditionsduring the more routine rainfalls events of under 1.25 inch which provide upto 80 percent of annual recharge (Charles, et al, 1993; Chazen March 2006).Until regional impervious surface coverage increases markedly, soilinfiltration capacity rather than present land uses is judged to be theThe Chazen CompaniesApril 2006
<strong>Dutchess</strong> <strong>County</strong> <strong>Aquifer</strong> <strong>Recharge</strong>and <strong>Sustainable</strong> Rural Density Analysis Page 30principal ranking parameter for recharge capacity (Hoffman & Canace,2002).• This investigation does not include overt factors for evaluating the potentialimpacts of global warming. If, as has been outlined and/or predicted in otherprofessional literature, future rainfall patterns become more torrential withlonger periods without precipitation between heavy rains, recharge rates willdecline since a majority of present recharge is normally attributed to lesstorrential rainfalls. The present model is nonetheless somewhat conservativein its use of a 5.2 mg/l nitrate planning target, allowing some latitude tocompensate for precipitation pattern changes; however, the presentrecommendations may cease to be adequately protective of the quality ofgroundwater if extreme weather pattern shifts occur.• Less than 2 percent of <strong>Dutchess</strong> <strong>County</strong> underlies existing urban orresidential centers which have received no NRCS hydrologic soil groupassignment (Table 2 and Figure 6). To calibrate the present model andresulting estimates, this study assigned these soils to the HSG B ratingssince much early development of urban centers in <strong>Dutchess</strong> <strong>County</strong> occurredover the <strong>County</strong>’s more permeable soils, judged arbitrarily to likely fall mostcommonly in the hydrologic soil group B category. If investigations of theselimited developed areas are needed, hydrogeologists or soil scientists shouldbe able to assign more precise hydrologic soil groups based on topography,surficial geologic maps or older soils maps. Some of these unassigned areasare also known to be open water bodies.The Chazen CompaniesApril 2006
<strong>Dutchess</strong> <strong>County</strong> <strong>Aquifer</strong> <strong>Recharge</strong>and <strong>Sustainable</strong> Rural Density Analysis Page 314.0 RELATED TOPICS FOR FUTURE WORKAnalysis summarized in this investigation provides aquifer recharge data andsustainable septic system density recommendations with various immediateapplications. Additional areas of investigation have been identified here whichcould build on or supplement the present work. Examples of such future workincludes:• Analysis of groundwater quality in existing developed neighborhoodsthroughout <strong>Dutchess</strong> <strong>County</strong>. Securing such data may help identify existingconcentrations of nitrate and other conservative (persistent) wastewaterconstituents in groundwater. The septic system density calculations found inthis report reflect calibration by mass balance approaches and are supportedby reference data documented in aquifers in New Jersey; notwithstanding,groundwater quality data from <strong>Dutchess</strong> <strong>County</strong> could help further calibratethe septic density recommendations provided here.• Guidance for parcel-scale development of cluster subdivisions. Projects maymeet the overall density recommendations provided by this study, but willrequire close design consideration when wells and septic systems arepositioned closely in a cluster or conservation subdivision on a parent parcel.• Preparation of water budget estimates for existing or proposed projects. Theaquifer recharge data developed by this report will contribute to rechargeanalysis often provided with aquifer pumping test reports or with water usestudies for new projects. <strong>Recharge</strong> data provided by this report will supportwater budget analyses at such project sites, and so help predict potential offsiteimpacts to other wells, or streams, wetlands, and associated habitatareas.• Preparation of Municipal groundwater resource plans. The aquifer rechargerate estimates developed by this study and the interflow recharge rateestimates also recently developed by Chazen (March 2006) for the WappingerCreek watershed will provide essential background for evaluations ofgroundwater recharge and availability in municipal groundwater planningstudies.• Minimum stream baseflow studies. Habitat and minimum stream-flowevaluations will benefit from the baseflow data developed in this report,helping identify critical minimum baseflow needs for stream flowpreservation. Where off-site habitat impacts are assessed, the interflow asThe Chazen CompaniesApril 2006
<strong>Dutchess</strong> <strong>County</strong> <strong>Aquifer</strong> <strong>Recharge</strong>and <strong>Sustainable</strong> Rural Density Analysis Page 32well as aquifer recharge baseflow components will be needed (Chazen, March2006).• Stormwater management design. Baseflow discharge to streams is reducedby not only human water consumption but also as a result of stormwatermanagement designs which route all water from impervious surfaces directlyto streams. Data found in this report and a recent study of the WappingerCreek watershed (Chazen, March 2006) may contribute to stormwatermanagement planning as it relates to stream flow protection initiatives.• Precipitation Trend and <strong>Aquifer</strong> <strong>Recharge</strong> Rate Analysis. Impacts of globalwarming on precipitation patterns and hence aquifer recharge rates is poorlyunderstood and a subject of future consideration to ensure viability ofgroundwater supplies under changing climatic conditions.• Provision of <strong>Recharge</strong> Enhancement Protocols. The present study points tothe importance of aquifer recharge not only as a source of water supply towells but as a source of dilution for below-grade wastewater discharges.Opportunities or measures which enhance recharge will contribute tosustainability of potable groundwater sources of water supply and may allowgreater density of septic system installations. Density bonuses calculatedinterpreting the septic density formula introduced in this report may beprovided where such measures are employed. Protocols to ensureintroduction of clean water to the subsurface will also be necessary.• Exploration of Advanced <strong>Septic</strong> System Treatment Designs and Uses: <strong>Septic</strong>system modifications which reduce nitrate loading to aquifers would requireless dilution capacity from aquifers, admitting the possibility of smalleraverage minimum parcel sizes. <strong>Septic</strong> system treatment districts using suchmodifications could potentially avoid use of central water or central sewagetreatment while still allowing smaller average parcel sizes.The Chazen CompaniesApril 2006
<strong>Dutchess</strong> <strong>County</strong> <strong>Aquifer</strong> <strong>Recharge</strong>and <strong>Sustainable</strong> Rural Density Analysis Page 335.0 REFERENCESBrandes, D., Hoffmann, J.G., Mangarillo, J.T., 2005. Base Flow Recession <strong>Rates</strong>,Low Flows, and Hydrologic Features of Small Watersheds in Pennsylvania, USA. inJournal of the American water Resources Association, Vol 41, No 5, October 2005,pages 1177-1186.Cervione Jr., M., Mazaferro, D.L., Melvin, R.L., Water Resources Inventory ofConnecticut. 1972. Part 6, Upper Housatonic River Basin, USGS Connecticut WaterResources Bulletin No. 21.Charles, E.G., Behroozi, C., Schooley, J., Hoffman, J.L., 1993. A Method forEvaluating Ground-Water-<strong>Recharge</strong> Areas in New Jersey. New Jersey GeologicalSurvey Geological Survey Report GSR-32. 95 p.Chazen Companies, The. 1998. Water Resource Assessment for the Town of Dover.For the Town of Dover.Chazen Companies, The. 1999. Harlem Valley Watershed Investigation, <strong>Dutchess</strong><strong>County</strong>, NY. For the Town of Dover and <strong>Dutchess</strong> <strong>County</strong> Water & WastewaterAuthority.Chazen Companies, The, 2003, <strong>County</strong>-wide Groundwater Monitoring Program,2002 Annual Report, <strong>Dutchess</strong> <strong>County</strong>, prepared for the <strong>Dutchess</strong> <strong>County</strong> Water &Wastewater Authority.Chazen Companies, The, March 2006, Wappinger Creek Watershed Groundwater<strong>Recharge</strong> and Stream Baseflow Evaluation Assessment, Wappinger CreekIntermunicipal Counsel.de Vries, J.J., Simmers, I., 2002, Groundwater recharge: an overview of processesand challenges, in Hydrogeology Journal, Vol 10, No. 1, February 2002, pages 5-17.Gerber, R. 1982, Final Report: Water Resources Study for <strong>Dutchess</strong> <strong>County</strong>. For<strong>Dutchess</strong> <strong>County</strong> Department of Planning. 40 p. and various maps on file the<strong>Dutchess</strong> <strong>County</strong>.Hiscock, K., 2004. Hydrogeology: Principles and Practice. Blackwell Publishing, 389p., Malden MA.The Chazen CompaniesApril 2006
<strong>Dutchess</strong> <strong>County</strong> <strong>Aquifer</strong> <strong>Recharge</strong>and <strong>Sustainable</strong> Rural Density Analysis Page 34Hoffman, J.L., 1999, New Jersey Geological Survey, Technical Memorandum 99-1(supplement to GSR 32: A method for evaluating ground-water-recharge areas inNew Jersey).Hoffman, J.L., Canace, R.J., 2002, A <strong>Recharge</strong>-Based Nitrate-Dilution Model forNew Jersey, New Jersey Geological Survey and New Jersey Department ofEnvironmental Protection. 8/12/02 draft.Horsley Witten Hegemann, Inc., 1992. Water Supply Protection Program for<strong>Dutchess</strong> <strong>County</strong>, New York. For <strong>Dutchess</strong> <strong>County</strong> Water & Wastewater Authority.New York Rural Water Authority, 2005. Draft Ground Water Protection Plan for theTown of Saugerties. May 2005.Posten, S.E., 1984, Estimation of Mean Groundwater Runoff in Hard-rock <strong>Aquifer</strong>sof New Jersey: Columbia University Seminar Series on Pollution and WaterResources, v. 16, Halaski-Kun, G.J., editor, Pergamon Press, NY, p. 109-154.Randall, A. 1996. Mean Annual Runoff, Precipitation, and Evapotranspiration inthe Glaciated Northeastern United States, 1951-80, USGS Open-file report 96-395.Rutledge, A.T., 1998, Computer Programs for Describing the Recession of GroundwaterDischarge and for Estimating Mean Ground-water <strong>Recharge</strong> and Dischargefrom Streamflow Data – update. USGS Water-Resource Investigation Report 98,4148:43.Scanlon, B.R., Healy, R.W., Cook, P.G., 2002. Choosing appropriate techniques forquantifying groundwater recharge, in Hydrogeology Journal, Vol 10, No. 1,February 2002, pages 18-39.Schoonover, J.E., Williard, K.W.J, 2002. Ground Water Nitrate Reduction in GiantCane and Forest Riparian Buffer Zones, in Journal of the American WaterResources Association. Vol 39, No. 2, pages 347-353.Snavely, D., 1980, Ground-water appraisal of the Fishkill-Beacon Area, <strong>Dutchess</strong><strong>County</strong>, NY. US Geological Survey. Water Resources Investigation Open-FileReport 80-437. 14 p.Wolcott, S.W., Snow, R.F. 1995. Computation of Bedrock-<strong>Aquifer</strong> <strong>Recharge</strong> innorthern Westchester <strong>County</strong>, NY and Chemical Quality of Water from SelectedBedrock Wells. USGS. Water Resources Investigations Report 92-4157.The Chazen CompaniesApril 2006
Tables
Table 1 - <strong>Aquifer</strong> DischargeBaseflow Separation in <strong>Dutchess</strong> <strong>County</strong> WatershedsWatershedWappinger CreekTenmile RiverFishkill & SproutCreekYearTotalBaseflowAverage cfs/day Average cfs/day% <strong>Aquifer</strong>Baseflow1933 269.69 126.34 46.8%1943 247.18 135.24 54.7%1948 263.08 122.16 46.4%1956 260.95 135.24 51.8%1961 254.27 125.00 49.2%1978 232.39 113.55 48.9%1982 258.44 129.16 50.0%1986 264.69 126.71 47.9%1993 260.48 118.12 45.3%1998 245.90 138.65 56.4%Average 256 127 49.7%1933 286.48 159.33 55.6%1943 308.88 167.08 54.1%1948 298.87 161.69 54.1%1956 302.41 159.26 52.7%1961 301.21 171.53 56.9%1978 291.57 153.64 52.7%1982 298.57 152.91 51.2%1986 288.32 145.86 50.6%1993 306.45 159.37 52.0%1998 279.81 152.89 54.6%Average 296 158 53.5%1948 291.90 123.60 42.3%1956 304.33 170.01 55.9%1961 273.33 147.38 53.9%Average 290 147 50.7%Baseflow separations were conducted using methods defined by Posten (1984) to identify annualtotal aquifer discharge contribution to annual flow volume of the Wappinger and TenMile watershedsduring average flow years from the available periods of record. The Fishkill Creek period of record isshorter than that of the other two watersheds so only Fishkill Creek years matching flow yearsselected for the Tenmile River and Wappinger Creek longer period of record were analyzed.The Chazen CompaniesApril 2006
Table 2 - <strong>Aquifer</strong> <strong>Recharge</strong> <strong>Rates</strong>by Watershed/Region and Hydrogeologic Soil GroupAnnualBaseflowcfs/day (fromseperation)Actual inchesannual rechargeacres %aquifer recharge 1(inches/year)<strong>Aquifer</strong> <strong>Recharge</strong> <strong>Rates</strong> - Hydrologic Soil Group AnalysesA and A/D B C and C/D D and otheracres %aquifer recharge 1(inches/year)acres %aquifer recharge 1(inches/year)Dacres%aquifer recharge 1(inches/year)other %recharge rate 1(inches/year)Totalwatershed(acres)Fishkill Watershed 147 10.50 16,030 13% 19.2 34,034 28% 14.0 63,220 52% 7.2 5,554 5% 4.0 2,357 2% 14.0 121,600 10.65Wappinger Watershed 127 9.53 14,082 12% 18.2 28,472 25% 13.3 64,080 55% 6.8 8,169 7% 3.8 178 0% 13.3 115,840 9.56Tenmile Watershed 158 10.59 5,065 4% 20.2 43,678 34% 14.7 71,266 55% 7.6 8,459 7% 4.2 1,931 1% 14.7 129,920 10.37WEIGHTED AVERAGES 2 N/A 10.23 11% 19.0 29% 14.1 54% 7.2 6% 4.0 2% 14.3 10.20Northwest Municipalities 3 17.3 12.6 6.5 3.6 12.6Predicted inches annualrecharge from shadedrecharge ratesNotes:1. <strong>Aquifer</strong> recharge rate variations between the Wappinger, Fishkill and Tenmile watersheds reflect percentage precipitation differencesas follows: Wappinger Creek recharge (95% of Fishkill ); Tenmile River recharge:(105% of Fishkill)2. Weighted aquifer recharge rate averages for the Fishkill, Wappinger and Tenmile watersheds3. <strong>Aquifer</strong> recharge rates for Hyde Park, Rhinebeck and Red Hook and enclosed villages are projected from calibrated rates above,proportionally adjusted to 90% of Fishkill watershed aquifer recharge rates based on 90% precipitation rates.Portions of Milan and Pine Plains north of the Wappinger Creek watershed are expected to have aquifer recharge valuescomparable to those within the Wappinger watershed.Portions of the Town of Poughkeepsie west of the Wappinger Creek watershed are expected to have aquifer recharge valuescomparable to those within the Wappinger watershed.Portions of the Town of Wappinger west of the Fishkill Creek watershed are expected to have aquifer recharge valuescomparable to those within the Fishkill watershed.The Chazen CompaniesApril 2006
Table 3 - Recommended Minimum Average <strong>Septic</strong> System DensitiesHydrologic Soil Groups:Region (Municipalities)Fishkill Watershed (part-LaGrange, UnionVale, Wappinger, Beekman, Fishkill, EastFishkill)Wappinger Watershed (Milan, Pine Plains,Clinton, Stanford, Pleasant Valley,Washington, Millbrook, LaGrange,Poughkeepsie, Wappinger, WappingersFalls)Tenmile Watershed (Northeast, Millerton,Amenia, Dover, Pawling)Northwest Municipalities (Hyde Park,Rhinebeck, Red Hook)Acres per System - Recommended Minimum Average Acreage per <strong>Septic</strong> SystemA and A/D B C and C/D DAverage Min.Parcel Size*RegionalDensity**Average Min.Parcel Size*RegionalDensity**Average Min.Parcel Size*RegionalDensity**Average Min.Parcel Size*RegionalDensity**1.3 1.5 1.7 1.9 3.2 3.4 5.6 5.81.3 1.5 1.8 2.0 3.3 3.5 5.9 6.11.2 1.4 1.6 1.8 3.0 3.2 5.4 5.61.4 1.6 1.9 2.1 3.5 3.7 6.2 6.4Governing Formulas*Average Minimum Parcel Size includes 0.1 acre allowance for impervious surfaces:A = 4.4186HM / CqR + Isc (where Isc = 0.1 acre)** Regional Density includes 0.1 acre allowance for site, plus 0.2 acre allowance for road: A = 4.4186HM / CqR + Isc (where Isc = 0.3 acre)Selected Inputs to Governing Formulas:Occupancy Rate (H): 2.6 Persons/household (2000 <strong>Dutchess</strong> <strong>County</strong> average)Nitrate Discharge (M) 10.0 Annual pounds per year per personTarget GW concentration (Cq): 5.2 mg/L, NitrateNatural <strong>Recharge</strong> rate (R): (see Table 2) Inches per yearImpervious allowance per parcels (Isc): 0.10 Acres per developed parcel, including roofs, driveways and other onsite impervious areas.Impervious allowance for region (Isc): 0.30 Acres associated with each developed parcel, including roofs, driveways, etc. PLUS a share of new roads.In general, most applications of this analysis will focus on the average minimum parcel size recommendation (shaded values).Some investigations consider overall regional density (clear values).The Chazen CompaniesApril 2006
Figures
TivoliRed HookRed HookMilanPine PlainsMillertonRhinebeckRhinebeckNortheast38Stanford46ClintonWappinger CreekWatershed4840AmeniaHyde ParkPleasant ValleyWashingtonMillbrookTenmile RiverWatershedPoughkeepsie42PoughkeepsieLa GrangeUnion ValeDoverWappingers FallsWappingerFishkill42Fishkill CreekWatershedEast FishkillBeekman44PawlingPawlingBeaconFishkill46Legend40Mean Annual Precipitation Isopleths, inchesMajor Streams and RiversGlacial Fluvial Sand, Gravel Silt or Clay DepositsWatershed BoundariesENGINEERS/SURVEYORSPLANNERSENVIRONMENTAL SCIENTISTS<strong>Dutchess</strong> <strong>County</strong> Office:21 Fox St. Poughkeepsie, NY 12601Phone: (845) 454-3980Orange <strong>County</strong> Office:356 Meadow Ave. Newburgh, NY 12550Capital District Office:547 River Street Troy, NY 12180Glens Falls Office:110 Glen Street Glens Falls, NY 1280140130.00-old\20060429_USGS_Prec_Watershed.mxd) 4/27/2006FIGURE 1 - DUTCHESS COUNTY WATERSHEDS,PRECIPITATION AND GEOLOGY<strong>Dutchess</strong> <strong>County</strong>, New YorkPrecipitation Source: USGS Mean annual runoff, precipitation, and evapotranspirationin the glacial northeastern United States, 1951-1980Date:April 2006Scale:Not To ScaleProject #:40130.00
LegendHydrologic Soil GroupsotherABCA/DC/DDLegendUpland Bedrock and Glacial TillValley Glacial Fluvial Sand, Gravel or Clay DepositsDecimal Degrees0.00150.0030.006 0.0090.012Engineers/SurveyorsPlannersEnvironmental ScientistsGIS Consultants<strong>Dutchess</strong> <strong>County</strong> Office:21 Fox StreetPoughkeepsie, New York 12601Phone: (845) 454-3980CHAZEN ENGINEERING & LAND SURVEYING CO., P.C.Orange <strong>County</strong> Office:356 Meadow AvenueNewburgh, New York 12550Phone: (845) 567-1133Capital District Office:547 River StreetTroy, New York 12180Phone: (518) 273-0055North Country Office:110 Glen StreetGlens Falls, New York 12801Phone: (518) 812-0513This map is a product of The Chazen Companies. It should be used for reference purposes only. Reasonable efforts have been made to ensure the accuracyof this map. The Chazen Companies expressly disclaims any responsibilities or liabilities from the use of this map for any purpose other than its intended use.Sources: <strong>Dutchess</strong> <strong>County</strong> Soil Survey.Surficial Geology Interperated from NYSSurficial Geology MapNote: Sample area taken from Town ofPine PlainsFIGURE 2 - DETAIL OFHYDROLOGIC SOILGROUPS AND SURFICIALGEOLOGYCreated by:STFDate:April 2006Scale:1 in equals 5,000 ftProject #:40130.0040130.00-old\20060426_40130_WappingersCreek_SoilComparison.mxd) 4/27/2006
Period of Record for Figure 1 Precipitation Isopleths1951 Figure XX Precipitation and Streamflow1980200600500150Annual Precipitation (inches)100400300200Average Annual Streamflow (cfs)501000Precip. at DC Airport Fishkill Creek at Beacon Tenmile River Wappinger Creek at Red Oaks Mill Two Year Moving Average for Precipitation*0192219241926192819301932193419361938194019421944194619481950195219541956195819601962196419661968197019721974197619781980198219841986198819901992199419961998200020022004Time* Moving Average Reflects Current and Prior Year.ENGINEERS/SURVEYORSPLANNERSENVIRONMENTAL SCIENTISTS<strong>Dutchess</strong> <strong>County</strong> Office:21 Fox St. Poughkeepsie, NY 12601Phone: (845) 454-3980Orange <strong>County</strong> Office:356 Meadow Avenue, Newburgh, NY 12550Capital District Office:547 River Street, Troy, NY 12182Glens Falls Office:110 Glen Street Glens Falls, NY 12801FIGURE 3 - DUTCHESS COUNTY ANNUALPRECIPITATION AND WATERSHED DISCHARGESource data: Raw USGS stream flow data. Fishkill data collection discontinued in 1967.Notes: Graphic presentation identifies relationship between annual two year average precipitation to annual streamflow (consisting of runoff and baseflow).Date:April 2006Scale:Not to ScaleProject #:40130.005/4/2006
Graphic Solution of New Jersey's Nitrate Dilution Model Using Selected Varables Listed Below and a Default Allowance of +/- 0.2 to 0.35 AcresImpervious Area per <strong>Septic</strong> System.Governing FormulaR=4.4186HM/(CA(1 - 0.179A 0.5708 ))R = <strong>Aquifer</strong> <strong>Recharge</strong> in inches per yearA = Calculated minimum regional septic system density in acres per systemC = Target groundwater nitrate concentration, 5.2 mg/L nitrate-nitrogenM = Per capita nitrate loading, 10 pounds nitrate-nitrogen per person/yearH = 3 persons per system (home)ENGINEERS/SURVEYORSPLANNERSENVIRONMENTAL SCIENTISTS<strong>Dutchess</strong> <strong>County</strong> Office:21 Fox St. Poughkeepsie, NY 12601Phone: (845) 454-3980Orange <strong>County</strong> Office:356 Meadow Avenue, Newburgh, NY 12550Capital District Office:547 River Street, Troy, NY 12182Glens Falls Office:110 Glen Street Glens Falls, NY 12801FIGURE 4 - NEW JERSEY SEPTIC SYSTEM DENSITYSource data: NJGS/NJDEP Technical guidance recharge-based Nitrate-Dilution Model for New Jersey, 8/02Date:April 2006Scale:Not to ScaleProject #:40130.00
Allowable Residential Densities for Homes on <strong>Septic</strong> Tanks as Limited by Water Quality ImpactsENGINEERS/SURVEYORSPLANNERSENVIRONMENTAL SCIENTISTS<strong>Dutchess</strong> <strong>County</strong> Office:21 Fox St. Poughkeepsie, NY 12601Phone: (845) 454-3980Orange <strong>County</strong> Office:356 Meadow Avenue, Newburgh, NY 12550Capital District Office:547 River Street, Troy, NY 12182Glens Falls Office:110 Glen Street Glens Falls, NY 12801FIGURE 5-GERBER NITRATE DILUTION MODELSource data: <strong>Dutchess</strong> <strong>County</strong> Department of Planning Water Resources Study for <strong>Dutchess</strong> <strong>County</strong>, 1982Date:April 2006Scale:Not to ScaleProject #:40130.00
FishkillRed HookMilanPine PlainsMillertonCreated by:STFDate:April 2006Scale:Not To ScaleProject #:40130.00TivoliRhinebeckRhinebeckHyde ParkPoughkeepsiePoughkeepsieWappingers FallsWappingerBeacon FishkillClintonPleasant ValleyLa GrangeEast FishkillNortheastStanfordWashingtonAmeniaMillbrookUnion ValeDoverBeekmanPawlingPawlingLegendWaterbodies/UnclassifiedA and A/D SoilsBC and C/DDEngineers/SurveyorsPlannersEnvironmental ScientistsGIS Consultants<strong>Dutchess</strong> <strong>County</strong> Office:21 Fox StreetPoughkeepsie, New York 12601Phone: (845) 454-3980CHAZEN ENGINEERING & LAND SURVEYING CO., P.C.Orange <strong>County</strong> Office:356 Meadow AvenueNewburgh, New York 12550Phone: (845) 567-1133Capital District Office:547 River StreetTroy, New York 12180Phone: (518) 273-0055North Country Office:110 Glen StreetGlens Falls, New York 12801Phone: (518) 812-0513This map is a product of The Chazen Companies. It should be used for reference purposes only. Reasonable efforts have been made to ensure the accuracyof this map. The Chazen Companies expressly disclaims any responsibilities or liabilities from the use of this map for any purpose other than its intended use.FIGURE 6 - DUTCHESSCOUNTY HYDROLOGICSOIL GROUPSSource: United Stated Department of AgricultureSoil Survey of <strong>Dutchess</strong> <strong>County</strong>