Assessment of Nucleic Acid Purity - NanoDrop
Assessment of Nucleic Acid Purity - NanoDrop
Assessment of Nucleic Acid Purity - NanoDrop

You also want an ePaper? Increase the reach of your titles
YUMPU automatically turns print PDFs into web optimized ePapers that Google loves.
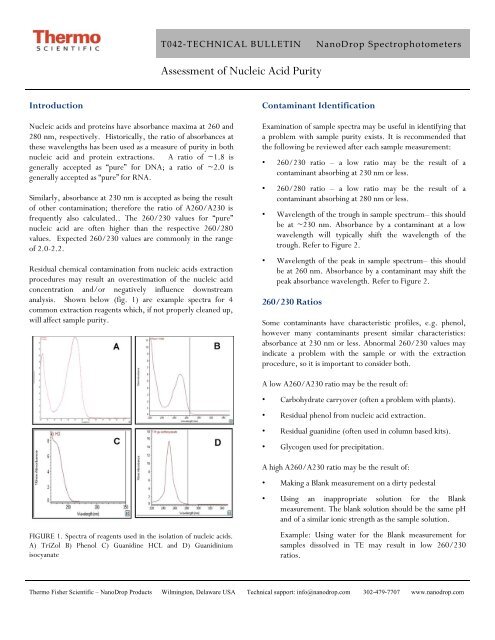
T042‐TECHNICAL BULLETIN<strong>NanoDrop</strong> Spectrophotometers<strong>Assessment</strong> <strong>of</strong> <strong>Nucleic</strong> <strong>Acid</strong> <strong>Purity</strong>Introduction<strong>Nucleic</strong> acids and proteins have absorbance maxima at 260 and280 nm, respectively. Historically, the ratio <strong>of</strong> absorbances atthese wavelengths has been used as a measure <strong>of</strong> purity in bothnucleic acid and protein extractions. A ratio <strong>of</strong> ~1.8 isgenerally accepted as “pure” for DNA; a ratio <strong>of</strong> ~2.0 isgenerally accepted as “pure” for RNA.Similarly, absorbance at 230 nm is accepted as being the result<strong>of</strong> other contamination; therefore the ratio <strong>of</strong> A260/A230 isfrequently also calculated.. The 260/230 values for “pure”nucleic acid are <strong>of</strong>ten higher than the respective 260/280values. Expected 260/230 values are commonly in the range<strong>of</strong> 2.0-2.2.Residual chemical contamination from nucleic acids extractionprocedures may result an overestimation <strong>of</strong> the nucleic acidconcentration and/or negatively influence downstreamanalysis. Shown below (fig. 1) are example spectra for 4common extraction reagents which, if not properly cleaned up,will affect sample purity.Contaminant IdentificationExamination <strong>of</strong> sample spectra may be useful in identifying thata problem with sample purity exists. It is recommended thatthe following be reviewed after each sample measurement:• 260/230 ratio – a low ratio may be the result <strong>of</strong> acontaminant absorbing at 230 nm or less.• 260/280 ratio – a low ratio may be the result <strong>of</strong> acontaminant absorbing at 280 nm or less.• Wavelength <strong>of</strong> the trough in sample spectrum– this shouldbe at ~230 nm. Absorbance by a contaminant at a lowwavelength will typically shift the wavelength <strong>of</strong> thetrough. Refer to Figure 2.• Wavelength <strong>of</strong> the peak in sample spectrum– this shouldbe at 260 nm. Absorbance by a contaminant may shift thepeak absorbance wavelength. Refer to Figure 2.260/230 RatiosSome contaminants have characteristic pr<strong>of</strong>iles, e.g. phenol,however many contaminants present similar characteristics:absorbance at 230 nm or less. Abnormal 260/230 values mayindicate a problem with the sample or with the extractionprocedure, so it is important to consider both.A low A260/A230 ratio may be the result <strong>of</strong>:• Carbohydrate carryover (<strong>of</strong>ten a problem with plants).• Residual phenol from nucleic acid extraction.• Residual guanidine (<strong>of</strong>ten used in column based kits).• Glycogen used for precipitation.FIGURE 1. Spectra <strong>of</strong> reagents used in the isolation <strong>of</strong> nucleic acids.A) TriZol B) Phenol C) Guanidine HCL and D) GuanidiniumisocyanateA high A260/A230 ratio may be the result <strong>of</strong>:• Making a Blank measurement on a dirty pedestal• Using an inappropriate solution for the Blankmeasurement. The blank solution should be the same pHand <strong>of</strong> a similar ionic strength as the sample solution.Example: Using water for the Blank measurement forsamples dissolved in TE may result in low 260/230ratios.Thermo Fisher Scientific – <strong>NanoDrop</strong> Products Wilmington, Delaware USA Technical support: info@nanodrop.com 302-479-7707 www.nanodrop.com
2TECHNICAL NOTE<strong>NanoDrop</strong> Spectrophotometers260/280 RatiosChange in 260/280 RatiosAbnormal 260/280 ratios usually indicate that the sample iseither contaminated by protein or a reagent such as phenol orthat there was an issue with the measurement.A low A260/A280 ratio may be caused by:• Residual phenol or other reagent associated with theextraction protocol• A very low concentration( > 10 ng/ul).<strong>of</strong> nucleic acidHigh 260/280 purity ratios are not indicative <strong>of</strong> an issue.Although purity ratios and spectral pr<strong>of</strong>iles are importantindicators <strong>of</strong> sample quality, the best indicator <strong>of</strong> DNA or RNAquality is functionality in the downstream application <strong>of</strong>interest. If the purity ratio is significantly higher thanexpected, it is best to review the spectral pr<strong>of</strong>ile as a primarymeans <strong>of</strong> troubleshooting.It is important to note that there are occasions when the purityratios are within expected limits, yet there is a problem withthe sample.Shifts in Spectral Pr<strong>of</strong>ileSome researchers encounter a consistent 260/280 ratio changewhen switching from a standard cuvette spectrophotometer toa <strong>NanoDrop</strong> Spectrophotometer. The two main explanationsfor this observation are listed below:• Change in sample acidity: Small changes in the pH <strong>of</strong>the solution will cause the 260/280 to vary (1). <strong>Acid</strong>icsolutions will under-represent the 260/280 ratio by 0.2-0.3, while a basic solution will over-represent the ratio by0.2-0.3. If comparing results obtained using a <strong>NanoDrop</strong>Spectrophotometer to results obtained using otherspectrophotometers, it is important to ensure that the pH<strong>of</strong> an undiluted sample measured on our instruments is atthe same pH and ionic strength as the diluted samplemeasured on the conventional spectrophotometer.• Wavelength Accuracy <strong>of</strong> the SpectrophotometersAlthough the absorbance <strong>of</strong> a nucleic acid at 260 nm isgenerally on a plateau, the absorbance curve at 280 nm isquite steeply sloped. A slight shift in wavelength accuracywill have a large effect on 260/280 ratios. It is possible tosee as much as a 0.4 difference in the 260/280 ratio whenmeasuring the same nucleic acid sample on twospectrophotometers that are both within a 1 nmwavelength accuracy specification.ConclusionThe use <strong>of</strong> a Thermo Scientific <strong>NanoDrop</strong> spectrophotometerto QC nucleic acid samples can result in significant savings intime and money. The micro volume capability <strong>of</strong><strong>NanoDrop</strong> spectrophotometers allow the researcher toquickly and easily run quality control checks <strong>of</strong> nucleic acid andprotein samples. In addition, the instrument’s shortmeasurement cycle and general ease <strong>of</strong> use greatly increases therate at which samples can be processed, making it possible toimplement multiple quality control checks throughout aprocedure or process.ReferenceFIGURE 2. Spectra <strong>of</strong> purified DNA without contamination (A), and<strong>of</strong> the same DNA sample contaminated with guanidine (B) andphenol (C).1) William W. Wilfinger, Karol Mackey, and Piotr Chomczynski,Effect <strong>of</strong> pH and Ionic Strength on the Spectrophotometric<strong>Assessment</strong> <strong>of</strong> <strong>Nucleic</strong> <strong>Acid</strong> <strong>Purity</strong>: BioTechniques 22:474-481(March 1997)T042 Rev 1/11Thermo Fisher Scientific – <strong>NanoDrop</strong> Products Wilmington, Delaware USA Technical support: info@nanodrop.com 302-479-7707 www.nanodrop.com