Snow, ice and Permafrost Science + Geomorphology
Snow, ice and Permafrost Science + Geomorphology
Snow, ice and Permafrost Science + Geomorphology

You also want an ePaper? Increase the reach of your titles
YUMPU automatically turns print PDFs into web optimized ePapers that Google loves.
Abstract Volume<br />
6 th Swiss Geoscience Meeting<br />
Lugano, 21 st – 23 rd November 2008<br />
Apply!<br />
Geosciences<br />
6th 6 Swiss Geoscience Meeting 2008 - Lugano<br />
th Swiss Geoscience Meeting 2008 - Lugano<br />
Institute of Earth <strong>Science</strong>s
1 2<br />
Symposium 6: Apply! <strong>Snow</strong>, <strong>ice</strong> <strong>and</strong> <strong>Permafrost</strong> <strong>Science</strong> + <strong>Geomorphology</strong><br />
6. Apply! <strong>Snow</strong>, <strong>ice</strong> <strong>and</strong> <strong>Permafrost</strong> <strong>Science</strong> +<br />
<strong>Geomorphology</strong> (Open Session)<br />
M. Hoelzle, A. Bauder, B. Krummenacher, C. Lambiel, M. Lüthi, M. Phillips, J. Schweizer,<br />
M. Schwikowski + M. Bollschweiler, G. R. Bezzola, R. Delaloye, C. Graf., N. Kuhn, E.<br />
Reynard<br />
Swiss <strong>Snow</strong>, Ice <strong>and</strong> <strong>Permafrost</strong> Society + Swiss Geomorphological Society<br />
6.1 Bauder A. & Huss M.: Long term point observations of seasonal mass balance: a key to underst<strong>and</strong>ing 20th century<br />
climate change<br />
6.2 Bodin X., Schoeneich P., Lhotellier R., Gruber S., Deline P., Ravanel L., Monnier S. : A first assessment of the permafrost<br />
distribution in the French Alps<br />
6.3 Caprez J., Maisch M., von Poschinger A. : The Flims Rockslide - 3D terrain modelling <strong>and</strong> volume calculations with<br />
GIS application<br />
6.4 Champagnac J.-D., Schlunegger F., Norton K., von Blanckenburg F., Abbühl L., Schwab M.: Erosion-driven uplift of the<br />
modern Central Alps<br />
6.5 Darms G. & Hoelzle M. : First results of firn temperature measurements in 2008 on Colle Gnifetti, Monte Rosa,<br />
Switzerl<strong>and</strong><br />
6.6 Fierz C. & Lehning M.: <strong>Snow</strong> temperatures: measurement <strong>and</strong> modelling<br />
6.7 Fischer L., Eisenbeiss H., Kääb A., Huggel C., Haeberli W.: Combined LiDAR <strong>and</strong> photogrammetry for stability-related<br />
change detection in glacierised <strong>and</strong> frozen rock walls - A case study in the Monte Rosa east face<br />
6.8 Fontana G., Scapozza C., Reynard E.: Lateglacial glacier evolution of the Greina region (Central Swiss Alps)<br />
6.9 Fontana G., Scapozza C., Reynard E. : Geomorphological map of the Greina region (Central Swiss Alps)<br />
6.10 Foppa N., Seiz G., Walterspiel J.: Observation of the Cryosphere – Switzerl<strong>and</strong>’s contribution to the Global Climate<br />
Observing System GCOS<br />
6.11 Frei E., Heggli M., Schneebeli M. : Replica method for three-dimensional X-ray microtomographic imaging of snow<br />
6.12 Frey H., Busarello C., Frauenfelder R., Haeberli W., Hoelzle M., May B., Rau S., Wagenbach D., Wagner S. : The <strong>ice</strong> ridge<br />
at Murtèl/Corvatsch: Studying a (c)old archive<br />
6.13 Hauck C. & Hilbich C.: Application of operational geophysical monitoring systems on alpine permafrost<br />
6.14 Heggli M., Köchle B., Pinzer B., Schneebeli M.: Thermal conductivity of snow: How to find a better parameterisation?<br />
6.15 Lambiel C., Scapozza C., Pieracci K., Baron L., Marescot L.: Thermal <strong>and</strong> electrical properties of a periglacial talus<br />
slope<br />
6.16 Linsbauer A., Paul F., Hoelzle M., Haeberli W.: Modelling of glacier bed topography from glacier outlines <strong>and</strong> DEM<br />
data in a GIS<br />
6.17 Lüthi M.: Transient response of idealized glaciers to climate variations<br />
6.18 Morard S. & Delaloye R.: Airflow velocity measurements in ventilated porous debris accumulations<br />
6.19 Pagano L. : Inventory of geomorphosites of Bavona <strong>and</strong> Rovana valleys (Ticino)<br />
6.20 Parisod J., Senn C., Pfeifer H.-R., Vennemann T. : Evaluation des effets de l’enneigement artificiel sur la chimie du sol<br />
par comparaison de l’effet de la neige naturelle, artificielle, avec et sans additif: Cas de Cran-Montana-Aminona,<br />
Valais, Suisse.
6.21 Paul F. & Haeberli W.: Spatial variability of glacier elevation changes in the Alps obtained from differencing two<br />
DEMs<br />
6.22 Paul F., Kääb A., Rott H., Shepherd A., Strozzi T. : GlobGlacier: A new ESA project to map the world’s glaciers from<br />
space<br />
6.23 Phillips M., Zenklusen Mutter E., Kern-Luetschg M.: Rapid permafrost degradation induced by non-conductive heat<br />
transfer within a talus slope at Flüela Pass, Swiss Alps.<br />
6.24 Roer I., Hoelzle M., Haeberli W., Kääb A.: Rockglacier dynamics in the Swiss Alps – comparing kinematics <strong>and</strong> thermal<br />
regimes in the Murtèl-Corvatsch region<br />
6.25 Scapozza C., Gex P., Lambiel C., Reynard E. : Electromagnetic prospecting in alpine permafrost: examples from the<br />
Southern Swiss Alps<br />
6.26 Scapozza C., Mari S., Valenti G., Strozzi T., Gex P., Fontana G., Müller G., Lambiel C., Delaloye R., Reynard E. : <strong>Permafrost</strong><br />
map of the Eastern Ticino Alps<br />
6.27 Theler D., Bardou E., Reynard E. : Conceptualising sediment cascades to enhance dynamic geomorphological mapping<br />
6.28 Worni R., Pulgarín B., Agudelo A., Huggel C. : Glacier volcano interactions <strong>and</strong> related hazards during the 2007 eruptive<br />
crisis at Nevado del Huila, Colombia<br />
6.29 Wüthrich C., Begert M., Scherrer S.C., Croci-Maspoli M., Appenzeller C., Weingartner R.: Analyses of newly digitised<br />
snow series over the last 100 years+ in Switzerl<strong>and</strong><br />
6.30 Zenklusen Mutter E., Phillips M., Blanchet J. : Evidence of warming in disturbed <strong>and</strong> undisturbed permafrost terrain<br />
at Schafberg (Pontresina, Eastern Swiss Alps)<br />
1 3<br />
Symposium 6: Apply! <strong>Snow</strong>, <strong>ice</strong> <strong>and</strong> <strong>Permafrost</strong> <strong>Science</strong> + <strong>Geomorphology</strong>
1<br />
Symposium 6: Apply! <strong>Snow</strong>, <strong>ice</strong> <strong>and</strong> <strong>Permafrost</strong> <strong>Science</strong> + <strong>Geomorphology</strong><br />
6.1<br />
Long term point observations of seasonal mass balance:<br />
a key to underst<strong>and</strong>ing 20th century climate change<br />
Bauder Andreas <strong>and</strong> Huss Matthias<br />
Versuchsanstalt für Wasserbau, Hydrologie <strong>and</strong> Glaziologie (VAW), ETH Zürich, Gloriastrasse 37-39, CH-8092 Zürich (bauder@vaw.baug.<br />
ethz.ch)<br />
Point observations of glacier surface mass balance at fixed locations directly reflect climatic variations <strong>and</strong> are not biased<br />
by uncertain spatial interpolation of mass balance or the change in glacier surface area. Thus, they are considered to be the<br />
best indicator for changes in the climatic forcing on glaciers (Vincent <strong>and</strong> others, 2004; Ohmura <strong>and</strong> others, 2007). Four long<br />
term time series of seasonal mass balance observations (Fig. 1) at fixed locations have been compiled for two stakes on<br />
Claridenfirn <strong>and</strong> one stake on Grosser Aletschgletscher <strong>and</strong> Silvrettagletscher, Switzerl<strong>and</strong>, all starting in 1914 (Huss <strong>and</strong><br />
Bauder, in press). These data represent the longest series of direct mass balance measurements worldwide.<br />
Using a mass balance model based on the temperature-index approach, the field observations are corrected for varying dates,<br />
inconsistency, systematic errors <strong>and</strong> data gaps. The resulting homogenized continuous 93-year time series from the three<br />
glaciers cover most of the 20th century <strong>and</strong> enable to investigate temporal, regional <strong>and</strong> altitudinal variability of mass balance<br />
<strong>and</strong> fluctuations in the climatic forcing on glaciers.<br />
Long term variations in mass balance are mainly driven by changes in summer ablation. Three stakes (Clariden, Silvretta)<br />
located near the equilibrium line display significantly lower summer balances in the mid 1960s to mid 1980s, whereas the<br />
high altitude site (Aletsch) shows opposite trends. Two periods of enhanced climatic forcing are detected, 1943-1953 <strong>and</strong><br />
1987-2007. At all stakes the energy consumed for melt was higher in the 1940s in spite of lower air temperatures than during<br />
the last two decades.<br />
Figure 1. Seasonal observations of point based net <strong>and</strong> winter balance since 1914 from four sites in the Swiss Alps.<br />
REFERENCES<br />
Huss, M. <strong>and</strong> Bauder, A. (in press). Twentieth century climate change inferred from four long≈term point observations of<br />
seasonal mass balance. Annals of Glaciology, 50.<br />
Ohmura, A., Bauder, A.,≈Müller, H. <strong>and</strong> Kappenberger, G. (2007). Long-term change of mass balance <strong>and</strong> the role of radiation,<br />
Annals of Glaciology, 46, 367--374.<br />
Vincent, C., Kappenberger, G., Valla, F., Bauder, A., Funk, M. <strong>and</strong> Le Meur, E. (2004). Influence of climate change over the<br />
20th Century on four French glacier mass balances. Geophysical Research Letters, 109, D10104. (10.1029/2003JD003857.)
6.2<br />
Towards a first assessment of the permafrost distribution in the French<br />
Alps<br />
Bodin X.*, Schoeneich P.*, Lhotellier R.*, Gruber S.**, Deline P.***, Ravanel L.***, Monnier S.****<br />
* Institut de Géographie Alpine, Université de Grenoble<br />
** Institut de Géographie, Université de Zurich<br />
*** EDYTEM, Université de Savoie<br />
**** Laboratoire de Géographie Physique, Université de Paris 12<br />
In mountain regions, permafrost is important for the geomorphology of high altitudes areas as well for the water resources<br />
of inhabited watersheds. Under the present Global Warming, the possible degradation of permafrost during the coming<br />
decades could hence provoke various kind of slope instability <strong>and</strong> change drastically the hydrological functioning (Kääb et<br />
al., 2006). A better underst<strong>and</strong>ing of the distribution of the permafrost is therefore a necessary prerequisite for further<br />
analysis <strong>and</strong> mitigation of those hazards.<br />
As permafrost is in most cases invisible <strong>and</strong>, though covering large areas, its distribution is largely unknown. Extensive<br />
permafrost “mapping” can be approached only through either empirical, statistical or physically based modelling<br />
(Riseborough et al., 2008). <strong>Permafrost</strong> maps have been produced this way for the Swiss Alps.<br />
As no such map existed yet for the French Alps, this paper thus intends to present an overview of the main available datasets<br />
on the presence of permafrost, in rockfaces as well within debris accumulations: inventories of geomorphological indicators<br />
(rockglaciers <strong>and</strong> other creeping l<strong>and</strong>forms related to the presence of ground <strong>ice</strong>) <strong>and</strong> in-situ measurements (BTS, geophysical<br />
soundings …).<br />
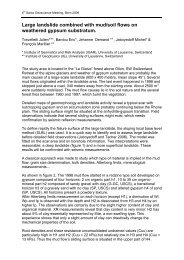
Among various types of available models, a statistico-empirical one has been set up: it is based on the relation between the<br />
two most important topoclimatic controls (solar radiation <strong>and</strong> air temperature) of the rockglaciers presence. This relation<br />
was computed on a lithologically, geomorphologically <strong>and</strong> climatically homogeneous small massif (Combeynot Massif, ≈ 45°<br />
N, 40km²) which presents numerous rockglaciers in various topoclimatic contexts (Bodin, 2007). Two versions of the model,<br />
one for the root of rockglaciers, one for their frontal part, have been combined to assess the potential presence of permafrost<br />
in the entire French Alps.<br />
Two validation procedures have been performed using independent rockglaciers inventories: one in the Mercantour Massif<br />
(lat. ≈ 44° N), one in the Vanoise Massif (lat. ≈ 45.5° N). The comparison between training set <strong>and</strong> validation set shows a good<br />
correspondence of the altitude <strong>and</strong> aspect of the actual rockglaciers <strong>and</strong> of the modelled front <strong>and</strong> root areas. Those first<br />
results are thus encouraging as they already provide to public <strong>and</strong> to decision-makers usable new information about permafrost<br />
presence in their territory. At fine scales (lower than the watershed), more investigations are nevertheless necessary to<br />
detect <strong>and</strong> characterise precisely the permafrost, either in debris accumulation or in rock-face.<br />
REFERENCES<br />
Bodin, X. 2007: Géodynamique du pergélisol de montagne : fonctionnement, distribution et évolution récente. L'exemple<br />
du massif du Combeynot (Hautes Alpes). PhD, Geography, University of Paris-Diderot Paris 7, 272 p.<br />
Kääb, A., M. Chiarle, B. Raup & C. Schneider. 2006: Climate change impacts on mountain glaciers <strong>and</strong> permafrost. Global<br />
<strong>and</strong> Planetary Change.<br />
Riseborough, D. W., N. I. Shiklamonov, B. Etzelmüller, S. Gruber & S. S. Marchenko. 2008: Recent advances in permafrost<br />
modeling. <strong>Permafrost</strong> <strong>and</strong> Periglacial Processes 19(2).<br />
1<br />
Symposium 6: Apply! <strong>Snow</strong>, <strong>ice</strong> <strong>and</strong> <strong>Permafrost</strong> <strong>Science</strong> + <strong>Geomorphology</strong>
1 6<br />
Symposium 6: Apply! <strong>Snow</strong>, <strong>ice</strong> <strong>and</strong> <strong>Permafrost</strong> <strong>Science</strong> + <strong>Geomorphology</strong><br />
Figure 1. Map of the potential permafrost distribution in the French Alps.
6.3<br />
The Flims Rockslide 3D terrain modelling <strong>and</strong> volume calculations with<br />
GIS-application<br />
Caprez Jürg*, Maisch Max*, von Poschinger Andreas**<br />
* Geographisches Institut, Universität Zürich-Irchel, Winterthurerstr. 190, CH-8057 Zürich, (j.caprez@geo.unizh.ch), (max.maisch@geo.uzh.ch)<br />
** LfU, Lazarettstr. 67, D-80636 München, (Andreas.Poschinger@lfu.bayern.de)<br />
The Flims rockslide is to be known as the largest mass movement in the Alps. Recent studies support the hypothesis of an<br />
early Holocene age of this mega-event by radiocarbon dates centred around cal. 9450 BP (Deplazes, Anselmetti & Hajdas<br />
2007). At that Preboreal time climate already has changed to warmer conditions <strong>and</strong> therefore a readvance of the main valley<br />
glacier of Vorderrhein as well as from small local glaciers can be excluded from having reworked the rockslide area<br />
(Poschinger et al. 2006). Despite of various new findings up to now the paleogeographic framework, especially the former<br />
shape of the pre-existing Flimserstein is poorly established.<br />
Based on geologic evidence (geol. maps, profiles) <strong>and</strong> geomorphologic considerations (i.e. extrapolation of slopes) in this<br />
study a new effort was made to rebuild <strong>and</strong> reconstruct the former 3D-topography of the Flims area within a GIS (Geographic<br />
Information System). This approach allows to determine with enhanced precision the dimensions of this extraordinary<br />
rockslide event <strong>and</strong> to reveal in more details the various processes involved.<br />
The 3D terrain models yielded a total volume ranging from 7 km 3 up to 7.3 km 3 for the breakout zone of the rockslide. The<br />
volume of the deposition zone on the other h<strong>and</strong> gave, according to different scenarios, values between 8.6 km 3 to 9.3 km 3 .<br />
In addition about 1.5 km 3 of the rockmass was eroded later on by the Vorderrhein river.<br />
During the Flims rockslide the pre-existing valley infill, supposedly saturated completely by water, was squeezed out <strong>and</strong><br />
mobilised between Sagens <strong>and</strong> Bonaduz, subsequently being deposited as a special facies type, known as ”Bonaduzer<br />
Schotter“ (Abele 1997). Approximately 20 percent of the alluvial valley fill was evacuated directly by the impact of the rockslide.<br />
Accordingly, the debris mass does not reach the basement of the Vorderrhein valley but seems to rest on a layer of relict<br />
alluvial sediments. The 3D-reconstructions of the Flims topography resulted also in modelling former lakes with their maximum<br />
levels, triggered <strong>and</strong> dammed by the rockslide event. Various 3D-visualizations of the study area certainly will launch<br />
fruitful discussions on the dynamics, the processes <strong>and</strong> the geologic consequences of this famous Flims event.<br />
REFERENCES<br />
Abele, G. 1997: Rockslide movement supported by the mobilisation of groundwater-saturated vally floor sediments.<br />
Zeitschrift für Geomorphologie, N.F., 41/1 , 1-20.<br />
Deplazes, G., Anselmetti, F. & Hajdas, I. 2007: Lake sediments deposited on the Flims rockslide mass: the key to date the<br />
largest mass movement of the Alps. Terra Nova, Vol 19, No. 4 , 252–258.<br />
Poschinger, A. v., Wassmer P. & Maisch, M. 2006: The Flims Rockslide: History of interpretation <strong>and</strong> new insights. In: Evans,<br />
S.G., Sacarascia-Mugnozza, G., Strom, A. & Hermanns, R.L. (eds.), Massive Rock Slope Failure. Kluwer Academic Publishers<br />
, 341-369.<br />
1<br />
Symposium 6: Apply! <strong>Snow</strong>, <strong>ice</strong> <strong>and</strong> <strong>Permafrost</strong> <strong>Science</strong> + <strong>Geomorphology</strong>
1 8<br />
Symposium 6: Apply! <strong>Snow</strong>, <strong>ice</strong> <strong>and</strong> <strong>Permafrost</strong> <strong>Science</strong> + <strong>Geomorphology</strong><br />
Figure 1: 3D-reconstructed terrain surface of the Pre-Flimserstein. a) Digital terrain model of the Flims rockslide area with the Flimserstein<br />
in the background <strong>and</strong> the partially eroded rock mass in the foreground. b) Reconstruction of the Pre-Flimserstein <strong>and</strong> the Vorderrhein<br />
valley before the rockslide event.<br />
6.<br />
Erosion-driven uplift of the modern Central Alps<br />
Champagnac Jean-Daniel*, Schlunegger Fritz **, Norton Kevin*, von Blanckenburg Friedhelm *, Abbühl Luca** & Schwab<br />
Marco**<br />
* Institut für Mineralogie, Universitat Hannover, Callinstrasse 1, D-30167 Hannover, champagnac@gmail.com<br />
** Institute of Geological <strong>Science</strong>s, University of Bern, Baltzerstrasse 1-3, CH-3012 Bern.<br />
We present a compilation of four sets of data of modern tectono-geomorphic processes in the Central Alps of Switzerl<strong>and</strong><br />
that appear to suggest that rock uplift is a response to climate-driven denudation in the absence of active convergence. These<br />
are (1) basin-averaged Late Holocene denudation rates determined from cosmogenic nuclides <strong>and</strong> from suspended river<br />
loads; these slightly exceed, but spatially mimic the pattern of rock uplift rates as determined by geodetic leveling; (2) the<br />
geodetic reference point is also the geomorphic base level with respect to erosion; we further present (3) a compilation of
modern plate motion velocities shows that the rotation pole of the Adriatic plate is located within the area, hence the area<br />
is not under convergence; finally (4), we illustrate that the Central Alps have acted as a closed system for Holocene sediment<br />
redistribution up to the peri-Alpine lakes which have operated as a sink for the erosion products of the inner Alps.<br />
While a variety of hypotheses have been put forward to explain the Central Alpine uplift (e.g. lithospheric forcing by convergence<br />
or mantle processes; <strong>ice</strong> melting) we show with a numerical isostatic model that the correlation between erosion <strong>and</strong><br />
crustal uplift rates reflects a positive feedback between denudation <strong>and</strong> the associated isostatic response to unloading.<br />
Therefore erosion does not passively respond to advection of crustal material as might be the case in actively converging<br />
orogens. Other forces need to be considered to drive surface erosion. We suggest that the geomorphic response of the Alpine<br />
topography to glacial erosion <strong>and</strong> the resulting disequilibrium for modern channelized <strong>and</strong> associated hillslope processes<br />
explains much of the pattern of modern denudation <strong>and</strong> hence rock uplift. Therefore, in a non-convergent orogen such as<br />
the Central European Alps, the observed vertical rock uplift is primarily a consequence of passive unloading due to erosion.<br />
REFERENCES:<br />
Anderson, H. <strong>and</strong> Jackson, J., 1987. Active tectonics in the Adriatic region. Geophysical Journal Royal Astronomical Society<br />
91, 937–983.<br />
Battaglia, M., Murray, M.H., Serpelloni, E. <strong>and</strong> Burgmann, R., 2004. The Adriatic region: An independent microplate within<br />
the Africa-Eurasia collision zone. Geophysical Research Letter 31, L09605, doi:10.1029/2004GL019723.<br />
Calais, E., Nocquet, J., Jouanne, F. <strong>and</strong> Tardy, M., 2002. Current strain regime in the Western Alps from continuous Global<br />
Positioning System measurements, 1996 – 2001. Geology 30, 651-654.<br />
Norton, K.P., von Blanckenburg, F., Schlunegger, F., Schwab, M. <strong>and</strong> Kubik, P.W., 2008. Cosmogenic nuclide-based<br />
investigation of spatial erosion <strong>and</strong> hillslope channel coupling in the transient forel<strong>and</strong> of the Swiss Alps.<br />
<strong>Geomorphology</strong>, 95, 474–486<br />
Wittmann, H., von Blanckenburg, F., Kruesmann, T., Norton, K.P., <strong>and</strong> Kubik, P., 2007. The relation between rock uplift <strong>and</strong><br />
denudation from cosmogenic nuclides in river sediment in the Central Alps of Switzerl<strong>and</strong>. Journal of Geophysical<br />
Research-Earth Surface 112, doi:10.1029/2006JF000729.<br />
1<br />
Symposium 6: Apply! <strong>Snow</strong>, <strong>ice</strong> <strong>and</strong> <strong>Permafrost</strong> <strong>Science</strong> + <strong>Geomorphology</strong>
180<br />
Symposium 6: Apply! <strong>Snow</strong>, <strong>ice</strong> <strong>and</strong> <strong>Permafrost</strong> <strong>Science</strong> + <strong>Geomorphology</strong><br />
6.<br />
First results of firn temperature measurements in 2008 on Colle Gnifetti,<br />
Monte Rosa, Switzerl<strong>and</strong><br />
Darms Gian*, Hoelzle Martin**<br />
*Glaciology, Geomorphodynamics & Geochronology, Department of Geography, University of Zurich, Winterthurerstrasse 190, CH-8057<br />
Zurich (gian.darms@gmail.com)<br />
**Department of Geosciences, University of Fribourg, Chémin de Musée 4, CH-1700 Fribourg<br />
(martin.hoelzle@unifr.ch)<br />
At the end of the 19th century <strong>and</strong> into the beginning of the 20th century, it was assumed that all glaciers in the Alps are<br />
temperate, although (Vallot 1893, 1913) observed in the Mont Blanc area that cold firn on high altitude mountain tops is<br />
widespread. In the 1950s, Fisher published several articles (1953, 1954, 1955, 1963) about cold firn observations in the Monte<br />
Rosa area as did Haefeli & Brentani (1955) for the Jungfrau area. In the 1970s (Lliboutry et al. 1976) <strong>and</strong> (Haeberli 1976) were<br />
the first scientists who systematically investigated the distribution of cold <strong>ice</strong> <strong>and</strong> firn in the Alps. In the last 20 years, research<br />
activities have started to increase in the cold high-mountain accumulation areas in the Alps, many studies have been<br />
undertaken in connection with hazards <strong>and</strong> core drillings (Alean et al. 1983, Böhlert 2005, Haeberli & Funk 1991, Laternser<br />
1992, Lüthi & Funk 1997, Lüthi & Funk 2000, 2001, Oeschger et al. 1977, Schwerzmann 2006, Suter 1995, Suter et al. 2001a,<br />
Suter et al. 2001b, Suter 2002, Suter & Hoelzle 2002, 2004, Suter et al. 2004, Vincent et al. 1997, 2007).<br />
Currently, there are two sites where such measurements have been repeatedly made: Col du Dôme in the Mont Blanc area<br />
(Vincent et al. 2007) <strong>and</strong> Colle Gnifetti in the Monte Rosa area. Colle Gnifetti is a very wind-exposed firn saddle with accumulation<br />
rates of 0.3 to 1.2 m water equivalent per year (Lüthi 2000).<br />
On Colle Gnifetti, several boreholes were drilled in vicinity of the saddle point <strong>and</strong>, until now, measurements were made in<br />
1976, 1982, 1991, 1994, 1995, 1999, 2000, 2003 <strong>and</strong> 2007. This summer (2008), new field-work has been carried out on Colle<br />
Gnifetti. Nine boreholes were drilled with a steam drill <strong>and</strong> borehole temperatures were measured. These temperatures are<br />
now ready to be compared with some older data to detect possible changes.<br />
6.6<br />
<strong>Snow</strong> temperatures: measurement <strong>and</strong> modelling<br />
Fierz Charles & Lehning Michael<br />
WSL Institute for <strong>Snow</strong> <strong>and</strong> Avalanche Research SLF, Flüelastrasse 11, CH-7260 Davos Dorf (fierz@slf.ch)<br />
Both measuring <strong>and</strong> modelling snow temperatures within the topmost centimetres of the snowpack is a challenge. <strong>Snow</strong>pack<br />
evolution, <strong>and</strong> in particular snow metamorphism, heavily depend on the temperature distribution near the surface of the<br />
snowpack.<br />
Short wave radiation penetrating the snowpack is picked-up by the sensors that heat up. A careful sensor design is thus required<br />
<strong>and</strong> we present two of them: the first allows for highly depth-resolved temperature profiles while the second is suitable<br />
for accurate continuous measurements over a few days.<br />
Daily temperature cycles within the top 30 to 50 cm are due to both energy exchanges at the surface <strong>and</strong> to short wave radiation<br />
penetrating the snow. SNOWPACK, the Swiss snow-cover model, treats the latter as a volume source of heat, alike refreezing.<br />
We will show how the multi-b<strong>and</strong> parameterization of short wave absorption implemented in SNOWPACK can be<br />
optimized by comparing model outputs to reliable measurements of snow temperatures.
6.<br />
Combined LiDAR <strong>and</strong> photogrammetry for stability-related change detection<br />
in glacierised <strong>and</strong> frozen rock walls - A case study in the Monte<br />
Rosa east face<br />
Fischer Luzia *, Eisenbeiss Henri**, Kääb Andreas***, Huggel Christian* & Haeberli Wilfried *<br />
* Glaciology, Geomorphodynamics & Geochronology, Department of Geography, University of Zurich, Switzerl<strong>and</strong> (luzia.fischer@geo.uzh.ch)<br />
** Institute of Geodesy <strong>and</strong> Photogrammetry, ETH Zurich, Switzerl<strong>and</strong><br />
*** Department of Geosciences, University of Oslo, Norway<br />
Often, rock walls in high-mountain areas are in large parts covered by steep glaciers <strong>and</strong> firn fields <strong>and</strong> are under permafrost<br />
conditions. Impacts on surface <strong>and</strong> subsurface <strong>ice</strong> in such flanks from climatic <strong>and</strong> other changes strongly influence stress<br />
<strong>and</strong> thermal fields in rock <strong>and</strong> <strong>ice</strong>, geotechnical parameters as well as the hydraulic <strong>and</strong> hydrological regime <strong>and</strong> may eventually<br />
lead to slope instabilities <strong>and</strong> enhanced mass movement activity such as major <strong>ice</strong> <strong>and</strong> rock avalanches (Gruber <strong>and</strong><br />
Haeberli, 2007; Fischer <strong>and</strong> Huggel, 2008). The dynamics <strong>and</strong> changes of steep glaciers <strong>and</strong> <strong>ice</strong> cover in high-mountain rock<br />
walls <strong>and</strong> their interactions with the underlying bedrock are very complex <strong>and</strong> still incompletely understood (Wegmann et<br />
al., 1998; Pralong <strong>and</strong> Funk, 2006; Fischer et al., 2006).<br />
The Monte Rosa east face, Italian Alps, is the highest flank in the European Alps (2200–4600m a.s.l.) <strong>and</strong> is a prominent example<br />
for strong changes <strong>and</strong> instabilities in a high alpine rock wall. Steep glaciers <strong>and</strong> firn fields cover large parts of the<br />
wall. Since the last glaciations maximum during the Little Ice Age (i.e. since approximately 1850) until the 1980s, the glaciation<br />
has changed little. During recent decades, however, the <strong>ice</strong> cover experienced an accelerated <strong>and</strong> drastic loss in extent<br />
<strong>and</strong> thickness <strong>and</strong> some glaciers have completely disappeared within short time (Kääb et al., 2004; Fischer et al., 2006). Over<br />
the recent two decades, new instabilities developed in bedrock as well as in <strong>ice</strong>. The mass movement activity increased drastically<br />
since about 1990, culminating in major mass movements in August 2005, with an <strong>ice</strong> avalanche of more than 1x10⁶<br />
m 3 , <strong>and</strong> in April 2007, with a rock avalanche of about 0.3x10⁶ m 3 .<br />
Acquisition of high-quality data is essential to better underst<strong>and</strong> the predominant processes <strong>and</strong> hazards but is a major<br />
challenge in such high-mountain rock walls are very difficult due to topographic conditions, <strong>ice</strong> cover, <strong>and</strong> terrain that is<br />
difficult <strong>and</strong> dangerous to access. Therefore, remote-sensing based investigations are fundamental for an integrative assessment<br />
of changes in <strong>ice</strong> cover <strong>and</strong> bedrock as well as of slope instabilities in such flanks.<br />
The main objective of the presented study is the investigation of changes in bedrock <strong>and</strong> glaciation in the Monte Rosa east<br />
face based on multi-temporal digital terrain models (DTMs) <strong>and</strong> terrestrial <strong>and</strong> aerial photographs. For this purpose, highresolution<br />
DTMs of the Monte Rosa east face were photogrammetrically generated from aerial photographs of the years 1956,<br />
1988 <strong>and</strong> 2001.<br />
In 2007, a helicopter-borne light detection <strong>and</strong> ranging (LiDAR) scan of the entire Monte Rosa east face could be achieved.<br />
Further high-resolution DTM data stems from an airplane –borne LiDAR campaign in 2005. Based on the comparisons of<br />
DTMs <strong>and</strong> photographs over the last 50 years, the spatio-temporal changes in surface topography are evaluated <strong>and</strong> quantitative<br />
assessments of mass wasting <strong>and</strong> mass accumulation are performed. This unique multi-temporal data set gives an<br />
insight in the complex stability, dynamics <strong>and</strong> mass balance cycles of steep glaciers. Additionally, complex process interactions<br />
between different processes in bedrock <strong>and</strong> <strong>ice</strong> can be detected from the image data available.<br />
REFERENCES<br />
Fischer, L. & Huggel, C. 2008: Methodical Design for Stability Assessments of <strong>Permafrost</strong> Affected High-Mountain Rock Walls,<br />
Proceedings of the 9th International Conference on <strong>Permafrost</strong> 2008, Fairbanks, Alaska, USA, 29.6.-3.7.2008, 1, 439-444.<br />
Fischer, L., Kääb, A., Huggel, C. & Noetzli, J. 2006: Geology, glacier retreat <strong>and</strong> permafrost degradation as controlling factors<br />
of slope instabilities in a high-mountain rock wall: the Monte Rosa east face, Natural Hazards <strong>and</strong> Earth System <strong>Science</strong>s,<br />
6, 761-772.<br />
Gruber, S. & Haeberli, W. 2007: <strong>Permafrost</strong> in steep bedrock slopes <strong>and</strong> its temperature-related destabilization following<br />
climate change, Journal of Geophysical Research, 112, F02S18, doi:10.1029/2006JF000547.<br />
Kääb, A., Huggel, C., Barbero, S., Chiarle, M., Cordola, M., Epinfani, F., Haeberli, W., Mortara, G., Semino, P., Tamburini, A. &<br />
Viazzo, G. 2004: Glacier hazards at Belvedere glacier <strong>and</strong> the Monte Rosa east face, Italian Alps: Processes <strong>and</strong> mitigation,<br />
Proceedings of the Interpraevent 2004 – Riva/Trient, 1, 67-78.<br />
Pralong, A. & Funk, M. 2006: On the instability of avalanching glacier, Journal of Glaciology 52(176), 31-48.<br />
Wegmann, M., Gudmundsson, G. H., & Haeberli, W. 1998: <strong>Permafrost</strong> changes in rock walls <strong>and</strong> the retreat of Alpine<br />
glaciers: a thermal modelling approach, <strong>Permafrost</strong> <strong>and</strong> Periglacial Processes, 9, 23–33.<br />
181<br />
Symposium 6: Apply! <strong>Snow</strong>, <strong>ice</strong> <strong>and</strong> <strong>Permafrost</strong> <strong>Science</strong> + <strong>Geomorphology</strong>
182<br />
Symposium 6: Apply! <strong>Snow</strong>, <strong>ice</strong> <strong>and</strong> <strong>Permafrost</strong> <strong>Science</strong> + <strong>Geomorphology</strong><br />
6.8<br />
Lateglacial glacier evolution of the Greina region (Central Swiss Alps)<br />
Fontana Georgia*, Scapozza Cristian*, Reynard Emmanuel*<br />
*Institut de Géographie, Université de Lausanne, Anthropole, CH–1015 Lausanne (Georgia.Fontana@unil.ch)<br />
The Greina region is well known because of its importance in the Swiss nature protection history. In spite of the interesting<br />
natural features of the region, only few scientific researches were carried out until now, particularly in the field of geomorphology.<br />
The aim of this research (Fontana 2008) was to reconstitute the lateglacial glacier evolution of the Greina region,<br />
in order to fill a gap in the geomorphological knowledge of the Central Swiss Alps <strong>and</strong> to make available basis scientific<br />
information for the promotion of the Greina geomorphological heritage.<br />
A large-scale geomorphological map of the whole region was first realised; special attention was accorded to the cartography<br />
of glacial l<strong>and</strong>forms. On the basis of the cartography of moraines <strong>and</strong> other glacier-related deposits, a reconstitution of the<br />
lateglacial positions of glaciers was realised.<br />
Four main lateglacial glacier positions were identified (Figure 1). One of these positions is characterised by a complex <strong>ice</strong><br />
origin, whereas the other ones correspond to ancient positions of the Gaglianera glacier <strong>and</strong> of a disappeared glacier located<br />
NE of the Pizzo Coroi. For each glacier position, the Equilibrium Line Altitude (ELA) depression related to the reference phase<br />
of 1850 (Maisch, 1992) was calculated. The comparison of the ELA depression of each glacier position allowed us to establish<br />
a regional regression sequence including three phases (Table 1). The results were then compared with regional regression<br />
sequences established by Maisch (1981) in the Eastern Swiss Alps <strong>and</strong> by Renner (1982) in the Gothard region (Table1).<br />
Greina<br />
(Fontana, 2008)<br />
ELA dep. (m) Eastern Swiss Alps<br />
(Maisch, 1981)<br />
ELA dep. (m) Gothard<br />
(Renner, 1982)<br />
Greina 1a 110 Bockten 100-150 Alpe di Cruina 116<br />
ELA dep. (m)<br />
Greina 1b 210 Egesen 170-240 Manio 200-240<br />
Greina 2 310-350 Daun 250-350 All’Acqua 280-315<br />
Table 1: Comparison of the Greina regional regression sequence with regional regression sequences established by Maisch<br />
(1981) <strong>and</strong> Renner (1982).<br />
The glacier positions <strong>and</strong> the regional regression sequence allowed the reconstitution of a general lateglacial glacier evolution<br />
of the Greina region. An important change in the general <strong>ice</strong>-flow directions certainly happened between the Last<br />
Glacial Maximum (LGM) <strong>and</strong> the Lateglacial. The general <strong>ice</strong>-flow coming from the Rhin-source <strong>ice</strong>-cap recognised by<br />
Florineth & Schlüchter (1998) was certainly substituted by a regional <strong>ice</strong>-flow. The general <strong>ice</strong>-flow had a NNE-SSW direction<br />
in the Plaun la Greina region during the LGM <strong>and</strong> a SSW-NNE direction during the Lateglacial. During the Greina 2 phase,<br />
the Gaglianera, Coroi <strong>and</strong> Terri glaciers were confluent <strong>and</strong> formed a front in the middle of the Plaun la Greina region.<br />
During this phase, a glacier located NE of Pizzo Coroi occupied the Crap la Crusch depression. Concerning the Greina 1a <strong>and</strong><br />
Greina 1b phases, only the positions of the Gaglianera glacier could be reconstituted. The front of the glacier was certainly<br />
located W of the Plaun la Greina region during both phases.<br />
REFERENCES<br />
Florineth, D., Schlüchter, C. 1998: Reconstructing the Last Glacial Maximum (LGM) <strong>ice</strong> surface geometry <strong>and</strong> flowlines in<br />
the Central Swiss Alps, Eclogae geol. Helv., 91, 391-407.<br />
Fontana, G. 2008: Analyse et propositions de valorisation d’un paysage géomorphologique. Le cas de la Greina. Lausanne,<br />
Institut de Géographie (Master thesis published on February 28, 2008, on http://doc.rero.ch).<br />
Maisch M. 1981: Glazialmorphologische und gletschergeschichtliche Untersuchungen im Gebiet zwischen L<strong>and</strong>wasser und<br />
Albulatal (Kt. Graubünden, Schweiz). Zürich, Geographisches Institut.<br />
Maisch, M. 1992: Die Gletscher Graubündens. Zürich, Geographisches Institut.<br />
Renner, F. 1982: Beiträge zur Gletscher-Geschichte des Gotthardgebietes und dendroclimatologischen Analysen an fossilen<br />
Hölzern. Zürich, Geographisches Institut.
Figure 1. General <strong>ice</strong> flow direction during LGM <strong>and</strong> lateglacial phases in the Greina region.<br />
6.<br />
Geomorphological map of the Greina region (Central Swiss Alps)<br />
Fontana Georgia*, Scapozza Cristian*, Reynard Emmanuel*<br />
*Institut de Géographie, Université de Lausanne, Anthropole, CH–1015 Lausanne (Georgia.Fontana@unil.ch)<br />
The Greina is a high mountain region located in the Central Swiss Alps. In spite of the interesting geomorphological features<br />
of the region, no scientific research was carried out in this field until now. The aim of this research was to realise a geomorphological<br />
map of the Greina region, in order to reconstitute the morphogenesis of the area <strong>and</strong> to make available basis<br />
information for the promotion of the geomorphological heritage of the Greina region (Fontana 2008).<br />
The geomorphological map was realised using the guidelines developed at the Institute of Geography of Lausanne University<br />
(Schoeneich et al. 1998). The method allows the realisation of morphogenetic maps <strong>and</strong> is particularly interesting for morphogenesis<br />
reconstitutions.<br />
The Greina region presents a rich geomorphological diversity including structural, fluvial, gravitative, karstic, glacial, periglacial<br />
<strong>and</strong> organic l<strong>and</strong>forms. The l<strong>and</strong>form distribution is largely dependent on geological structure. From a tectonic<br />
point of view, the northern part of the study area belongs to the Gothard Massiv. This tectonic unit is composed of crystalline<br />
rocks, especially gneiss. Crystalline rocks are quite resistant to erosion <strong>and</strong> still conserve the traces of glacial erosion. Roches<br />
moutonnées <strong>and</strong> striations are therefore very frequent. The tectonic units situated southern of the Gothard Massiv include<br />
its sedimentary cover <strong>and</strong> some lower Penninic nappes. The autochthon sedimentary cover is mostly composed of dolomitic<br />
rocks, which present several karstic l<strong>and</strong>forms, like dolines <strong>and</strong> residual l<strong>and</strong>forms. The parautochton sedimentary cover<br />
<strong>and</strong> the lower Penninic nappes include several lithologies. Calcschists are very frequent: as these rocks are sensitive to the<br />
action of frost, erosional glacial l<strong>and</strong>forms are quite rare, whereas talus slopes are very frequent. As clays are a product of<br />
calcschists weathering, well-developed solifluxion lobes are also visible.<br />
Thanks to the geomorphological map <strong>and</strong> to other field observations, the general morphogenesis of the Greina region during<br />
the Lateglacial <strong>and</strong> the Holocene could be reconstituted (for the Lateglacial, see Fontana et al. 2008). During the Holocene,<br />
glacial processes became less important, whereas gravitative, fluvial <strong>and</strong> periglacial processes strongly shape the current<br />
183<br />
Symposium 6: Apply! <strong>Snow</strong>, <strong>ice</strong> <strong>and</strong> <strong>Permafrost</strong> <strong>Science</strong> + <strong>Geomorphology</strong>
18<br />
Symposium 6: Apply! <strong>Snow</strong>, <strong>ice</strong> <strong>and</strong> <strong>Permafrost</strong> <strong>Science</strong> + <strong>Geomorphology</strong><br />
evolution of l<strong>and</strong>scape. At the beginning of Holocene, the whole region should have been concerned by a paraglacial morphogenetic<br />
crisis. An important glacial sedimentary stock should have been reworked by fluvio-glacial <strong>and</strong> fluvial processes,<br />
while rockfalls <strong>and</strong> l<strong>and</strong>slides should have been numerous. The fluvial rework of glacial sediments is at the origin of two<br />
relict paraglacial alluvial fans outside of the Gaglianera (Figure 1) <strong>and</strong> Canal valleys. At the same time, the frost <strong>and</strong> gravity<br />
action should have contributed to the talus slope formation. The rivers also shaped progressively their talwegs <strong>and</strong> the dissolution<br />
of dolomite rocks shaped karstic l<strong>and</strong>forms. The current sedimentation level is lower than it was at the beginnings<br />
of Holocene <strong>and</strong> corresponds to the Piano della Greina, Plaun la Greina <strong>and</strong> Alpe di Motterascio alluvial plains. Concerning<br />
glaciers, their Holocene evolution is not well known. Since 1850, they present a strong regression (Maisch 1992) <strong>and</strong> occupy<br />
today a very small part of their glacial cirque (Fontana 2008).<br />
Figure 1. The Gaglianera paraglacial alluvial fan (on the right), <strong>and</strong> the current alluvial fan (on the left).<br />
REFERENCES<br />
Fontana, G. 2008: Analyse et propositions de valorisation d’un paysage géomorphologique. Le cas de la Greina. Lausanne,<br />
Institut de Géographie (Master thesis published on February 28, 2008, on http://doc.rero.ch).<br />
Fontana, G., Scapozza, C., Reynard, E. 2008: Lateglacial glacier evolution of the Greina region, Proceedings of the 6th Swiss<br />
Geoscience Meeting, this volume.<br />
Maisch, M. 1992: Die Gletscher Graubündens, Zürich, Geographisches Institut.<br />
Schoeneich, P., Reynard, E., Pierrehumbert, G. 1998: Geomorphological mapping in the Swiss Alps <strong>and</strong> Prealps, Wiener<br />
Schriften zur Geographie und Kartographie, 11, 145-153.<br />
6.10<br />
Observation of the Cryosphere – Switzerl<strong>and</strong>’s contri-bution to the<br />
Global Climate Observing System GCOS<br />
Foppa N<strong>and</strong>o*, Seiz Gabriela*, Walterspiel Julia*<br />
*Swiss GCOS Off<strong>ice</strong>, Federal Off<strong>ice</strong> of Meteorology <strong>and</strong> Climatology MeteoSwiss Kraehbuehlstr. 58, CH-8044 Zurich, (N<strong>and</strong>o.Foppa@meteoswiss.ch),<br />
www.gcos.ch<br />
In recent decades – especially following the adoption of the UN Framework Convention of Climate Change (UNFCCC) in 1992<br />
– the dem<strong>and</strong> for observations of climate change <strong>and</strong> the closer links between climate observation <strong>and</strong> climate research/modeling<br />
has steadily increased, leading to the establishment of the Global Climate Observing System (GCOS).<br />
GCOS is an initiative of the World Meteorological Organization (WMO), the Intergovernmental Oceanographic Commission<br />
(IOC) of the UNESCO, the UN Environmental Programme (UNEP) <strong>and</strong> the International Council of <strong>Science</strong> (ICSU). GCOS is
designed to ensure that the observations <strong>and</strong> information needed to address climate-related issues are obtained systematically<br />
<strong>and</strong> made available to all potential users. In particular, GCOS follows the aims <strong>and</strong> requirements of systematic observation<br />
as specified in the UNFCCC <strong>and</strong> the Kyoto Protocol.<br />
In Switzerl<strong>and</strong>, the Swiss GCOS Off<strong>ice</strong> at the Federal Off<strong>ice</strong> of Meteorology <strong>and</strong> Climatology MeteoSwiss was established in<br />
2006, following the ratification of the Kyoto Protocol in 2003, to coordinate climate observations at the national level <strong>and</strong> to<br />
foster information exchange <strong>and</strong> collaboration among the various institutions. In 2007, the Swiss GCOS Off<strong>ice</strong> has compiled<br />
the first-ever inventory of the country’s long-term climatological data series of the atmosphere <strong>and</strong> the l<strong>and</strong> surface, entitled<br />
“National Climate Observing System (GCOS Switzerl<strong>and</strong>)” (Seiz & Foppa, 2007). Switzerl<strong>and</strong> has a long tradition in the observation<br />
of cryospheric parameters, including more than 100 years of glacier <strong>and</strong> snow depth measurements, the longest<br />
Central European lake <strong>ice</strong> cover records, the permafrost monitoring network PERMOS, the world’s longest snow water equivalent<br />
series for catchment areas, <strong>and</strong> is additionally hosting the important World Glacier Monitoring Serv<strong>ice</strong>.<br />
Our presentation will give an overview about GCOS in general <strong>and</strong> about the Swiss GCOS activities. It will highlight how<br />
local measurements of different cryospheric parameters in Switzerl<strong>and</strong> contribute to the Global Climate Observing System<br />
<strong>and</strong> the added-value of satellite-based observations of the cryosphere within GCOS.<br />
REFERENCES<br />
Seiz, G., & Foppa, N. 2007: National Climate Observing System (GCOS Switzerl<strong>and</strong>). Publication of MeteoSwiss <strong>and</strong> ProClim,<br />
92 p., (available in German, French <strong>and</strong> English under http://www.gcos.ch)<br />
6.11<br />
Replica method for three-dimensional X-ray microtomographic imaging<br />
of snow<br />
Frei Esther, Heggli Martin & Schneebeli Martin<br />
WSL Institute for <strong>Snow</strong> <strong>and</strong> Avalanche Reserach SLF, Flüelastrasse 11, CH-7260 Davos Dorf (heggli@slf.ch)<br />
<strong>Snow</strong> microstructure is a crucial factor determining many properties such as mechanical strength, thermal conductivity, or<br />
optical properties. There are basically three techniques used to measure the full three-dimensional microstructure of snow<br />
samples: serial sectioning, direct X-ray computer tomography (micro-CT), or micro-CT of 1-chloronaphthalene cast snow.<br />
Samples that need to be transported or stored must be conserved by casting the snow with a solidifying substance, e.g. 1chloronaphthalene<br />
or diethyl phthalate (DEP). Chloronaphthalene, while having a good X-ray contrast, is quite toxic <strong>and</strong><br />
smells bad.<br />
Image processing of serial sections of DEP cast snow is often very difficult, due to the formation of DEP crystals that appear<br />
optically very similar to <strong>ice</strong> crystals. Micro-CT was so far not applicable to DEP cast snow samples because there is hardly any<br />
absorption contrast between <strong>ice</strong> <strong>and</strong> DEP.<br />
We developed a new replica method that allows investigating the microstructure of DEP cast samples by micro-CT. The sampling<br />
<strong>and</strong> casting process can be done as usual. Before the micro-CT measurement, the <strong>ice</strong> needs to be removed from the cast<br />
samples. The vapour pressure of DEP is about a million times smaller than that of <strong>ice</strong>, which allows sublimating the <strong>ice</strong> selectively.<br />
Keeping the sample under vacuum accelerates the sublimation process drastically to a few days. This leaves behind<br />
the DEP, which forms an exact negative image of the snow. The porous structure can now be measured in the micro-CT. A<br />
numerical inversion of the segmented micro-CT images yields a digital replica of the original snow structure.<br />
The accuracy of replication was tested by comparing the digital replica to the original snow structure. The structural parameters<br />
of the two structures were compared to each other. The replication of the snow microstructure was very good with<br />
relative errors below 5%. The presented replica method is comparably straightforward <strong>and</strong>, for the snow types tested, the<br />
microstructure is accurately reproduced.<br />
18<br />
Symposium 6: Apply! <strong>Snow</strong>, <strong>ice</strong> <strong>and</strong> <strong>Permafrost</strong> <strong>Science</strong> + <strong>Geomorphology</strong>
186<br />
Symposium 6: Apply! <strong>Snow</strong>, <strong>ice</strong> <strong>and</strong> <strong>Permafrost</strong> <strong>Science</strong> + <strong>Geomorphology</strong><br />
6.12<br />
The <strong>ice</strong> ridge at Murtèl/Corvatsch: Studying a (c)old archive<br />
Frey Holger*, Busarello Claudio**, Frauenfelder Regula***, Haeberli Wilfried*, Hoelzle Martin****, May Barbara*****, Rau<br />
Sebastian*****, Wagenbach Dietmar***** & Wagner Stefan******<br />
*University of Zurich, Department of Geography, Winterthurerstr. 190, CH-8057 Zurich (holger.frey@geo.uzh.ch)<br />
**SwissRE, Mythenquai 50/60 P.O. Box, CH-8022 Zurich<br />
***Norwegian Geotechnical Institute, P.O. Box 3930 Ullevål Stadion, NO-0806 Oslo, Norway<br />
****University of Fribourg, Department of Geosciences, Chemin du Musée 4, CH-1700 Fribourg<br />
*****University of Heidelberg, Institute of Environmental Physics, Im Neuheimer Feld 229, D-69120 Heidelberg,<br />
******Bitzi-Bendel, CH-9642 Ebnat-Kappel<br />
Cold corn<strong>ice</strong>-, crest- <strong>and</strong> plateau-type miniature <strong>ice</strong> caps of the northern hemisphere are known to contain old (Holocene to<br />
even Pleistocene) <strong>ice</strong> layers. These small but highly interesting paleoglaciological <strong>and</strong> paleoclimatical archives, however, are<br />
still largely unexplored <strong>and</strong> their future response to the rapid warming of the atmosphere remains to be investigated. On<br />
the north-south-oriented <strong>ice</strong> ridge Murtèl/Corvatsch (3300 – 3500 m.a.s.l) in the Upper Engadin, systematic studies are performed<br />
since several years (Haeberli et al. 2004). In this contribution we like to sum up the investigations <strong>and</strong> findings,<br />
present new results <strong>and</strong> discuss potential future research questions.<br />
Refreezing of melt water is the main accumulation process, resulting in small accumulation rates. Temperatures in boreholes<br />
<strong>and</strong> at the marginal <strong>ice</strong>/rock-contact reveal that the ridge consists of cold <strong>ice</strong> <strong>and</strong> is frozen to the permafrost-bedrock (no<br />
basal sliding). Finite elements modelling shows that only very small flow velocities can be expected under the ridge where<br />
the surface slope tends towards zero. These two findings (small accumulation rates <strong>and</strong> probable <strong>ice</strong> velocities close to zero<br />
at the <strong>ice</strong>/rock interface) indicate that basal <strong>ice</strong> layers may have a considerable age (millennia). These assumptions are supported<br />
by a C14 date from an <strong>ice</strong> core drilled down to the bedrock in 2007, which however, since being a preliminary result,<br />
needs to be confirmed by further analyses.<br />
A GPS survey was performed in 2000 <strong>and</strong> repeated in 2007. Comparison of the two digital elevation models (DEM) showed an<br />
average subsidence of the surface of about 5m (≈0.7m/y) with a maximum lowering of > 15 m <strong>and</strong> a geometric distortion of<br />
the ridge. Analyses of the Tritium content show that the <strong>ice</strong> at the surface in 2007 dates back to around 1960, which means<br />
that the <strong>ice</strong> accumulated in the last four to five decades has already melted away. Ground penetrating radar (GPR) measurements<br />
from 2001 indicate <strong>ice</strong> thicknesses of about 30m (±20m) under the ridge <strong>and</strong> more shallow parts at the glacier margins.<br />
Continuation or even acceleration of recent thinning rates would, hence, lead to vanishing of the glacier within decades.<br />
REFERENCES<br />
Haeberli, W., Frauenfelder, R., Kääb, A. & Wagner, S. 2004: Characteristics <strong>and</strong> potential climatic significance of “miniature<br />
<strong>ice</strong> caps” (crest- <strong>and</strong> corn<strong>ice</strong>-type low-altitude <strong>ice</strong> archives). Journal of Glaciology, 50 (168), 129-136.<br />
6.13<br />
Application of operational geophysical monitoring systems on alpine<br />
permafrost<br />
Hauck Christian* & Hilbich Christin**<br />
*Department of Geosciences, University of Fribourg, Chemin de Musée 4, CH-1700 Fribourg (christian.hauck@unifr.ch)<br />
**Geographical Institute, University of Jena, Löbdergraben 32, D-07743 Jena<br />
Determining the subsurface <strong>ice</strong> <strong>and</strong> unfrozen water content in cold regions are important tasks in all kind of cryospheric<br />
studies, but especially on perennial (permafrost) or seasonal frozen ground, where little insights can be gained from direct<br />
observations at the surface. In the absence of boreholes, geophysical methods are often the only possibility for “visualising”<br />
the subsurface characteristics, <strong>and</strong> their successful application in recent years lead to more <strong>and</strong> more sophisticated ap-
proaches including 2- <strong>and</strong> 3-dimensional monitoring <strong>and</strong> even quantifying the <strong>ice</strong> <strong>and</strong> unfrozen water content evolution<br />
within the subsurface (for an overview see Hauck & Kneisel 2008).<br />
Due to the strong sensitivity of electrical resistivity <strong>and</strong> permittivity to the phase change from unfrozen water to <strong>ice</strong>, the<br />
application of electrical <strong>and</strong> electromagnetic techniques has been especially successful. Within these methods, Electrical<br />
Resistivity Tomography (ERT) is often favoured due to its comparatively easy <strong>and</strong> fast data processing, its robustness against<br />
ambient noise <strong>and</strong> its good performance even in harsh, cold <strong>and</strong> irregular environments. Numerous recent studies have now<br />
shown that ERT is principally suitable to spatially delineate ground <strong>ice</strong>, differentiate between <strong>ice</strong>-poor <strong>and</strong> <strong>ice</strong>-rich occurrences,<br />
monitor freezing, thawing <strong>and</strong> infiltration processes, <strong>and</strong> even determine the origin of the <strong>ice</strong>, i.e. a differentiation<br />
between buried glacier <strong>ice</strong> <strong>and</strong> segregation <strong>ice</strong>, due to their different ion contents (yielding a reduced electrical resistivity<br />
for the latter).<br />
In the context of a possible increased frequency of extreme weather periods, such as the hot summer 2003 in the European<br />
Alps, a monitoring of cryospheric components such as the mountain permafrost evolution becomes more <strong>and</strong> more important<br />
(Hilbich et al. 2008a). Common observation techniques are usually based on the thermal aspects, as in existing permafrost<br />
borehole temperature monitoring networks. Concerning the impacts of changing climate parameters, not only temperature<br />
but especially the <strong>ice</strong> <strong>and</strong> water content of the subsurface plays an important role, especially for permafrost observation<br />
purposes.<br />
In summer 2006 the installation of a semi-automatic ERT monitoring system has been completed at 4 permafrost sites in the<br />
Swiss Alps (in co-operation with the Swiss permafrost network PERMOS, Vonder Mühll et al. 2007). This geophysical monitoring<br />
network serves to investigate the sensitivity of characteristic morphological sites to extreme atmospheric forcing in<br />
order to estimate the long-term evolution due to climate induced warming. Monitoring profiles are located at a rockglacier<br />
(Murtél, Upper Engadine), steep slope (Schilthorn, Bernese Alps), talus slope (Lapires, Valais) <strong>and</strong> frozen bedrock (Stockhorn<br />
plateau, Valais)(Hilbich et al. 2008b). The geophysical monitoring strategy includes repeated ERT measurements with a monthly<br />
to seasonal resolution over several years, as well as annual refraction seismic measurements at all sites. Whereas relative<br />
resistivity changes with time can be attributed to freeze <strong>and</strong> thaw processes, combined ERT <strong>and</strong> refraction seismic tomography<br />
will serve to determine total fractions of <strong>ice</strong>, unfrozen water <strong>and</strong> air within the pore space of the respective subsurface<br />
sections (Hauck et al. 2008).<br />
REFERENCES<br />
Hauck, C. & Kneisel, C. (Eds) 2008: Applied geophysics in periglacial environments. Cambridge University Press.<br />
Hauck, C., Bach, M. & Hilbich, C. 2008: A 4-phase model to quantify subsurface <strong>ice</strong> <strong>and</strong> water content in permafrost regions<br />
based on geophysical data sets. Ninth Internat. Conf. on <strong>Permafrost</strong>, Fairbanks, Alaska, 2008, 6pp.<br />
Hilbich, C., Hauck, C., Hoelzle, M., Scherler, M., Schudel, L., Völksch, I., Vonder Mühll, D. & Mäusbacher R. 2008: Monitoring<br />
mountain permafrost evolution using electrical resistivity tomography: A 7-year study of seasonal, annual, <strong>and</strong> longterm<br />
variations at Schilthorn, Swiss Alps, J. Geophys. Res., 113, F01S90, doi:10.1029/2007JF000799.<br />
Hilbich, C., Hauck, C., Delaloye, R. & Hoelzle, M. 2008: A geoelectric monitoring network <strong>and</strong> resistivity-temperature<br />
relationships of different mountain permafrost sites in the Swiss Alps. Ninth Internat. Conf. on <strong>Permafrost</strong>, Fairbanks,<br />
Alaska, 2008, 6pp.<br />
Vonder Mühll, D., Noetzli, J., Roer, I., Makowski, K. & Delaloye, R. 2007. <strong>Permafrost</strong> in Switzerl<strong>and</strong> 2002/2003 <strong>and</strong> 2003/2004,<br />
Glaciological Report (<strong>Permafrost</strong>) No. 4/5 of the Cryospheric Commission (CC) of the Swiss Academy of <strong>Science</strong>s (SCNAT)<br />
<strong>and</strong> Department of Geography, University of Zurich, 106 pp.<br />
6.1<br />
Thermal conductivity of snow: How to find a better parameterisation?<br />
Heggli Martin, Köchle Bernadette, Pinzer Bernd & Schneebeli Martin<br />
WSL Institute for <strong>Snow</strong> <strong>and</strong> Avalanche Reserach SLF, Flüelastrasse 11, CH-7260 Davos Dorf (heggli@slf.ch)<br />
The thermal conductivity of snow is an important parameter in the energy balance of snow-covered areas. This energy balance<br />
is a key to underst<strong>and</strong>ing the response of arctic regions to changing global climate. The thermal conductivity <strong>and</strong> the heat<br />
flow through snow also determine the temperature gradient metamorphism which modifies the microstructure of snow<br />
(Schneebeli & Sokratov 2004; Kaempfer et al. 2005). As a consequence, mechanical, thermophysical, chemical, <strong>and</strong> optical<br />
properties of the snow are changed. For modelling the metamorphism of snow, it is essential to use a realistic parameterisa-<br />
18<br />
Symposium 6: Apply! <strong>Snow</strong>, <strong>ice</strong> <strong>and</strong> <strong>Permafrost</strong> <strong>Science</strong> + <strong>Geomorphology</strong>
188<br />
Symposium 6: Apply! <strong>Snow</strong>, <strong>ice</strong> <strong>and</strong> <strong>Permafrost</strong> <strong>Science</strong> + <strong>Geomorphology</strong><br />
tion for the thermal conductivity. An underst<strong>and</strong>ing of the relationship between heat flow <strong>and</strong> snow microstructure is<br />
crucial for improving models in climatology, interpretations of chemical signals in firn <strong>and</strong> <strong>ice</strong>, <strong>and</strong> for avalanche research.<br />
Available data for the effective thermal conductivity of snow, k eff , are mostly based on measurements with a transient method<br />
using a needle probe (e.g. Sturm et al. 1997). They relate keff empirically to the density. However, the measured values differ<br />
by up to a factor of five for snow with the same density <strong>and</strong> the same grain shape. Thus, a large uncertainty is introduced<br />
into models that use a parameterisation based on these measurements. Furthermore, new measurements using a steady<br />
state method with heat flux plates suggest values of k eff , that are significantly higher than those measured by Sturm et al.<br />
(1997). For snow samples with a density of 200-300 kgm -3 , a k eff , of 0.2-0.3 Wm -1 K -1 was measured.<br />
In our study, we systematically compare measurements of k eff , with a needle probe (transient method) <strong>and</strong> with heat flux<br />
plates (steady state method) for different snow types <strong>and</strong> snow densities. The microstructure of the snow samples is characterized<br />
with micro computer tomography (micro-CT). Based on the assumption that the bonds between grains are more important<br />
than the density of the snow, Dadic et al. (2008) suggest a correlation between the penetration resistance <strong>and</strong> the<br />
thermal conductivity of snow. We test this correlation by measuring the penetration resistance of the different snow types<br />
using the <strong>Snow</strong>MicroPen (SMP), a high resolution penetrometer (Schneebeli & Johnson 1998), <strong>and</strong> correlating these measurements<br />
to the measured thermal conductivity.<br />
Contact problems between the probe <strong>and</strong> the snow sample may be a potential explanation for the observed differences between<br />
the measurement methods. This effect is expected to be especially pronounced in fragile snow types such as depth<br />
hoar. The contact geometry between the probe <strong>and</strong> the snow sample is investigated using micro-CT.<br />
REFERENCES<br />
Dadic, R., Schneebeli, M., Lehning, M., Hutterli, M.A. & Ohmura A. 2008: Impact of the microstructure of snow on its<br />
temperature: A model validation with measurements from Summit, Greenl<strong>and</strong>. J. Geophys. Res. 113, D14303.<br />
Kaempfer, T.U., Schneebeli, M. & Sokratov, S.A. 2005. A microstructural approach to model heat transfer in snow. Geophys.<br />
Res. Lett. 32, L21503.<br />
Schneebeli, M. & Johnson, J.B. 1998. A constant speed penetrometer for high-resolution snow stratigraphy. Ann. Glaciol. 26,<br />
107-111.<br />
Schneebeli, M. & Sokartov, S.A. 2004. Tomography of temperature gradient metamorphism of snow <strong>and</strong> associated changes<br />
in heat conductivity. Hydrol. Process. 18, 3655-3665.<br />
Sturm, M., Holmgren, J., König, M. & Morris, K. 1997: The thermal conductivity of seasonal snow. J. Glaciol. 43, 26-41.<br />
6.1<br />
Thermal <strong>and</strong> electrical properties of a periglacial talus slope<br />
Lambiel Christophe*, Scapozza Cristian*, Pieracci Kim*, Baron Ludovic** & Marescot Laurent***<br />
*Institute of Geography, University of Lausanne, Anthropole, CH-1015 Lausanne (christophe.lambiel@unil.ch)<br />
**Institute of Geophysics, University of Lausanne, Amphipôle, CH-1015 Lausanne<br />
***Institute of Geophysics, ETH-Swiss Federal Institute of Technology, 8093 Zurich<br />
Les Attelas talus slope is located on the western flank of the Mont Gelé (3023 m a.s.l.), in Verbier area. This cone-shaped l<strong>and</strong>form<br />
is affected by solifluction in the upper-mid part of the slope, whereas bulging suggests the presence of creeping permafrost<br />
in the lower part of the slope.<br />
In order to determine the spatial extension <strong>and</strong> the characteristics of the permafrost within the slope, several thermal <strong>and</strong><br />
geoelectrical measurements have been carried out (Lambiel 2006).<br />
Ground surface temperatures measured in March 2005 at the base of the snow cover (BTS method) displayed values colder<br />
than -6°C below 2700 m a.s.l. (Fig. 1). In the upper portion of the slope, temperatures were warmer (up to -1°C). According to<br />
these values, permafrost may be present in the lower part of the slope, whereas the probability of its presence decreases<br />
upslope.<br />
In summer 2007, 48 permanent electrodes were installed each 4 meters along an upslope-downslope profile in order to monitor<br />
the underground resistivity using the Electrical Resistivity Tomography (ERT) technique (Fig. 1). The ERT profile (Fig. 2)<br />
shows that the highest resistivities are located in the lower part of the slope. From the distance of 85 meters to the foot of
the slope, a resistive body with values higher than 25 kΩm <strong>and</strong> thickness of about 15 meters has been imaged by both apparent<br />
resistivity <strong>and</strong> inversed resistivity. It corresponds to the cold BTS temperatures (Fig. 1) <strong>and</strong> can be interpreted as a permafrost<br />
lens. In the middle of the ERT profile, the lower resistivities (
1 0<br />
Symposium 6: Apply! <strong>Snow</strong>, <strong>ice</strong> <strong>and</strong> <strong>Permafrost</strong> <strong>Science</strong> + <strong>Geomorphology</strong><br />
6.16<br />
Modelling of glacier bed topography from glacier outlines <strong>and</strong> DEM data<br />
in a GIS<br />
Linsbauer Andreas*, Paul Frank*, Hoelzle Martin* & Haeberli Wilfried*<br />
* Department of Geography, University of Zurich, Winterthurerstr. 190, CH-8057 Zürich (alinsbau@geo.uzh.ch)<br />
Due to the ongoing <strong>and</strong> expected future increase in global mean temperature, the Alpine environment will continue to get<br />
further away from equilibrium. This could have large environmental <strong>and</strong> societal impacts. Glaciers are a part of the highmountain<br />
cryosphere, <strong>and</strong> their changes are considered to be the best natural indicators of climatic changes. The observation<br />
of the high-mountain environment <strong>and</strong> its glaciers forms thus an important part in global climate related observing<br />
programs. The calculation <strong>and</strong> visualization of future glacier development is thus an important task of communicating<br />
climate change effects to a wider public (Paul et al., 2007).<br />
One of the most challenging topics in the assessment of climate change impacts on future glacier development is the<br />
unknown glacier bed <strong>and</strong> the related uncertainties in glacier volume estimations (Driedger <strong>and</strong> Kennard, 1986). In this respect,<br />
an estimated topography of the glacier bed would facilitate the calculation of glacier volume, the detection of local<br />
depressions, <strong>and</strong> the visualization of future <strong>ice</strong>-free grounds. While several methods exist to obtain a glacier bed from modelling<br />
combined with measurements (e.g. Huss et al., 2008), the goal of this study is the application of a simple but robust<br />
method which automatically approximates a glacier bed for a large sample of glaciers, using only few input data such as a<br />
digital elevation model (DEM), glacier outlines, <strong>and</strong> a set of flow lines for each glacier (Fig. 1). It is based on the calculation<br />
of the <strong>ice</strong> thickness along selected points of the flow line from the shallow <strong>ice</strong> approximation (SIA) following Haeberli <strong>and</strong><br />
Hoelzle (1995) <strong>and</strong> subsequent spatial interpolation using a routine (topogrid) that is implemented in a geographic information<br />
system (GIS) <strong>and</strong> was developed by Hutchinson (1989).<br />
Sensitivity tests with simple geometric forms on flat <strong>and</strong> inclined surfaces helped to constrain the model parameters. This<br />
includes the specifications for topogrid as well as the rules for digitizing the flow lines. For Switzerl<strong>and</strong>, they form the only<br />
part of the input data that have to be newly created. The model was tested with real data from the Bernina region which lead<br />
to some modifications of the flow line digitizing <strong>and</strong> interpolation process. Finally, the reconstructed beds are compared to<br />
glacier beds or thickness measurements for three glaciers (Morteratsch, Gorner <strong>and</strong> Zinal) which have been obtained in<br />
previous studies.<br />
The comparison revealed that the method has a large potential, but further improvements could be integrated as well. The<br />
general depth distribution of the reconstructed glacier beds is in a fairly good agreement with the results from the other<br />
studies <strong>and</strong> calculated glacier volumes or the location of local depressions do agree as well. However, there is a tendency to<br />
underestimate glacier thickness <strong>and</strong> locally some strong deviations exist. Currently, mean slope is the only (<strong>and</strong> thus a very<br />
sensitive) variable for the <strong>ice</strong> thickness calculation. Hence, it might be possible to improve the performance of the method<br />
by integrating some basic laws of glacier flow <strong>and</strong> further geomorphometry-dependent smoothing of the glacier surface (e.<br />
g. Huss et al., 2008). However, the method as a whole should stay as simple as possible to facilitate its automated <strong>and</strong> large<br />
scale application.<br />
The application of the (improved <strong>and</strong> locally calibrated) method to all glaciers in the Swiss Alps does only require that glacier<br />
flow lines are digitized according to the rules outlined in this study. In combination with further GIS-based models (e.g. Paul<br />
et al., 2007) the here presented method would allow to calculate <strong>and</strong> visualize impacts of climate change on glaciers <strong>and</strong><br />
their role as a water resource for Switzerl<strong>and</strong>.<br />
REFERENCES<br />
Driedger, C. & Kennard, P. 1986: Glacier volume estimation on cascade volcanos: an analysis <strong>and</strong> comparison with other<br />
methods. Annals of Glaciology, 8, 59–64.<br />
Haeberli, W. & Hoelzle, M. 1995: Application of inventory data for estimating characteristics of <strong>and</strong> regional climate-change<br />
effects on mountain glaciers: a pilot study with the European Alps. Annals of Glaciology, 21, 206–212.<br />
Huss, M., Farinotti, D., Bauder, A. & Funk, M. 2008: Modelling runoff from highly glacierized alpine drainage basins in a<br />
changing climate. Hydrological Processes, 22 (19), 3888–3902.<br />
Hutchinson, M. 1989: A new procedure for gridding elevation <strong>and</strong> stream line data with automatic removal of spurious pits.<br />
Journal of Hydrology, 106, 211–232.<br />
Paul, F., Maisch, M., Rothenbühler, C., Hoelzle, M. & Haeberli, W. 2007: Calculation <strong>and</strong> visualisation of future glacier extent<br />
in the Swiss Alps by means of hypsographic modelling. Global <strong>and</strong> Planetary Change, 55, 343–357.
Figure 1: Schematic flowchart <strong>and</strong> details of the glacier bed modelling.<br />
6.1<br />
Transient response of idealized glaciers to climate variations<br />
Martin Lüthi<br />
VAW Glaciology, ETH Zürich, CH-4092 Zürich (luethi@vaw.baug.ethz.ch)<br />
Variations of glacier length <strong>and</strong> volume under climate variations are investigated with model glaciers on a simple bedrock<br />
geometry. Under periodic climate oscillations the well-known phase lags of length <strong>and</strong> volume are obtained, after initial<br />
transients have died out. The relation between glacier mass balance (local or total) <strong>and</strong> climate is strongly influenced by the<br />
transient response for forcing periods shorter than the volume time scale. These transients are surprisingly large, <strong>and</strong> lead<br />
to unexpected trajectories in phase space. Under periodic oscillations the local <strong>ice</strong> thickness follows the climate forcing with<br />
a typical phase delay of 60˚ (accumulation area) to 180˚ (glacier terminus), while glacier length is completely out of phase<br />
for forcing periods below the volume time scale. The evolution of the model glacier can be approximately described with a<br />
forced, linearly damped harmonic oscillator which is typically underdamped. Approximate expressions for the volume- <strong>and</strong><br />
area time scales are explicitly derived, as are volume-length scaling relations.<br />
Phase space diagram of volume change vs. length change of a model glacier under climate forcing with 50 year period. Only after 5 cli-<br />
mate cycles the glacier response approaches the limiting cycle around the steady state (black dot). Obviously climate <strong>and</strong> glacier reaction<br />
are not closely related.<br />
1 1<br />
Symposium 6: Apply! <strong>Snow</strong>, <strong>ice</strong> <strong>and</strong> <strong>Permafrost</strong> <strong>Science</strong> + <strong>Geomorphology</strong>
1 2<br />
Symposium 6: Apply! <strong>Snow</strong>, <strong>ice</strong> <strong>and</strong> <strong>Permafrost</strong> <strong>Science</strong> + <strong>Geomorphology</strong><br />
6.18<br />
Airflow velocity measurements in ventilated porous debris accumulations<br />
Morard Sebastien*, Delaloye Reynald*<br />
*Geography, Dept. Geosciences, University of Fribourg, Chemin du Musée 4, CH-1700 Fribourg (sebastien.morard@unifr.ch, reynald.delaloye@unifr.ch)<br />
The mechanism of deep air circulation (the “chimney effect”) is known to be a frequent phenomenon maintaining very cold<br />
ground conditions, <strong>and</strong> sometimes permafrost, in porous debris accumulations (talus slope, relict rock glacier) located several<br />
hundred meters below the regional permafrost limit. Temperature measurements at the ground surface (Morard et al.<br />
2008) <strong>and</strong> in borehole (Delaloye & Lambiel 2007) revealed that the ground thermal regime is strongly influenced by the advective-heat<br />
effect of the airflow.<br />
In order to better underst<strong>and</strong> the processes by which internal ventilation causes a strong overcooling of the lower part of<br />
debris accumulations, experimental continuous airflow velocity measurements (using anemometers <strong>and</strong> an air differential<br />
pressure sensor) have been carried out recently in three sites : in the Creux-du-Van talus slope (Jura mountains, 1250 m a.s.l.),<br />
in the Dreveneuse-d’en Bas talus slope (Valais Prealps, 1560 m a.s.l.) (Delaloye & Lambiel 2007) <strong>and</strong> in the Gros Chadoua relict<br />
rock glacier – talus slope complex (Fribourg Prealps, 1570 m a.s.l.).<br />
Windmill <strong>and</strong> sonic anemometers were placed in wind holes located in the lower part of the ventilation system. In the<br />
Dreveneuse-d’en Bas talus slope, the windmill sensor recorded a velocity of 0.1 – 0.4 m/s in summertime, but stronger aspiration<br />
(up to 0.8 m/s) by very cold weather during a snow free period in late fall. In the Creux-du-Van talus slope, data from<br />
the sonic anemometer were very noisy, but seem also range between 0.05 - 0.5 m/s <strong>and</strong> sometimes 1 m/s.<br />
In the Gros Chadoua, both wind sensors recorded outflow values between 0.5 to 1.7 m/s in summer, with faster velocities<br />
when the external temperature rises. In fall, before the onset of a snow cover, when the external air temperature crossed a<br />
threshold of about +4°C, airflow direction changes rapidly. Airflow reversibility occurred several times during this period,<br />
depending on the outside air evolution (figure 1). The wind sensors did not work properly during winter.<br />
The relation between airflow velocity (U) <strong>and</strong> the outside air temperature is not linear, but can be expressed as : U = c<br />
√(Outside Air Temperature – Reversibility Threshold Temperature) (Ohata et al. 1994). C is an empirical coefficient depending<br />
upon structural conditions. For the Gros Chadoua, the results fit well with a coefficient c between 0.25 <strong>and</strong> 0.5. For<br />
Dreveneuse-d’en Bas, results are better with a smaller coefficient (0.10).<br />
When the wind hole was disconnected from the open air environment by a snowcover, the differential pressure sensors revealed<br />
for most of all the winter season that the pressure contrast between the inside <strong>and</strong> the outside was dependant on the<br />
external temperature. This pressure low at the base of the snow cover is assumed to be caused dynamically by the ascent of<br />
relatively warmer light air throughout the debris accumulation. This process forces the external air to penetrate in the<br />
ground through the snow cover in the lowermost part of the system.<br />
Figure 1. Air flow velocity <strong>and</strong> direction (outflow or aspiration) linked with the outside air temperature in the Gros Chadoua, between 25.<br />
October <strong>and</strong> 12. November 2007.<br />
Despite these instruments were normally intended for open-air measurements, a range of airflow velocity has been determined.<br />
The results show that the airflow is maintained by a simple relation determined by the pressure gradient resulting from<br />
temperature difference between the inside <strong>and</strong> the outside air. The circulation of air inside porous debris accumulation is<br />
also a continuous process, even after the development of a snowcover.
REFERENCES<br />
Delaloye, R., & Lambiel C. 2007: Drilling in a low elevation cold talus slope (Dreveneuse, Swiss Prealps). Geophysical<br />
Research Abstracts 9: 10907.<br />
Morard, S., Delaloye, R. & Dorthe J. 2008: Seasonal thermal regime of a mid-latitude ventilated debris accumulation.<br />
Proceedings of the Ninth International Conference on <strong>Permafrost</strong>, July 2008, Fairbanks, Alaska, 1233-1238.<br />
Ohata, T., Furukawa, T. & Higuchi K. 1994: Glacioclimatological study of perennial <strong>ice</strong> in the Fuji <strong>ice</strong> cave, Japan, Part 1,<br />
Seasonal variation <strong>and</strong> mechanism of maintenance. Arctic <strong>and</strong> Alpine Research, vol. 26, 3. 227-237.<br />
6.1<br />
Inventory of geomorphosites of Bavona <strong>and</strong> Rovana valleys (Ticino)<br />
Pagano Luca<br />
6670 Avegno, luca.pagano@gmail.com<br />
During the last decade, research on geomorphological heritage has improved due to the development of geotourism <strong>and</strong><br />
geoparks <strong>and</strong> to the activity of the Working group on Geomorphosites of the International Association of Geomorphologists.<br />
Several methods (see Reynard <strong>and</strong> Coratza, 2007) were developed for assessing the quality of geomorphosites – that is l<strong>and</strong>forms<br />
to which a value can be given due to human perception <strong>and</strong>/or utilization (Panizza, 2001). The aim is to reduce subjectivity<br />
<strong>and</strong> to facilitate the selection of the most representative sites, worth to be protected <strong>and</strong>/or promoted.<br />
Inspired by several approaches developed during the last decade, Reynard et al. (2007) developed at the Institute of Geography<br />
of Lausanne University an assessment method of geomorphosites. The method allows assessing the scientific, ecological,<br />
aesthetic, cultural <strong>and</strong> economic values of geomorphosites <strong>and</strong> to note more descriptive data in order to set up a site inventory.<br />
The assessment is divided in two categories of criteria: the central (scientific value) <strong>and</strong> additional (ecological, economic,<br />
aesthetic <strong>and</strong> cultural) values.<br />
The assessment method was applied on two alpine valleys in the Southern Swiss Alps. More precisely, we focused on the selection<br />
<strong>and</strong> the assessment of Bavona <strong>and</strong> Rovana valleys’ geomorphosites (Maggia Valley, Ticino). 28 l<strong>and</strong>forms with a scientific<br />
central value were identified <strong>and</strong> studied. Results show that Calnegia hanging valley obtains the most important score<br />
<strong>and</strong> is just followed by the Basòdino Glacier, a small <strong>ice</strong> cap glacier. One site, the fossil proglacial margin of the Basòdino<br />
Glacier W, represents an incredible geodiversity due to the glacio-karstic origin of Pian del Ghiacciaios polje.<br />
After the inventory stage, we noted that, on the ground, geomorphology is not much known in comparison with the high<br />
value of some geomorphosites. Thus, in order to acknowledge them by the general public, we offered some perspectives with<br />
the intention of promoting the geomorphological heritage of the region. Firstly, the definition of categories of protection<br />
would contribute to preserve the vulnerable geomorphosites towards human impacts. Secondly, we underline the value of<br />
some interesting sites of the inventory with the idea of promoting a sustainable tourist development. Geodiversity is indeed<br />
poorly taken into account for the (geo)tourist development of the region.<br />
REFERENCES:<br />
Pagano, L. 2008: Inventaire des géotopes géomorphologiques du Val Bavona et du Val Rovana. Sélection, evaluation et<br />
perspectives. Mémoire de L<strong>ice</strong>nce. Université de Lausanne.<br />
Panizza, M. 2001: Geomorphosites, concepts, methods <strong>and</strong> examples of geomorphological survey. Chinese science bulletin<br />
46, Suppl. Vol., 4-6.<br />
Reynard, E. & Coratza, P. 2007: Geomorphosites <strong>and</strong> geodiversity: a new domain of research. Geographica Helvetica 62, 3:<br />
138-139.<br />
Reynard, E. Fontana, G. Kozlic, L. Scapozza, C 2007: A method for assessing « scientific » <strong>and</strong> « additional values » of<br />
geomorphosites. Geographica Helvetica, 62, 3: 148-158.<br />
1 3<br />
Symposium 6: Apply! <strong>Snow</strong>, <strong>ice</strong> <strong>and</strong> <strong>Permafrost</strong> <strong>Science</strong> + <strong>Geomorphology</strong>
1<br />
Symposium 6: Apply! <strong>Snow</strong>, <strong>ice</strong> <strong>and</strong> <strong>Permafrost</strong> <strong>Science</strong> + <strong>Geomorphology</strong><br />
6.20<br />
Evaluation des effets de l’enneigement artificiel sur la chimie du sol:<br />
Cas de Crans-Montana-Aminona, Valais<br />
Parisod Julien*, Senn Claudia*, Pfeifer Hans-Rudolf * & Vennemann Torsten*<br />
*Institut de Minéralogie et de Géochimie, Faculté des Géosciences et de l’Environnement, Université de Lausanne, Anthropole, CH-1015<br />
Lausanne, Suisse.<br />
Ce travail traite des éventuels impacts sur la chimie du sol dû à l’utilisation de l’enneigement artificiel, ainsi qu’à celle<br />
d’additif qui permet une production de neige de culture à des températures plus hautes. Le but est de déterminer s’il existe<br />
des impacts sur la chimie du sol, par comparaison des résultats d’analyse entre différents profils de sols, soumis et non<br />
soumis à l’enneigement artificiel, et d’évaluer l’ampleur de ces derniers s’il existe. La neige artificielle est produite par pulvérisation<br />
d’eau mélangée à de l’air comprimée, ce qui forme des microgouttelettes qui vont s’agglomérer sur des noyaux de<br />
congélations pour former des cristaux de neige (Brillaud et al., 2005 et Campion, 2002). Il ne semble donc pas qu’un apport<br />
en élément, de surcroît polluant, soit à craindre, pour autant que l’eau utilisée ne soit pas polluée (ou que n’y retrouve pas<br />
un ou plusieurs éléments dans des concentrations anormalement élevées). Cependant, l’utilisation d’un additif est parfois
présente, ce qui était le cas pour une partie des installations du domaine skiable de Cran-Montana-Aminona jusqu’en 2007.<br />
L’additif le plus souvent utilisé est une protéine bactérienne appelée INP (Ice Nucleation Protein, Graether et Jia, 2001) produite<br />
par <strong>Snow</strong>max®. Cette protéine joue le rôle de noyau de congélation, et favorise ainsi la formation de cristaux de neige<br />
à des températures plus élevées (soit environ – 2°C au lieu de -4°C sans). Une utilisation croissante de l’enneigement artificielle,<br />
lié à l’utilisation, dans certains cas, d’un additif d’origine bactérienne, est bien souvent à l’origine de craintes vis-à-vis<br />
de l’environnement. Ce travail ne prétend pas répondre à la question « L’utilisation de l’enneigement artificielle, avec ou<br />
sans additif, est-il à l’origine d’une pollution des sols ? », mais, se place plutôt comme un point de départ, afin de déterminer<br />
si des impacts directs ou indirects sur la chimie du sols sont imputable à l’utilisation de cette technologie, notamment un<br />
apport en composés azotés qui serait lié à la présence de l’additif d’origine protéinique. Nous avons échantillonné trois « types»<br />
de sols : soumis à l’enneigement uniquement naturel, à l’enneigement artificiel sans additif et naturel et à l’enneigement<br />
artificiel avec additif et naturel, ainsi que différents «types» de neige afin de vérifier l’origine l’apport en certains éléments:<br />
neige naturel, neige artificielle sans additif et avec, neige mixte naturelle-artificielle sans additif et avec. Nous avons également<br />
échantillonné différentes eaux provenant de ruisseaux alimentés par la fonte de neige naturelle, artificielle avec et<br />
sans additif afin d’éventuellement constaté un transfert dans ces eaux (Fig. 1). Dans le but de passer en revue un maximum<br />
d’éléments (chimiques) ainsi que les propriétés de base (pH, granulométrie), présents dans le sol, nous avons effectué les<br />
analyses suivantes :<br />
• composition en éléments majeurs et traces par fluorescence X<br />
• composition ionique par chromatographie sur extractions<br />
• dosage du carbone total, organique et minéral par coulométrie (sur échantillons solides) et analyseur élémentaire de C<br />
dissout (sur extractions)<br />
• analyses CHN (sur échantillons solides)<br />
• analyses qualitatives spécifiquement des composés protéiniques par spectroscopie par fluorescence UV-Visible et absorbance<br />
• dosage de protéines totales par la méthode de Bradford (sur les extractions).<br />
Les résultats montrent que globalement, il existe peu de variations de concentrations des éléments analysés pouvant être<br />
corrélés avec l’utilisation de l’enneigement artificiel que ce soit avec ou sans additif. Il n’y a notamment pas d’apports flagrants<br />
en composés azotés malgré l’utilisation d’un additif de nature protéinique et d’origine bactérienne. Les seuls éléments<br />
dont on peut redouter un apport, du fait que des concentrations relativement élevées dans les échantillons de neige<br />
artificielle avec et sans additif, sont le magnésium, le calcium ainsi que le sulfate. Cependant, ce dernier étant un anion, une<br />
retention dans les sols est peu probable. Ce dernier se retrouve en concentrations plus élevées dans les eaux de ruisseaux,<br />
alimentés par les eaux de fonte de neige mixte, donc avec présence de neige artificielle avec et sans additif. Il est toutefois<br />
difficile de corréler ces concentrations plus élevées avec un apport direct dû à l’utilisation de l’enneigement artificiel, aux<br />
vues de la dynamique des systèmes d’alimentation des ruisseaux, et de la date de prélèvement des échantillons. Nous pouvons<br />
donc conclure qu’un impact sur la chimie du sol (pour la part de ce domaine exploré dans ce travail), n’est pas clairement<br />
observable, et est dans tous les cas pas d’une ampleur importante. Cependant, nos résultats nous montrent également<br />
qu’il serait intéressant de faire des recherches se dirigeant dans le domaine de la biochimie du sol, plus particulièrement le<br />
développement et l’activité bactérienne.<br />
Figure : 1 : Schéma des différentes voies possibles de transfert des composés chimiques de la neige artificielle dans les différents comparti-<br />
ments<br />
REFERENCES<br />
Brillaud M-A., Luez A., Rodicq M. (2005), Neige de culture et <strong>Snow</strong>max : quels impacts sur la santé, Rapport Atelier Santé-<br />
Environnement Ecole Nationale de la Santé Publique, Rennes. Récupéré sur http://www.tourisme.gouv.fr/fr/navd/<br />
mediatheque/publication.<br />
Campion T (2002), Impact de la neige de culture, Rapport de l’Agence de l’Eau Rhône Méditerrannée Corse.<br />
Graether S.P., Zongchao Jia. (2001), “Modeling Pseudomonas syringae <strong>ice</strong>-nucleation protein as a β-helical protein”.<br />
Biophysical Journal, 80, pp. 1169-1173.<br />
1<br />
Symposium 6: Apply! <strong>Snow</strong>, <strong>ice</strong> <strong>and</strong> <strong>Permafrost</strong> <strong>Science</strong> + <strong>Geomorphology</strong>
1 6<br />
Symposium 6: Apply! <strong>Snow</strong>, <strong>ice</strong> <strong>and</strong> <strong>Permafrost</strong> <strong>Science</strong> + <strong>Geomorphology</strong><br />
6.21<br />
Spatial variability of glacier elevation changes in the Swiss Alps obtained<br />
from differencing two DEMs<br />
Paul Frank* & Haeberli Wilfried*<br />
* Department of Geography, University of Zurich, Winterthurerstr. 190, CH-8057 Zurich (frank.paul@geo.uzh.ch)<br />
During the past 25 years massive glacier thinning has been observed in the Alps. This is documented by direct mass balance<br />
measurements on nine regularly observed glaciers as well as field evidence (e.g. disintegration of glacier tongues, increased<br />
areas of rock outcrops, collapsing rock walls, revised hiking trails) at several sites (Paul et al., 2007). However, it remained<br />
uncertain how representative the nine directly measured glaciers are for the volume change of the entire Alps. A possible<br />
way of assessing the representativity is to subtract two digital elevation models (DEMs) from two points in time which are of<br />
sufficient accuracy with respect to the expected changes.<br />
For the Swiss Alps, a DEM with 25 m spatial resolution (DEM25) was generated by swisstopo around 1985. In February 2000<br />
a near-global DEM was acquired by interferometric techniques during the Shuttle Radar Topography Mission (SRTM). This<br />
DEM is available for free from an ftp-server at 90 m (or 3") spatial resolution. It offers now the unique opportunity to assess<br />
glacier elevation changes over the entire Alps by subtracting it from an earlier DEM (like the DEM25 in Switzerl<strong>and</strong>). It has<br />
to be noted that both DEMs could have larger errors in the (snow-covered) accumulation area of glaciers. For the DEM25, the<br />
stereo matching of optical aerial photography suffers from poor contrast over snow <strong>and</strong> the SRTM DEM has some uncertainty<br />
due to a variable snow penetration depth of the C-b<strong>and</strong> radar beam.<br />
For mainly two reasons we have not corrected the elevation dependent bias of the SRTM elevations which was reported in<br />
earlier studies. One reason is that a similar bias results as an artefact when DEMs of different cell size are subtracted (Paul,<br />
in press), the other is that a huge portion of glaciers would get positive elevation changes (mass gains) in the accumulation<br />
area, which is highly unlikely during the period 1985 to 1999.<br />
For this study we have calculated glacier specific elevation changes from 1985 to 1999 for about 1050 glaciers larger than 0.1<br />
km 2 in the Swiss Alps (Paul <strong>and</strong> Haeberli, 2008). The changes refer to the glacier geometry of 1973 which is close to the 1985<br />
glacier extent (Paul et al., 2004) <strong>and</strong> digitally available for all glaciers in Switzerl<strong>and</strong>. In order to compare the results with<br />
the direct measurements, two mean volume change values (in meter water equivalent, m w.e.) are calculated. One is (method<br />
A) the arithmetic mean of the individual mean changes of all glaciers <strong>and</strong> another one is (method B) the mean value for the<br />
entire glacierized area that does not consider individual glaciers (all glaciers together are taken as one glacier entity).<br />
The analysis reveals strong thickness losses (partly >80 m) for flat / low-lying glacier tongues <strong>and</strong> a strong overall surface lowering<br />
also for glacier tongues under a thick debris cover. The difference image (Fig. 1) displays fine spatial details of the<br />
change.<br />
Apart from the obvious massive downwasting of the tongue of Triftglacier, it clearly reveals that some glaciers (e.g. Stein,<br />
Kehlen, Damma) have been larger in 1985 than in 1973 as the zone of thinning is outside the 1973 extent. The mean cumulative<br />
mass balance of the nine glaciers with direct measurements (-10.8 m w.e.) agrees well with the mean change (method<br />
B) for the Swiss Alps from DEM differencing (-11 m w.e.) <strong>and</strong> can thus be considered to be representative for the Alps. Mean<br />
thickness change of individual glaciers is correlated with their size, elevation, <strong>and</strong> exposure to solar irradiation. This implies<br />
that mass losses of large glaciers can be underestimated when they are directly inferred from values measured at the generally<br />
much smaller glaciers in the mass balance network. Indeed, the mean change with method (A) is only -7.0 m w.e. <strong>and</strong><br />
thus much less negative than the field derived value. In particular the large regions at low elevations from the largest <strong>ice</strong><br />
masses contribute to the stronger loss.<br />
REFERENCES<br />
Paul, F. In press: Calculation of glacier elevation changes with SRTM: Is there an elevation dependent bias? Journal of<br />
Glaciology.<br />
Paul, F. & Haeberli, W. 2008: Spatial variability of glacier elevation changes in the Swiss Alps obtained from two digital<br />
elevation models. Geophysical Research Letters, doi:10.1029/2008GL034718.<br />
Paul, F., Kääb, A. & Haeberli, W. 2007: Recent glacier changes in the Alps observed from satellite: Consequences for future<br />
monitoring strategies. Global <strong>and</strong> Planetary Change, 56, 111-122.<br />
Paul, F., Kääb, A., Maisch, M., Kellenberger, T. W. & Haeberli, W. 2004: Rapid disintegration of Alpine glaciers observed with<br />
satellite data. Geophysical Research Letters, 31, L21402, doi:10.1029/2004GL020816.
6.22<br />
GlobGlacier: A new ESA project to map the world's glaciers from space<br />
Paul Frank*, Kääb Andreas**, Rott Helmut***, Shepherd Andrew**** & Strozzi Tazio*****<br />
* Department of Geography, University of Zurich, Winterthurerstr. 190, CH-8057 Zurich (frank.paul@geo.uzh.ch)<br />
** Department of Geosciences, University of Oslo, Oslo, Norway<br />
*** Environmental Earth Observation (Enveo), Innsbruck, Austria<br />
**** School of Geosciences, University of Edinburgh, Edinburgh, Great Britain<br />
***** Gamma Remote Sensing, Gümligen, Switzerl<strong>and</strong><br />
Changes of glaciers <strong>and</strong> <strong>ice</strong> caps are key indicators of climatic change, mostly due to their enhanced <strong>and</strong> well recognizable<br />
reaction to small climatic variations. They have thus been selected as one of the essential climate variables (ECVs) in the<br />
global climate observing system (GCOS) <strong>and</strong> their monitoring is organized in a tiered strategy within the global terrestrial<br />
network for glaciers (GTN-G). Within GTN-G, annual measurements of mass balance (c. 50 glaciers) <strong>and</strong> length changes (c. 550<br />
glaciers) are performed <strong>and</strong> in the world glacier inventory (WGI) detailed data exist as point information for about 71'000<br />
glaciers, which is c. 40% of the estimated 160'000 glaciers worldwide. Thus, (1) the current sample of glaciers with annual<br />
measurements is very small <strong>and</strong> might be not representative for the changes at a global scale <strong>and</strong> (2) the WGI is not complete<br />
<strong>and</strong> difficult to use for change assessment (point data). As melting glaciers <strong>and</strong> <strong>ice</strong> caps might provide an even larger<br />
contribution to global sea level rise in the coming decades than the two continental <strong>ice</strong> sheets, there is an urgent necessity<br />
to generate more complete <strong>and</strong> representative data sets (GCOS, 2006).<br />
While the large potential of multispectral satellite data for glacier mapping is already utilized by the GLIMS initiative to<br />
create a digital database of glacier outlines, the full potential of satellite data for determination of glacier mass balance or<br />
length changes in a systematic way remain to be explored. As the required techniques for mapping glacier snow lines, topography,<br />
elevation changes or velocity fields (all indicative for mass balance) do already exist, a remaining challenge is their<br />
integrated <strong>and</strong> systematic application to a large set of glaciers (IGOS, 2007). The here presented new ESA project GlobGlacier<br />
aims at exploring <strong>and</strong> applying the existing methods to already archived satellite data in order to contribute to existing<br />
1<br />
Symposium 6: Apply! <strong>Snow</strong>, <strong>ice</strong> <strong>and</strong> <strong>Permafrost</strong> <strong>Science</strong> + <strong>Geomorphology</strong>
1 8<br />
Symposium 6: Apply! <strong>Snow</strong>, <strong>ice</strong> <strong>and</strong> <strong>Permafrost</strong> <strong>Science</strong> + <strong>Geomorphology</strong><br />
databases (GLIMS, WGI) <strong>and</strong> observation programs (WGMS). GlobGlacier is one of ESAs data user element (DUE) activities that<br />
responds to the needs of some major users groups, which are actively involved in defining the products <strong>and</strong> assessment of<br />
the serv<strong>ice</strong> (Volden, 2007).<br />
The products that will be generated by GlobGlacier include (see Fig. 1): glacier outlines <strong>and</strong> terminus positions for 20'000<br />
units each, snowlines <strong>and</strong> topographic information for 5000 units each, elevation changes for 1000 units <strong>and</strong> velocity fields<br />
for 200 units. The techniques to be applied vary with the product <strong>and</strong> the sensor <strong>and</strong> include optical <strong>and</strong> microwave satellite<br />
data as well as laser altimetry (cf. Paul et al., subm.). Glacier outlines will be derived from multispectral sensors (mainly<br />
L<strong>and</strong>sat TM/ETM+) using well established methods (b<strong>and</strong> ratios with threshold) combined with manual editing <strong>and</strong> GIS-based<br />
data fusion at three different levels of detail: Level 0 (L0): outlines enclosing contiguous <strong>ice</strong> masses that are corrected for<br />
misclassification (e.g. debris, shadow, water); L1: individual glaciers that result from combining L0 outlines with hydrologic<br />
divides; L2: outlines from L1 combined with DEM data to obtain a detailed glacier inventory. The terminus position will be<br />
marked where the central flowline crosses the glacier terminus. <strong>Snow</strong> lines will also be derived from optical imagery based<br />
on terrain <strong>and</strong> atmospherically corrected albedo values. The topography information is basically derived from the freely<br />
available SRTM DEM <strong>and</strong> complemented by DEMs from optical stereo sensors (e.g. ASTER, SPOT) <strong>and</strong> interferometric techniques<br />
(e.g. using ERS1/2 SAR data) in regions outside the SRTM coverage. Elevation changes will be calculated by differencing<br />
DEMs from two points in time <strong>and</strong> by comparing spot elevations from laser altimeters at orbit crossing points. Finally,<br />
velocity fields will be derived from feature tracking of repeat pass optical imagery or from microwave sensors using differential<br />
SAR interferometry or offset-tracking. The time period analysed will depend on the available satellite data <strong>and</strong> vary<br />
from seasonal to annual means.<br />
REFERENCES<br />
GCOS 2006: Systematic Observation Requirements for Satellite-based Products for Climate - Supplemental details to the<br />
satellite-based component of the Implementation Plan for the Global Observing System for Climate in Support of the<br />
UNFCCC. GCOS Report 107, WMO/TD No. 1338, 103 pp.<br />
IGOS 2007: Integrated Global Observing Strategy Cryosphere Theme Report - For the Monitoring of our Environment from<br />
Space <strong>and</strong> from Earth. Geneva: World Meteorological Organization. WMO/TD-No. 1405. 100 pp.<br />
Paul, F., A. Kääb, H. Rott, A. Shepherd, T. Strozzi, & E. Volden subm.: GlobGlacier: Mapping the worlds glaciers <strong>and</strong> <strong>ice</strong> caps<br />
from space. Earsel eProceedings.<br />
Volden, E. 2007: ESAs GlobGlacier project. In: CliC Ice <strong>and</strong> Climate News, Issue 9, 8.<br />
Figure 1. Schematic overview of the workflow, the workpackages <strong>and</strong> the generated products of the GlobGlacier project.
6.23<br />
Rapid permafrost degradation induced by non-conductive heat transfer<br />
within a talus slope at Flüela Pass, Swiss Alps.<br />
Phillips Marcia*, Zenklusen Mutter Evelyn*, Kern-Luetschg Martina*<br />
*WSL Institute for <strong>Snow</strong> <strong>and</strong> Avalanche Research SLF Davos (phillips@slf.ch)<br />
Talus formations are an important type of debris storage in mountain environments <strong>and</strong> the degradation of <strong>ice</strong> within them<br />
can lead to the triggering of mass movements or to structure instability (Phillips <strong>and</strong> Margreth 2008). Numerous surface<br />
investigations have shown that the inner structure of talus formations <strong>and</strong> hence the processes occurring there can be complex.<br />
However, few direct measurements exist, for example in boreholes. One of the earliest studied talus slopes in the Swiss<br />
Alps is a NE oriented, 25-35° slope located at Flüela Pass, ranging between 2380 <strong>and</strong> 2600 m asl. The slope is bounded by a<br />
rock wall at the top <strong>and</strong> by a lake at the base. Geophysical investigations in the 1970s indicated the presence of ground <strong>ice</strong><br />
at the base of the slope, thinning upslope <strong>and</strong> not occurring at the top (Haeberli 1975). The presence of permafrost was attributed<br />
to the persistence of avalanche debris at the base of the slope in summer <strong>and</strong> later also to local differences in surface<br />
roughness (Lerjen et al. 2003).<br />
Two 20 m deep boreholes were drilled at the site in 2002, confirming the presence of <strong>ice</strong> at the base of the slope (Luetschg<br />
et al. 2004). Borehole B1 is located at 2501 m asl (midslope) <strong>and</strong> B2 is at 2394 m (near the base of the slope). Borehole stratigraphies<br />
showed the presence of varying amounts of <strong>ice</strong> between 3 <strong>and</strong> 10 m depth <strong>and</strong> the occurrence of coarse blocks interspersed<br />
with large voids at 9 – 14 m depth in B1 <strong>and</strong> at 10 –17 m depth in B2; the material presumably originates from<br />
para-/postglacial rockfall deposits or blocky Egesen moraines, which were subsequently covered with firn/<strong>ice</strong> <strong>and</strong> finer<br />
clasts.<br />
Borehole temperature measurements have been carried out in B1 <strong>and</strong> B2 since 2002, using 12 YSI 44008 thermistors <strong>and</strong><br />
Campbell CR10X loggers in each borehole. Meteorological data was obtained near to the slope in a flat area of Flüela Pass.<br />
During the measurement period (2002-2007) active layer depths have remained very constant at 3 m, even during the summer<br />
2003 heat wave, pointing to the ongoing presence of <strong>ice</strong> below 3m. In 2003 the permafrost body in B2 was 7 m thick,<br />
between 3 <strong>and</strong> 10 m depth. By July 2008 its thickness had halved <strong>and</strong> was located between 3 <strong>and</strong> 6.5 m depth. This rapid<br />
permafrost degradation was triggered from below.<br />
Borehole temperature data also indicate the occurrence of thermal anomalies at around 10 m depth in B1 <strong>and</strong> around 15 m<br />
depth in B2. The temperature curves here display a much higher variability <strong>and</strong> amplitude than those measured just above<br />
<strong>and</strong> below. This suggests the occurrence of intra-talus ventilation through the large voids within the coarse blocky material,<br />
a phenomenon driven by the expulsion of the relatively warmer <strong>and</strong> less dense intra-talus air in winter, leading to the aspiration<br />
of cold external air into the base of the slope (Delaloye <strong>and</strong> Lambiel 2005). The phenomenon is particularly effective<br />
with cold air temperatures <strong>and</strong> low snow depths <strong>and</strong> can also occur in summer when air temperatures are below 0°C.<br />
The presence of voids <strong>and</strong> the evidence of the occurrence of intra-talus ventilation suggest that non-conductive heat-transfer<br />
processes, in particular latent heat effects, are contributing to the extremely rapid thinning of the permafrost <strong>ice</strong> from below.<br />
As the intra-talus air is drawn through the snow cover into the voids <strong>and</strong> because temperature gradient induced vapour<br />
migration occurs from below, the intra-talus air must have a high moisture content; when this air comes into contact with<br />
the frozen ground <strong>and</strong> the dew point is reached, condensation will occur, releasing energy <strong>and</strong> enhancing permafrost degradation.<br />
The latent heat of condensation is high (2.5 MJ kg -1 ), so little vapour is required to cause significant warming.<br />
Further investigations such as gas-tracer experiments, local microclimatological measurements <strong>and</strong> more detailed borehole<br />
temperature measurements will be required to analyze the causes <strong>and</strong> effects of the intra-talus ventilation in detail. The<br />
existing measurements deliver interesting information on possible mechanisms of currently occurring permafrost degradation<br />
in alpine talus slopes.<br />
REFERENCES<br />
Delaloye, R., <strong>and</strong> Lambiel, C. 2005. Evidences of winter ascending air circulation throughout talus slopes <strong>and</strong> rock glaciers<br />
situated in the lower belt of alpine discontinuous permafrost (Swiss Alps). Norsk geogr. Tidsskr., 59: 194-201.<br />
Haeberli, W. 1975. Untersuchungen zur Verbreitung von <strong>Permafrost</strong> zwischen Flüelapass und Piz Grialetsch (Graubünden).<br />
Zurich.<br />
Lerjen, M., Kääb, A., Hoelzle, M., <strong>and</strong> Haeberli, W. 2003. Local distribution of discontinuous mountain permafrost. A process<br />
study at Flüela Pass, Swiss Alps. In Eighth International Conference on <strong>Permafrost</strong>. Edited by S.A. Phillips. Zurich. Swets<br />
& Zeitlinger, Vol.1, pp. 667-672.<br />
1<br />
Symposium 6: Apply! <strong>Snow</strong>, <strong>ice</strong> <strong>and</strong> <strong>Permafrost</strong> <strong>Science</strong> + <strong>Geomorphology</strong>
200<br />
Symposium 6: Apply! <strong>Snow</strong>, <strong>ice</strong> <strong>and</strong> <strong>Permafrost</strong> <strong>Science</strong> + <strong>Geomorphology</strong><br />
Luetschg, M., Stoeckli, V., Lehning, M., Haeberli, W., <strong>and</strong> Ammann, W. 2004. Temperatures in two boreholes at Flüela Pass,<br />
Eastern Swiss Alps: the effect of snow redistribution on permafrost distribution patterns in high mountain areas.<br />
<strong>Permafrost</strong> <strong>and</strong> Periglacial Processes, 15: 283-297.<br />
Phillips, M., <strong>and</strong> Margreth, S. 2008. Effects of ground temperature <strong>and</strong> slope deformation on the serv<strong>ice</strong> life of snowsupporting<br />
structures in mountain permafrost: Wisse Schijen, R<strong>and</strong>a, Swiss Alps. In 9th International Conference on<br />
<strong>Permafrost</strong>. Edited by D.L. Kane <strong>and</strong> K.M. Hinkel. Fairbanks, Alaska. Institute of Northern Engineering, University of<br />
Alaska Fairbanks, Vol.2, pp. 1417-1422.<br />
6.2<br />
Rockglacier dynamics in the Swiss Alps – comparing kinematics <strong>and</strong><br />
thermal regimes in the Murtèl-Corvatsch region<br />
Roer Isabelle*, Hoelzle Martin*,**, Haeberli Wilfried* & Kääb Andreas ***<br />
* Glaciology, Geomorphodynamics & Geochronology; Geography Department, University of Zurich, Winterthurerstrasse 190, CH – 8057<br />
Zürich (iroer@geo.uzh.ch)<br />
** Department of Geosciences, University of Fribourg, Chemiin du musée 6, CH – 1700 Fribourg<br />
*** Department of Geosciences, University of Oslo, Postbox 1047 Blindern, NO - 0316 Oslo<br />
In the context of the recent climatic changes <strong>and</strong> their impact on the cryosphere, permafrost environments play a key role<br />
due to their sensitivity towards thermal changes <strong>and</strong> resulting geomorphological response. The indicative role of rockglaciers<br />
in these geosystems was emphasized only recently (e.g., Haeberli et al. 2006), but was up to now mainly restricted to<br />
temperature variations within the permafrost body as well as variations in active layer thickness. Within the last decade, an<br />
increasing number of studies monitored <strong>and</strong> quantified the creep behaviour of rockglaciers in the European Alps <strong>and</strong> observed<br />
increasing surface displacements since the 1990s (e.g., Schneider & Schneider 2001, Lambiel & Delaloye 2004, Kääb et al.<br />
2007). In this context it is described, that the Alpine rockglaciers show a rather synchronous behaviour <strong>and</strong> respond sensitively<br />
to recent temperature increase (Roer et al. 2005, Kääb et al. 2007, Delaloye et al. 2008). There seems to be a strong indication<br />
that the observations are related to a warming of the shearzone within the individual rockglaciers (Arenson et al.<br />
2002).<br />
The presentation aims at the combined analysis of rockglacier kinematics <strong>and</strong> thermal characteristics in the Murtèl-<br />
Corvatsch region, one of the best equipped permafrost research sites.<br />
REFERENCES<br />
Arenson, L.U., Hoelzle, M. & Springman, S. 2002: Borehole deformation measurements <strong>and</strong> internal structure of some rock<br />
glaciers in Switzerl<strong>and</strong>. <strong>Permafrost</strong> <strong>and</strong> Periglacial Processes 13: 117-135.<br />
Delaloye, R., Perruchoud, E., Avian, M., Kaufmann, V., Bodin, X., Hausmann, H., Ikeda, A., Kääb, A., Kellerer-Pirklbauer, A.,<br />
Krainer, K., Lambiel, C., Mihajlovic, D., Staub, B., Roer, I. & Thibert, E. 2008: Recent interannual variations of rock glacier<br />
creep in the European Alps. In: Kane, D.L. & K.M. Hinkel (eds.) Ninth International Conference on <strong>Permafrost</strong> (Fairbanks,<br />
Alaska) 1: 343-348.<br />
Haeberli, W., Hallet, B., Arenson, L., Elconin, R., Humlum, O., Kääb, A., Kaufmann, V., Ladanyi, B., Matusoka, N., Springman,<br />
S. & Vonder Mühll, D. 2006: <strong>Permafrost</strong> creep <strong>and</strong> rock glacier dynamics. <strong>Permafrost</strong> <strong>and</strong> Periglacial Processes 17: 189-<br />
214.<br />
Kääb, A., Frauenfelder, R. & Roer, I. 2007: On the response of rockglacier creep to surface temperature increase. Global <strong>and</strong><br />
Planetary Change 56: 172-187.<br />
Lambiel, C. & Delaloye, R. 2004: Contribution of real-time kinematic GPPS in the study of creeping mountain permafrost:<br />
examples from the Western Swiss Alps. <strong>Permafrost</strong> <strong>and</strong> Periglacial Processes 15: 229-241.<br />
Roer, I., Avian, M., Delaloye, R., Lambiel, C., Bodin, X., Thibert, E., Kääb, A., Kaufmann, V., Damm, B. & Langer, M. 2005:<br />
Rockglacier „speed-up“ throughout European Alps – a climatic signal? Proceedings of the Second European Conference<br />
on <strong>Permafrost</strong>, Potsdam, Germany, June 2005: 101-102.<br />
Schneider, B. & Schneider, H. 2001: Zur 60jährigen Messreihe der kurzfristigen Geschwindigkeits-schwankungen am<br />
Blockgletscher im Äusseren Hochebenkar, Ötztaler Alpen, Tirol. Zeitschrift für Gletscherkunde und Glazialgeologie 37,<br />
1: 1-33.
6.2<br />
Electromagnetic Prospecting in Alpine <strong>Permafrost</strong>: Examples from the<br />
Southern Swiss Alps<br />
Scapozza Cristian*, Gex Pierre**, Lambiel Christophe* & Reynard Emmanuel*<br />
*Institut de Géographie, Université de Lausanne, Anthropole, CH-1015 Lausanne (Cristian.Scapozza@unil.ch)<br />
**Institut de Géophysique de l’Université de Lausanne, Amphipôle, CH-1015 Lausanne<br />
Within the framework of geomorphological <strong>and</strong> glaciological investigations of the Lateglacial <strong>and</strong> Holocene glacier/permafrost<br />
evolution in the Canton Ticino (Southern Swiss Alps), several geophysical methods (frequency-domain electromagnetic<br />
lateral mapping <strong>and</strong> 2D resistivity profiling, direct-current resistivity soundings, self-potential measurements <strong>and</strong> thermal<br />
prospecting) have been used for mapping the permafrost distribution at the local scale (Scapozza 2008; Scapozza et al. 2008).<br />
In this context, the application of electromagnetic geophysical methods in the prospecting of alpine permafrost is a recent<br />
<strong>and</strong> not well-developed approach (see, for example, Hauck 2001).<br />
In this study, two frequency-domain electromagnetic methods were used: the field ground conductivity-meter Geonics EM-31<br />
<strong>and</strong> the VLF-R (Very-Low Frequency Resistivity) resistivity-meter Geonics EM-16R. The Geonics EM-31 operates at a fixed frequency<br />
<strong>and</strong> allows to determine the spatial apparent conductivity <strong>and</strong> inphase variations in the survey area (McNeill 1980).<br />
The inphase is proportional to the magnetic susceptibility of the ground. The depth of investigation depends to the spacing<br />
between transmitter <strong>and</strong> receiver (3.66 m for the EM-31) <strong>and</strong> to the frequency (9.8 kHz). According to the polarisation of the<br />
instrument, the depth of investigations is around 6 m with the vertical dipoles (VD) <strong>and</strong> around 3 m with the horizontal<br />
dipoles (VH). The VLF-R technique uses electromagnetic energy radiated by a very low frequency (VLF) transmitter (Cagniard<br />
1953). In this study the Rhauderfehn transmitter (23.4 kHz) located in Germany (near Bremen) was used. The measurement<br />
of the horizontal component of the electric field (E) <strong>and</strong> of the horizontal magnetic component (H) perpendicular to the<br />
azimuth of the transmitting station allows to know the apparent resistivity of the near surface. The ratio between H <strong>and</strong> E<br />
gives a phase angle that changes according to variations of resistivity with the depth. The combined inversion of apparent<br />
resistivity <strong>and</strong> phase angle data allows us to realize 2D VLF-R tomography with a two-layer resolution.<br />
The measurement carried out on the Piancabella rockglacier (Blenio Valley) (Fig. 1A) show that permafrost occurrence is<br />
probable, with maximal resistivities at the front of the rockglacier <strong>and</strong> a decrease of the values toward upslope, as expected<br />
by geomorphological observations <strong>and</strong> other geophysical measurements (see Scapozza 2008). In particular, the electromagnetic<br />
prospecting allows us to know approximately the active layer depth <strong>and</strong> the permafrost resistivity, as shown in the<br />
VLF-R tomography (Fig. 1B). This example shows that electromagnetic prospecting in alpine permafrost offers good possibilities<br />
to map the spatial apparent resistivity (i.e. the permafrost distribution) (EM-31 <strong>and</strong> VLF-R) <strong>and</strong>/or to obtain information<br />
concerning the structure of the prospected terrains (VLF-R tomography).<br />
REFERENCES<br />
Cagniard, L. 1953: Basic theory of the magneto-telluric method of geophysical prospecting. Geophysics 18, 605-635.<br />
Hauck, C. 2001: Geophysical methods for detecting permafrost in high mountains. Mitteilungen der VAW-ETH Zürich No.<br />
171.<br />
McNeill, J.D. 1980: Electromagnetic terrain conductivity measurements at Low Induction Numbers. Mississauga, Geonics<br />
Ltd., Technical Note TN-6.<br />
Scapozza, C. 2008: Contribution à l’étude géomorphologique et géophysique des environnements périglaciaires des Alpes<br />
Tessinoises orientales. Lausanne, Institut de Géographie (MSc Thesis, published on February 28, 2008, on http://doc.rero.<br />
ch/).<br />
Scapozza, C., Gex, P., Lambiel, C. & Reynard, E. 2008: Contribution of self-potential (SP) measurements in the study of alpine<br />
periglacial l<strong>and</strong>forms: examples from the Southern Swiss Alps. Proceedings of the 9th International Conference on<br />
<strong>Permafrost</strong>, Fairbanks, AK, 29 June – 3 July 2008, 1583-1588.<br />
201<br />
Symposium 6: Apply! <strong>Snow</strong>, <strong>ice</strong> <strong>and</strong> <strong>Permafrost</strong> <strong>Science</strong> + <strong>Geomorphology</strong>
202<br />
Symposium 6: Apply! <strong>Snow</strong>, <strong>ice</strong> <strong>and</strong> <strong>Permafrost</strong> <strong>Science</strong> + <strong>Geomorphology</strong><br />
Figure 1. A: VLF-R (EM-16R) <strong>and</strong> EM-31 profiles along the Piancabella rockglacier. B: VLF-R tomography of the profile SCE-VLF08.
6.26<br />
<strong>Permafrost</strong> Map of the Eastern Ticino Alps<br />
Scapozza Cristian*, Mari Stefano**, Valenti Giorgio***, Strozzi Tazio****, Gex Pierre*****, Fontana Georgia*, Müller Guy*,<br />
Lambiel Christophe*, Delaloye Reynald** & Reynard Emmanuel*<br />
*Institut de Géographie, Université de Lausanne, Anthropole, CH-1015 Lausanne (Cristian.Scapozza@unil.ch)<br />
**Département des Géosciences, Géographie, Université de Fribourg, Chemin du Musée 4, CH-1700 Fribourg<br />
***Sezione Forestale Cantonale, Viale Franscini 17, CH-6500 Bellinzona<br />
****GAMMA Remote Sensing, Worbstrasse 225, CH-3073 Gümlingen<br />
*****Institut de Géophysique, Université de Lausanne, Amphipôle, CH-1015 Lausanne<br />
The permafrost distribution <strong>and</strong> characteristics in the Southern Swiss Alps are poorly known because of lack of research<br />
dedicated to this morphoclimatic context of the Alps during the last decades. In spite of the interest for the cryosphere reactions<br />
to climate warming, only few scientific studies were carried out until now in the periglacial belt of the Ticino Alps.<br />
Within the framework of geomorphological <strong>and</strong> geophysical investigations on the Lateglacial <strong>and</strong> Holocene glacier/permafrost<br />
evolution in the Southern Swiss Alps (see Scapozza & Reynard 2007; Scapozza 2008; Scapozza et al. 2008), a regional<br />
model based on an inventory of 75 rockglaciers was developed to simulate the permafrost distribution in the Eastern Alps<br />
of the Canton Ticino (Fig. 1). The model used is based on the assumption that the permafrost distribution at the regional<br />
scale depends mainly on altitude <strong>and</strong> orientation (topoclimatic parameters) <strong>and</strong> that the minimal altitude of active/inactive<br />
rockglaciers can be used as an indicator of the lower limit of discontinuous permafrost. The model was calibrated by thermal<br />
<strong>and</strong> geophysical prospecting, in order to asses the permafrost distribution at the local scale. Moreover, several sites were<br />
equipped for long-term studies. At the moment, in the Eastern Ticino Alps (Fig. 1), the followings studies are carried out:<br />
- Geomorphological mapping <strong>and</strong> geophysical prospecting <strong>and</strong> monitoring in the Sceru Valley. The geophysical prospecting<br />
was carried out with frequency-domain electromagnetic lateral mapping <strong>and</strong> 2D resistivity profiling (Geonics EM-16R <strong>and</strong><br />
EM-31), direct-current (DC) resistivity soundings, self-potential measurements, <strong>and</strong> thermal prospecting (miniature ground<br />
temperature data loggers <strong>and</strong> spring temperatures) (Scapozza 2008; Scapozza et al. 2008). On the Piancabella rockglacier <strong>and</strong><br />
on the Gana Rossa talus slope, a ground- surface temperature <strong>and</strong> self-potential monitoring network was set up.<br />
- Geomorphological mapping, direct-current (DC) resistivity soundings, ground-surface temperatures <strong>and</strong> real-time kinematic<br />
(RTK) GPS monitoring for studying the dynamics of creeping permafrost in the Northern side of the Cima di Gana Bianca,<br />
particularly on the Stabbio di Largario rockglacier (Valenti 2006; Müller, in prep.).<br />
- ERS InSAR (space-borne synthetic aperture radar interferometry) signatures inventory to estimate both magnitude <strong>and</strong><br />
spatial pattern of slope motion in the periglacial belt of the Ticino Alps, in particular in the Gothard region <strong>and</strong> in the Blenio<br />
Valley.<br />
In the next years, the study <strong>and</strong> the equipment of others sites for permafrost research <strong>and</strong> monitoring is planned in the Val<br />
Bedretto region <strong>and</strong> in the Greina region. The goal is to better known the cryosphere reaction to recent climate warming in<br />
order to assess <strong>and</strong> quantify the processes related with permafrost degradation in high mountain environments.<br />
REFERENCES<br />
Müller, G. in prep.: La dégradation du pergélisol liée aux changements climatiques et les risques associés. Le cas du versant<br />
Nord de Cima di Gana Bianca (Val di Blenio, Tessin). Lausanne, Institut de Géographie (MSc Thesis).<br />
Scapozza, C. 2008: Contribution à l’étude géomorphologique et géophysique des environnements périglaciaires des Alpes<br />
Tessinoises orientales. Lausanne, Institut de Géographie (MSc Thesis, published on February 28, 2008, on http://doc.rero.<br />
ch/).<br />
Scapozza, C. & Reynard, E. 2007: Rock glaciers e limite inferiore del permafrost discontinuo tra la Cima di Gana Bianca e la<br />
Cima di Piancabella (Val Blenio, TI). Geologia Insubrica 10, 21-32.<br />
Scapozza, C., Gex, P., Lambiel, C. & Reynard, E. 2008: Contribution of self-potential (SP) measurements in the study of alpine<br />
periglacial l<strong>and</strong>forms: examples from the Southern Swiss Alps. Proceedings of the 9th International Conference on<br />
<strong>Permafrost</strong>, Fairbanks, AK, 29 June – 3 July 2008, 1583-1588.<br />
Valenti, G. 2006: Il permafrost in Ticino. Dati, statistiche e società 6(2), 46-50.<br />
203<br />
Symposium 6: Apply! <strong>Snow</strong>, <strong>ice</strong> <strong>and</strong> <strong>Permafrost</strong> <strong>Science</strong> + <strong>Geomorphology</strong>
20<br />
Symposium 6: Apply! <strong>Snow</strong>, <strong>ice</strong> <strong>and</strong> <strong>Permafrost</strong> <strong>Science</strong> + <strong>Geomorphology</strong><br />
Figure 1. <strong>Permafrost</strong> <strong>and</strong> rockglaciers distribution in the Eastern Ticino Alps.<br />
6.2<br />
Conceptualising sediment cascades to enhance dynamic<br />
geomorphological mapping<br />
Theler David*, Bardou Eric**, Reynard Emmanuel*<br />
*Institut de Géographie, Université de Lausanne, Quartier Dorigny, CH-1015 Lausanne (david.theler@unil.ch)<br />
**Bureau IDEALP Ingénieurs Sàrl, Rue de la Marjorie 8, CH-1950 Sion<br />
Research focusing on geomorphological mapping often concerns the establishment of l<strong>and</strong>forms inventories at large scales.<br />
The main disadvantage of the maps produced is their static character. In fact, available geomorphological legend systems are<br />
not always sufficient for mapping alpine environments with high geomorphological activity. A good example is illustrated<br />
by torrential systems where dynamic processes like channelised debris flows occur <strong>and</strong> where l<strong>and</strong>forms associated to these<br />
processes may change very fast in time <strong>and</strong> space scales. Assessing sediment volumes that supply debris flow channels is<br />
one of the key parameters to mitigate disasters on places geomorphologically concerned by fluvial processes (Zimmermann<br />
et al. 1997). Data derived through GIS spatial analysis based on high accuracy digital elevation models (slopes, aspect, hydrographic<br />
network <strong>and</strong> delineation of subwatersheds) might be of high interest for mapping dynamic geomorphological processes<br />
as shown by an attempt done for Bruchi torrential system in the Swiss Alps (Theler et al. in press). This paper proposes<br />
to use GIS tools coupled with a qualitative conceptualisation of the system, what should open new opportunities for geomorphological<br />
mapping. An example is presented for a torrential system in the Swiss Alps.<br />
The different parts of the system are conceptualised in order to depict the sediment transfers on a mountain flank (Fig. 1,
2). Sediment transfer starts from the hillslopes (1), where physical weathering followed by gravitational processes are predominant.<br />
The time of residence of sediments is very variable depending on the topographic setting <strong>and</strong> the intensity of processes<br />
<strong>and</strong> could be related to a complex stochastic function (e.g. Hegg, 1997). Sediments may have a second repository when<br />
they reach the active gully (2). Here, the time of residence depends on water runoff. It could be explained by less complex<br />
functions, because transfer is done only through two processes – debris flow or bed load transport. These two phenomena<br />
transfer sediments very actively <strong>and</strong> therefore do not store them for long (3). When they reach the fan (4) sediments transported<br />
by active geomorphic phenomena could either be stored (5) or transit directly to the effluent (6). Following these<br />
previous observations debris transfer are then replaced into the global erosion system. This could help to highlight with<br />
which part of the system volume assessment model are playing. The global scheme can be summarised by a tank cascade as<br />
depicted in Figure 2. The size of the tank is referred to the potential residence time of sediments (the difference in size on<br />
the graph must be seen in a logarithm perspective).<br />
Figure 1. Place of debris flow <strong>and</strong> bed load transport into the erosive system.<br />
Figure 2. Tank cascade for sediment transfer <strong>and</strong> l<strong>and</strong>scape elements where the different formula are applied.<br />
REFERENCES<br />
Theler, D. & Reynard, E. in press: Assessing sediment transfer dynamics from geomorphological maps: Bruchi torrential<br />
system, Swiss Alps. Journal of Maps 2008.<br />
Hegg, C., 1997. Zur Erfassung und Modellierung von gefährlichen Prozessen in steilen Wildbacheinzugsgebieten, G 52.<br />
Geographisches Institut der Universität Bern, Bern.<br />
Zimmermann, M., Mani, P. & Romang, H. 1997: Magnitude-frequency aspects of alpine debris flows. Eclogae geol. Helv., 90,<br />
415–420.<br />
20<br />
Symposium 6: Apply! <strong>Snow</strong>, <strong>ice</strong> <strong>and</strong> <strong>Permafrost</strong> <strong>Science</strong> + <strong>Geomorphology</strong>
206<br />
Symposium 6: Apply! <strong>Snow</strong>, <strong>ice</strong> <strong>and</strong> <strong>Permafrost</strong> <strong>Science</strong> + <strong>Geomorphology</strong><br />
6.28<br />
Glacier volcano interactions <strong>and</strong> related hazards during the 200<br />
eruptive crisis at Nevado del Huila, Colombia<br />
Worni Raphael*, Pulgarín Bernardo**, Agudelo Adriana**, Huggel Christian*<br />
*Department of Geography, University of Zurich, Switzerl<strong>and</strong> (raphael_worni@gmx.net)<br />
**INGEOMINAS Popayán, Colombia<br />
Nevado del Huila, a glacier-covered volcano in the South of Colombia’s Cordillera Central, has not experienced any historical<br />
eruptions. In February <strong>and</strong> April 2007 the volcano erupted with two comparably small phreatic events. Each eruption was<br />
accompanied by the formation of large fissures in the Huila summit region of 2 km length <strong>and</strong> 50-80 m width with continued<br />
strong fumarolic activity after the eruptions. The eruptions produced lahars that travelled 150 km down the Paez River,<br />
with flow volumes of several million m 3 <strong>and</strong> ≈40 million m 3 for the February <strong>and</strong> April events, respectively. The water content<br />
of the April flow is estimated at ≈25 million m 3 .<br />
The eruption <strong>and</strong> glacier related dynamics were analyzed using air-borne photography, QuickBird <strong>and</strong> Aster satellite imagery.<br />
It was found that glaciers were not affected by the eruptions in a magnitude that would correspond to the amount of<br />
<strong>ice</strong>-melt generated water necessary to produce the observed lahar flow volumes. Instead, indications of flow paths suggested<br />
that most of the water that formed the lahars was expelled from the fissures, stemming from hydrothermal water reservoirs.<br />
Channels of a few meters depth incised in glacier <strong>ice</strong> provided evidence of water flow over the glaciers with temperatures<br />
likely exceeding 80°C. Sediment was deposited on the glaciers <strong>and</strong> further downstream. During the April eruption the lowermost<br />
part of the El Oso glacier failed, probably as an avalanche with about 0.5 million m 3 of <strong>ice</strong>. The mechanism that<br />
caused this glacier failure is not yet well understood but could be related to hot water released from the summit fissures<br />
that entered the base of the glacier <strong>and</strong> provoked a sudden reduction of shear strength at the glacier-bedrock interface.<br />
The underst<strong>and</strong>ing of the volcano-<strong>ice</strong> interactions on Nevado del Huila <strong>and</strong> related formation of large lahars is important in<br />
view of the resulting severe hazards. The particularly large dimension of the lahars associated with the 2007 eruptions leave<br />
space for discussion as to the origin of such large amounts of water. A literature review suggested that drainage of similarly<br />
large hydrothermal water reservoirs during eruptive activity is very rare. More investigations are therefore needed to better<br />
constrain the relevant processes.<br />
As to the future conditions at Nevado del Huila, it is most likely that glaciers will continue to respond to ongoing atmospheric<br />
warming. In the last 20 years glaciers were found to have shrunk by 30% to a current size of 10.7 km 2 , with an estimated<br />
<strong>ice</strong> volume equivalent to 410 million m 3 of water. The current rate of retreat suggests glaciers could disappear completely in<br />
the second half of the 21 st century, <strong>and</strong> hence still represent a major source of hazard when interacting with volcanic activity<br />
resulting large lahars.<br />
6.2<br />
Analyses of newly digitised snow series over the last 100 years+ in<br />
Switzerl<strong>and</strong><br />
Wüthrich Christian*, Begert Michael*, Scherrer Simon C.*, Croci-Maspoli Mischa*, Appenzeller Christof*, Weingartner Rolf**<br />
*Bundesamt für Meteorologie und Klimatologie MeteoSchweiz, Krähbühlstrasse 58, Postfach 514, CH-8044 Zürich, christian.wuethrich@<br />
meteoswiss.ch<br />
**Geographisches Institut der Universität Bern, Gruppe für Hydrologie, Hallerstrasse 12, CH-3012 Bern<br />
<strong>Snow</strong> is on the one h<strong>and</strong> an important commercial factor especially in the Swiss Alpine region (tourism, hydro-electricity,<br />
drinking water) <strong>and</strong> on the other h<strong>and</strong> responsible for considerable hazards like avalanches. In addition, snow is an excellent<br />
indicator to detect climate change. Hence, high-quality long-term snow series are crucial for reliable analyses.<br />
In the presented study 12 Swiss snow series with daily measurements since at least 1910 (one dating back to 1864, cf. Fig. 1)<br />
<strong>and</strong> altitudes between 450 <strong>and</strong> 2500 m asl have been analysed. The objectives were twofold. First, suitable long-term snow<br />
series have been selected, missing data digitized <strong>and</strong> the entire series quality checked. Second, the long-term snow series
have been used for trend analyses over a time period >100 years. A snow depth reconstruction with the method of Brown <strong>and</strong><br />
Braaten (1998) using daily new snow, temperature <strong>and</strong> precipitation as input variables performed well <strong>and</strong> made it possible<br />
to analyse days with snow pack (Fig. 2).<br />
The results show that the snow cover is varying substantially on seasonal <strong>and</strong> decadal time scales, which is in line with<br />
Scherrer (2006). The analyses of the decadal new snow trends during the last 100 years shows unprecedented low new snow<br />
sums in the winter seasons (DJF) of the 1990s. The 100 year trend of days with snow pack reveals a significant decrease for<br />
stations below 800 m asl in the winter season (DJF) <strong>and</strong> for stations around 1800 m asl in the spring season (MAM). Similar<br />
results were found for seasonal new snow sums. Finally the results of the trend analyses are discussed with respect to the<br />
temperature trends.<br />
REFERENCES<br />
Brown, R.; Braaten, R.; 1998: Spatial <strong>and</strong> Temporal Variability of Canadian Monthly <strong>Snow</strong> Depths (1946-1995); Atmosphere<br />
Ocean 36 (1), 37-54.<br />
Scherrer, S.C.; 2006: Interannual climate variability in the European <strong>and</strong> Alpine region; Veröffentlichung Nr. 67 der<br />
MeteoSchweiz, Zürich.<br />
Figure 1. New snow sum series for Sils Maria (1798 m asl) 1864-2005<br />
Figure 2. Days with snow pack based on reconstructed snow depth for Sils Maria (1798 m asl) 1864-2005.<br />
6.30<br />
Evidence of warming in disturbed <strong>and</strong> undisturbed permafrost terrain at<br />
Schafberg (Pontresina, Eastern Swiss Alps)<br />
Zenklusen Mutter Evelyn*, Phillips Marcia*, Blanchet Juliette*<br />
WSL, Institute for <strong>Snow</strong> <strong>and</strong> Avalanche Research SLF, CH-7260 Davos, Switzerl<strong>and</strong> (zenklusen@slf.ch)<br />
Both climate <strong>and</strong> human influences in the form of technical structures may alter ground temperatures in mountain permafrost<br />
soils (Phillips 2006). In 1996 several boreholes were drilled into the permafrost of the Muot da Barba Peider (Schafberg)<br />
ridge above Pontresina in the Eastern Swiss Alps. This study investigates <strong>and</strong> compares the ground temperatures measured<br />
in two of these boreholes, B1 <strong>and</strong> B2.<br />
The boreholes are located 50m apart at 2960m asl in a NW oriented steep scree slope <strong>and</strong> are instrumented with 10 thermistors<br />
between 0.5m <strong>and</strong> 17.5m depth. Both locations are very similar from a climatological <strong>and</strong> geological point of view. The<br />
20<br />
Symposium 6: Apply! <strong>Snow</strong>, <strong>ice</strong> <strong>and</strong> <strong>Permafrost</strong> <strong>Science</strong> + <strong>Geomorphology</strong>
208<br />
Symposium 6: Apply! <strong>Snow</strong>, <strong>ice</strong> <strong>and</strong> <strong>Permafrost</strong> <strong>Science</strong> + <strong>Geomorphology</strong><br />
main difference between the two boreholes is that borehole B1 is located between snow-retaining avalanche defense structures<br />
whereas B2 is in the undisturbed scree slope. As a consequence, the snow cover persists longer at B1 than at B2 in<br />
early summer, thus modifying ground temperatures there.<br />
11 complete years (1997-2007) of daily borehole temperature measurements at Schafberg (Fig.1) <strong>and</strong> data delivered by a nearby<br />
meteorological station offer a first view of possible influences of climate change <strong>and</strong> technical structures on permafrost<br />
ground temperatures.<br />
For both boreholes, temporal trend analyses show significant warming for annual minimum, mean <strong>and</strong> median temperatures<br />
at depths below 10m <strong>and</strong> for annual maximum temperatures in all depths. The magnitude of these trends are all similar<br />
<strong>and</strong> at both borehole locations approximately 0.02 – 0.03°C per year, which is less than those registered for example<br />
during the same period in Sc<strong>and</strong>inavian mountain permafrost (Isaksen et al. 2007), reflecting the influence of the ridge topography,<br />
highly variable snow cover <strong>and</strong> the presence of coarse blocks at the ground surface at our study site.<br />
Analyses of the maximum annual active layer depth (defined as being the maximum annual penetration of the 0°C isotherm,<br />
(Burn 1998)) reveal that the active layer in B2 (around 2m) is almost tw<strong>ice</strong> as thick as in B1, due to small local differences<br />
in stratigraphy, hydrology <strong>and</strong> solar radiation (Rist <strong>and</strong> Phillips 2005). During the 11-year measurement period, the<br />
active layer depths in both boreholes have remained quite constant with a temporary deepening during the extremely hot<br />
summer 2003. Concerning the annual duration of the active layer, significant positive trends were found for both boreholes.<br />
Although the annual duration of the active layer at B2 is about 50% longer than at B1, the increase of the annual active layer<br />
duration at B2 (5 days per year) is lower than at B1 (6 days per year).<br />
The comparison of the temporal occurrence of annual maximum/minimum temperature in different depths gives an insight<br />
into how fast the ground reacts to seasonal warming/cooling. Cooling in winter occurs similarly at both borehole locations<br />
<strong>and</strong> near-surface warming in summer is delayed due to the presence of the insulating scree cover. Summer warming can<br />
additionally be delayed by 1 to 2 months due to the longer lasting snow cover at B1 compared to B2 (e.g. years 1999 to<br />
2001).<br />
In summary, similar warming trends over the period 1997-2007 are visible in both boreholes, indicating the registration of<br />
a common warming influence at depth, despite the cooling effect of avalanche defence structures at B1 in summer through<br />
the delay of snow melt at the end of snow-rich winters.<br />
Fig. 1: Ground temperature series in the Schafberg boreholes B1 (left) <strong>and</strong> B2 (right), 1996-2008<br />
REFERENCES<br />
Burn, C.R. 1998. The active layer: two contrasting definitions. <strong>Permafrost</strong> <strong>and</strong> Periglacial Processes, 9: 411-416.<br />
Isaksen, K., Sollid, J.L., Holmlund, P., <strong>and</strong> Harris, C. 2007. Recent warming of mountain permafrost in Svalbard <strong>and</strong><br />
Sc<strong>and</strong>inavia. Journal of Geophysical Research, 112(F02S04, doi: 10.1029/2006JF000522).<br />
Phillips, M. 2006. Avalanche defence strategies <strong>and</strong> monitoring of two sites in mountain permafrost terrain, Pontresina,<br />
Eastern Swiss Alps. Natural Hazards, 39: 353-379.<br />
Rist, A., <strong>and</strong> Phillips, M. 2005. First results of investigations on hydrothermal processes within the active layer above alpine<br />
permafrost in steep terrain. Norsk geogr. Tidsskr., 59: 177-183.