Health Status among Older Immigrants in the United States
Health Status among Older Immigrants in the United States
Health Status among Older Immigrants in the United States

Create successful ePaper yourself
Turn your PDF publications into a flip-book with our unique Google optimized e-Paper software.
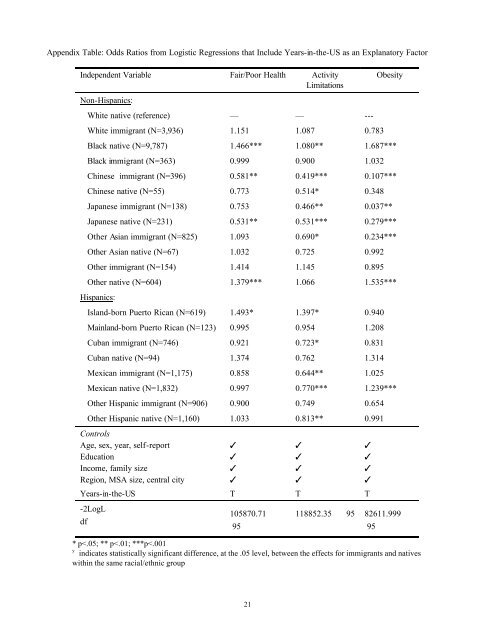
Appendix Table: Odds Ratios from Logistic Regressions that Include Years-<strong>in</strong>-<strong>the</strong>-US as an Explanatory FactorIndependent Variable Fair/Poor <strong>Health</strong> ActivityLimitationsObesityNon-Hispanics:White native (reference) — — ---White immigrant (N=3,936) 1.151 1.087 0.783Black native (N=9,787) 1.466*** 1.080** 1.687***Black immigrant (N=363) 0.999 0.900 1.032Ch<strong>in</strong>ese immigrant (N=396) 0.581** 0.419*** 0.107***Ch<strong>in</strong>ese native (N=55) 0.773 0.514* 0.348Japanese immigrant (N=138) 0.753 0.466** 0.037**Japanese native (N=231) 0.531** 0.531*** 0.279***O<strong>the</strong>r Asian immigrant (N=825) 1.093 0.690* 0.234***O<strong>the</strong>r Asian native (N=67) 1.032 0.725 0.992O<strong>the</strong>r immigrant (N=154) 1.414 1.145 0.895O<strong>the</strong>r native (N=604) 1.379*** 1.066 1.535***Hispanics:Island-born Puerto Rican (N=619) 1.493* 1.397* 0.940Ma<strong>in</strong>land-born Puerto Rican (N=123) 0.995 0.954 1.208Cuban immigrant (N=746) 0.921 0.723* 0.831Cuban native (N=94) 1.374 0.762 1.314Mexican immigrant (N=1,175) 0.858 0.644** 1.025Mexican native (N=1,832) 0.997 0.770*** 1.239***O<strong>the</strong>r Hispanic immigrant (N=906) 0.900 0.749 0.654O<strong>the</strong>r Hispanic native (N=1,160) 1.033 0.813** 0.991ControlsAge, sex, year, self-reportEducationIncome, family sizeRegion, MSA size, central cityYears-<strong>in</strong>-<strong>the</strong>-US-2LogLdfTTTTT105870.7195TTTTTTTTT118852.35 95 82611.999T95* p